
1. Introduction
Gait is one of the most fundamental yet complex activities of daily living. It involves multiple muscle groups responsible for efficient human locomotion [1]. Maintaining good physical and motor function is particularly important in older adults, for whom declines in mobility often determine reductions in quality of life through social exclusion [2,3]. Changes in walk patterns may also reflect overall health status [4], as walk is an activity engaging not only the muscular system but also the nervous, cognitive, and sensory systems [5].
Aging affects walk biomechanics through reductions in muscle strength [6], slowing of information processing within the nervous system, and deterioration of balance. These processes may result in impaired stability and even falls [7]. Deterioration of health can be noticed through the prism of time-space and kinematic parameters of gait [8].
Slowing and instability of walk are also important diagnostic features in the assessment of declining motor function and in the prediction of fall risk. Many subtle changes in locomotion may remain unnoticed during everyday functioning,making their detailed clinical and biomechanical analyses crucial. Walk disturbances not only reflect the aging process but may also indicate the onset of balance impairments and the development of diseases like sarcopenia [8].
In walk research, spatiotemporal parameters are most commonly analyzed, as they provide information on an individual’s gait performance. The basic parameters include step length, step width, walk velocity, cadence (number of steps per minute), as well as the durations of individual walk phases – stance phase, swing phase, and double-support phase. These parameters enable not only the determination of quantitative walk pattern characteristics but also the identification of potential impairments in balance, rhythm, or coordination. The literature reports associations between these parameters and lifespan or quality of life. Del Din et al. [9] demonstrated that documented declines in walk velocity may serve as predictors of falls and even mortality, while increased variability in step length may be associated with reduced postural control and an elevated risk of balance loss.
Walk assessment can be performed using a variety of systems. The most accurate devices are optoelectronic systems, which provide very high measurement precision; however, tests involving the use of these systems can only be conducted in laboratory. An alternative measurement system involves inertial sensors or inertial measurment units (IMUs), as well as markerless systems or shoe inserts that enable the measurement of ground reaction forces. An important advantage of IMU sensors is their mobility and non-invasiveness, which enable fast and relatively inexpensive measurements both in laboratory conditions and in real-world environments, making them particularly suitable for measurements within the scope of this study [9]. Additionally, they enable the measurement of kinematics, velocity, and acceleration. However, IMU-based measurements are subject to certain limitations, including signal drift, sensitivity to sensor placement, and potential errors in complex movement conditions, which should be considered when interpreting the results. Although IMUs represent a relatively new and rapidly developing technology, numerous scientific publications have demonstrated their reliability and high measurement accuracy [10,11].
In clinical practice, motor function is commonly assessed using, among others, the Timed Up and Go (TUG) test. The TUG is a functional test that involves standing up from a chair, walking 3 m, turning, walking back the same distance, and sitting down again [12]. During the test, a physical therapist measures the time required to complete the task. Because the test integrates several components, such as sitting down and standing up, walking, and turning, it allows for the assessment of mobility, balance, and motor performance. The rapid development of motion capture systems and inertial sensors enables the analysis not only of the total test duration but also of the individual phases of the test, such as standing up, walking, turning, and sitting down. In addition, these systems allow for the analysis of walk over the 3 m walking distance [12].
The literature indicates that many authors emphasize the advantages of the TUG test when combined with inertial sensors (IMUs), referring to this modified version as the instrumented TUG (iTUG) test [13–15]. They note that the iTUG test enables analysis not only of test duration but also of the duration of each test phase, along with phase-specific kinematic analysis [14], while maintaining low variability in results among participants [13]. Although iTUG provides detailed kinematic and spatiotemporal data, it remains unclear to what extent these parameters correspond to those obtained during walking and whether iTUG can reflect walking performance under more controlled conditions. This issue is particularly relevant given the widespread use of the TUG test in clinical practice as a simple and quick functional assessment tool. Establishing the relationship between iTUG-derived parameters and natural walking may help to determine whether the test can provide clinically meaningful information beyond total test duration.
However, attention should be paid to the manner in which the TUG test is conducted [16]. During the TUG test, participants may move faster than during self-selected walking due to the measurement of time.
From a clinical perspective, it is crucial to determine whether gait parameters obtained during the TUG test – particularly in its instrumented version – can be interpreted as representative of natural walking. The TUG test is widely used in the functional assessment of older adults, including the evaluation of balance impairments and fall risk. However, its composite structure, which includes not only walking but also sit-to-stand transitions, stopping, and turning, may influence the observed biomechanical parameters. Therefore, understanding the relationship between parameters obtained during iTUG and habitual walking is essential for accurate clinical interpretation and for the use of these measures in monitoring rehabilitation outcomes.
The aim of this study is to evaluate the extent to which spatiotemporal and kinematic parameters obtained during the iTUG test correspond to those observed during walking with preferred speed, and to identify which parameters demonstrate the highest level of agreement thereby assessing the potential of iTUG as a proxy or complementary tool for gait assessment.
2. Methods
2.1. Participants
Sample size estimation was performed a priori based on a pilot study of the TUG test conducted on five participants, which provided estimates of the parameters required for the calculation. It was estimated based on three selected parameters used in both walking analysis and the TUG test: cadence, stride time, and velocity. Sample size estimation was performed using G-Power software (version 3.1.9.7) with a 95% confidence level and a power of 0.9. The total sample size was restricted within the range of 6–8, based on estimates of the effect size obtained in the pilot study and taking into account the nature of the study, with the aim of ensuring the feasibility of data collection while maintaining sufficient statistical power to detect the expected differences in spatiotemporal and kinematic parameters. For the purposes of the study, a group of 30 participants was assumed.The study included 30 older adults aged 60–77 years (Table 1). The mean age of the entire group was 69.67 ± 4.33 years. Inclusion criteria comprised the ability to move independently, absence of difficulties in activities of daily living, no lower-limb injuries, and no falls within the previous year.
2.2. iTUG
The TUG test was recorded using 16 inertial sensors (Noraxon MyoMotion, Noraxon U.S.A., Inc., Scottsdale, AZ, USA, sampling frequency: 200 Hz). The sensors was placed in accordance with the manufacturer’s recommendations (Noraxon). Sensors were positioned on the head, at the upper Thoracic, Lower Thorasic, pelvis, and in the middle of segments such as: upper arms, forearms, thighs, shanks, and feet. Additional sensors were placed on the pelvis to capture pelvic motion.
The execution of the TUG test consisted of six stages [12]. At the beginning of the test, participants were asked to stand up from a chair without the use of the upper limbs (stage 1), then walk a distance of 3 m to a cone (stage 2), turn around the cone (stage 3), return to the chair (stage 4), turn again (stage 5), and finally return to a seated position on the chair (stage 6). Participants were free to initiate movement with either lower limb. Prior to testing, participants were instructed to walk at a marching pace.
Based on the TUG test, spatiotemporal walk parameters were determined, including walk cadence, walk stride time, walk velocity, and the percentage contribution of individual walk phases, as well as kinematic-related parameters (pelvis titlt, hip flex, knee flexion, ankle dorsiflexion). TUG phase detection was performed automatically using the Noraxon MyoMotion software (version 4.0.9) based on the manufacturer’s predefined algorithm. Kinematic data for each identified phase were then exported and further processed in MATLAB (MathWorks, Natick, MA, USA), where mean values and standard deviations were calculated for each parameter. The analysis was limited to the walking phase, excluding turns and transitions from a sitting to a standing position and vice versa.
2.3. Walk test
The walk test consisted of walking a 10 m distance at a self-selected speed using inertial sensors (Noraxon MyoMotion; Noraxon U.S.A., Inc., Scottsdale, AZ, USA). Motion was again recorded using 16 sensors (sampling frequency: 200 Hz), and identical sensor placement as described for the TUG test, in accordance with the manufacturer’s recommendations.
Participants completed the 10 m walking task twice along a straight path, i.e., walking to the end of the path and returning along the same route. Turning phases, as well as the initial and final segments associated with walk acceleration and deceleration, were excluded from the analysis. For each participant, parameter values were averaged across the two trials.
2.4. Statistical analysis
Statistical analysis of the obtained data was performed using Statistica software (version 13.3). Mean values were calculated for parameters derived from the TUG test and from walking at a self-selected speed. A significance level of p < 0.05 was adopted for statistical analyses. Normality of distribution was assessed using the Shapiro–Wilk test, with p-value ≥ 0.05 indicating a normal distribution. Depending on the distribution normality, the significance of differences of analyzed quantitative variables between groups was verified using either the Student’s t-test or the Wilcoxon test.
Differences between continuous variables (pelvis tilt, hip flexion, knee flexion, ankle dorsiflexion) were analyzed using One-Dimensional Statistical Parametric Mapping (SPM) test. SPM t-tests (α = 0.05) were performed for each participant and their averaged data depending on the walk cycle. When the SPM exceeded the predefined threshold, a region of significant difference (gray area) was created between compared two joint movement patterns.
The agreement between measurements was assessed using the Bland–Altman method. The analyses and visualizations were conducted in JASP (version 0.95.4.0), which allows for the presentation of differences between measurements and the determination of limits of agreement according to standard statistical procedures.
Additionally, regression analyses were performed to examine the relationships between walking speed and selected spatiotemporal parameters (cadence and stride time), in order to account for the potential confounding effect of speed.
3. Results
3.1. Comparison of spatiotemporal parameters
From the TUG test and self-selected walking test, the following parameters were obtained: walk cadence, velocity, stride time, stance, swing, and single support for the left and right sides (Table 2). In addition, a percentage difference relative to walk was calculated.
Table 2
Comparison of spatiotemporal parameters and the percentage contribution of walk phases, as well as their changes, in the TUG test and the walk test
| Walk | TUG | Percentage change | p-value | ||||
|---|---|---|---|---|---|---|---|
| Mean value | Std | Mean value | Std | Mean value | Std | ||
| Cadence (steps/min) | 113.14 | 8.38 | 117.65 | 7.95 | 4.19% | 5.62% | <0.005* |
| Walk stride time (s) | 1.07 | 0.08 | 1.02 | 0.07 | −4.16% | 4.75% | <0.005* |
| Walk stance left (%) | 60.9 | 1.64 | 60.72 | 2.39 | −0.28% | 3.12% | 0.619 |
| Walk stance right (%) | 61.07 | 1.6 | 60.86 | 2.24 | −0.35% | 2.72% | 0.4849 |
| Walk swing left (%) | 39.1 | 1.64 | 39.28 | 2.39 | 0.48% | 4.99% | 0.619 |
| Walk swing right (%) | 38.93 | 1.6 | 39.14 | 2.24 | 0.57% | 4.21% | 0.4849 |
| Walk single walk support left (%) | 39.26 | 1.48 | 38.92 | 2.74 | −0.83% | 6.18% | 0.46 |
| Walk single support right (%) | 39.63 | 1.67 | 38.98 | 2.7 | −1.61% | 5.83% | 0.145 |
| Walk velocity (km/h) | 4.21 | 0.64 | 4.76 | 0.9 | 14.07% | 18.97% | <0.005* |
Note: avg - average, std- standard deviation, * p < 0.05.
Statistically significant differences were observed in cadence, stride time, and velocity when comparing self-selected walking with the walk phase of the TUG test. Statistically significant differences were observed in cadence, stride time, and velocity when comparing self-selected walking with the walking phase of the TUG test. However, cadence and stride time are inherently dependent on walking speed. Therefore, the observed differences may be largely driven by differences in velocity between conditions, raising concerns about the validity of direct comparisons between these two tests. To address this issue, additional analyses restricted to trials with comparable walking speeds between self-selected walking and the TUG test should be considered. Analysis of both statistical and percentage differences indicated that, despite significantly higher walk velocity, increased cadence, and reduced stride time during the walk phase of the TUG test, the percentage contribution of walk phases (stance, swing, and single-support) did not show statistically significant changes.
Given the influence of walk velocity on spatiotemporal parameters, linear relationships between cadence and stride time and walk velocity were analyzed in both tests. Regression analysis revealed statistically significant differences in the nature of the relationship between cadence and walk velocity in both conditions (Figure 1). Under self-selected walking conditions, a steeper regression slope and a higher coefficient of determination (R 2) were observed (y = 37.24·V + 69.59, R 2 = 0.62) compared with the TUG test (y = 14.46·V + 98.52, R 2 = 0.21), indicating a stronger dependence of cadence on walk velocity during self-selected walking. A similar pattern was observed for stride time (Figure 2), which decreased with increasing walk velocity during self-selected walking, whereas this relationship was noticeably weaker in the TUG test.These findings suggest that although the walk phase of the TUG test preserves the general direction of changes in temporal parameters with increasing walk velocity, the regulation of these parameters is less tightly linked to speed than during self-selected walking, reflecting a more complex functional walk strategy.
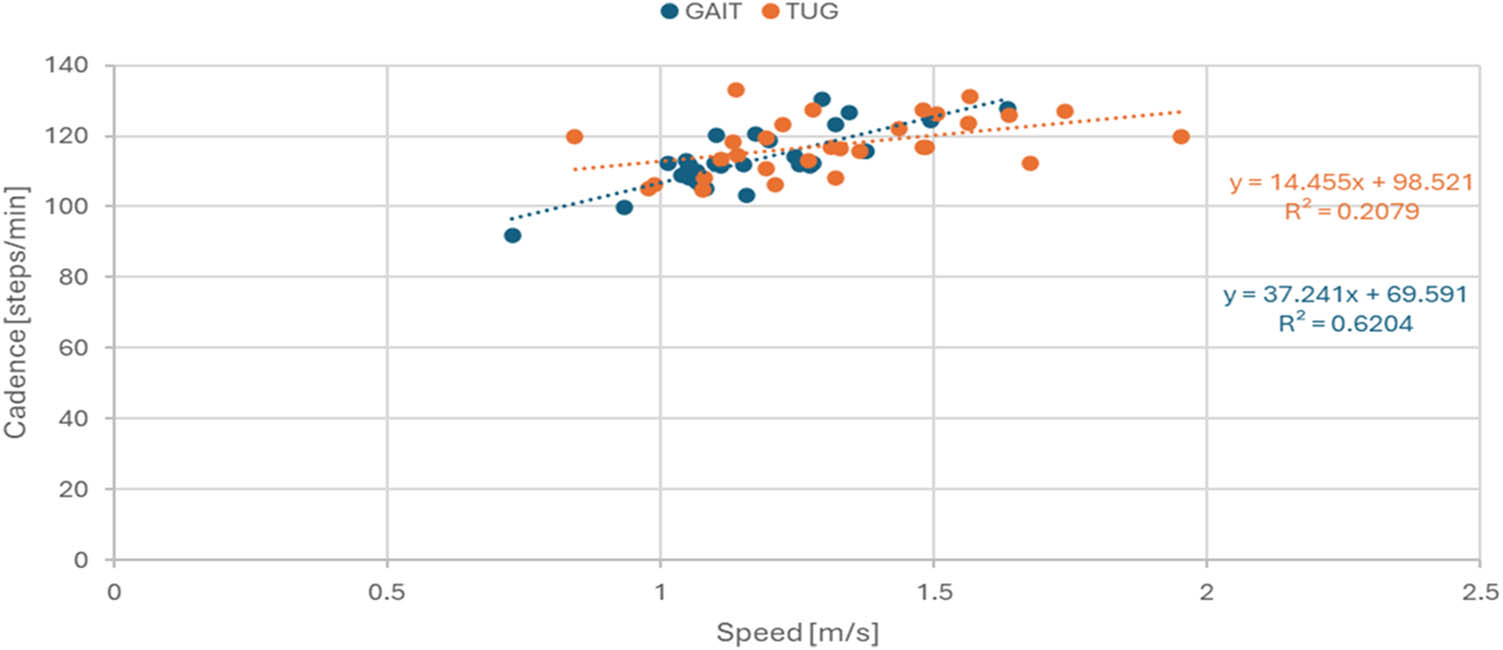
Figure 1
Relationship between cadence and walk velocity during the Up and Go test and self-selected walking.
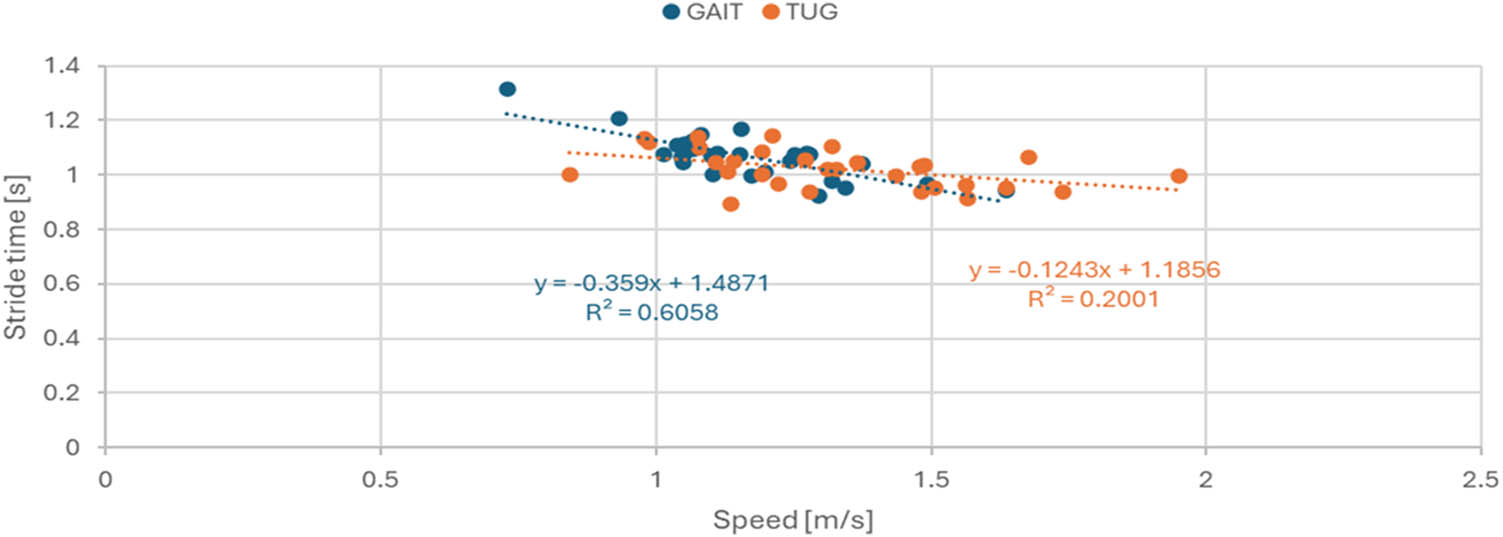
Figure 2
Relationship between stride time and walk velocity during the Up and Go test and self-selected walking.
The agreement between the gait parameters obtained during walking and the walikng phase in the iTUG test was assessed using a Bland–Altman analysis (Figure 3). For several parameters, a systematic deviation was observed, particularly with regard to walking speed, where the values obtained using the iTUG test differed significantly from the results obtained during walking. The Bland–Altman analysis indicated a small negative bias (−0.5 km/h), suggesting slightly higher gait velocity during TUG compared to continuous walking, with relatively wide limits of agreement (−2.2 to +1.0 km/h) indicating some variability between conditions. For most parameters, the bias was around zero, indicating no systematic difference between walking and walking in the iTUG test; however, a high bias value was observed for the cadence parameter. The Bland–Altman analysis revealed a negative bias of −5 steps/min, indicating that step frequency measured during the iTUG test was systematically higher compared to free walking. The limits of agreement ranged from approximately −18 to +8 steps/min, demonstrating considerable variability between conditions. No clear proportional bias was observed.
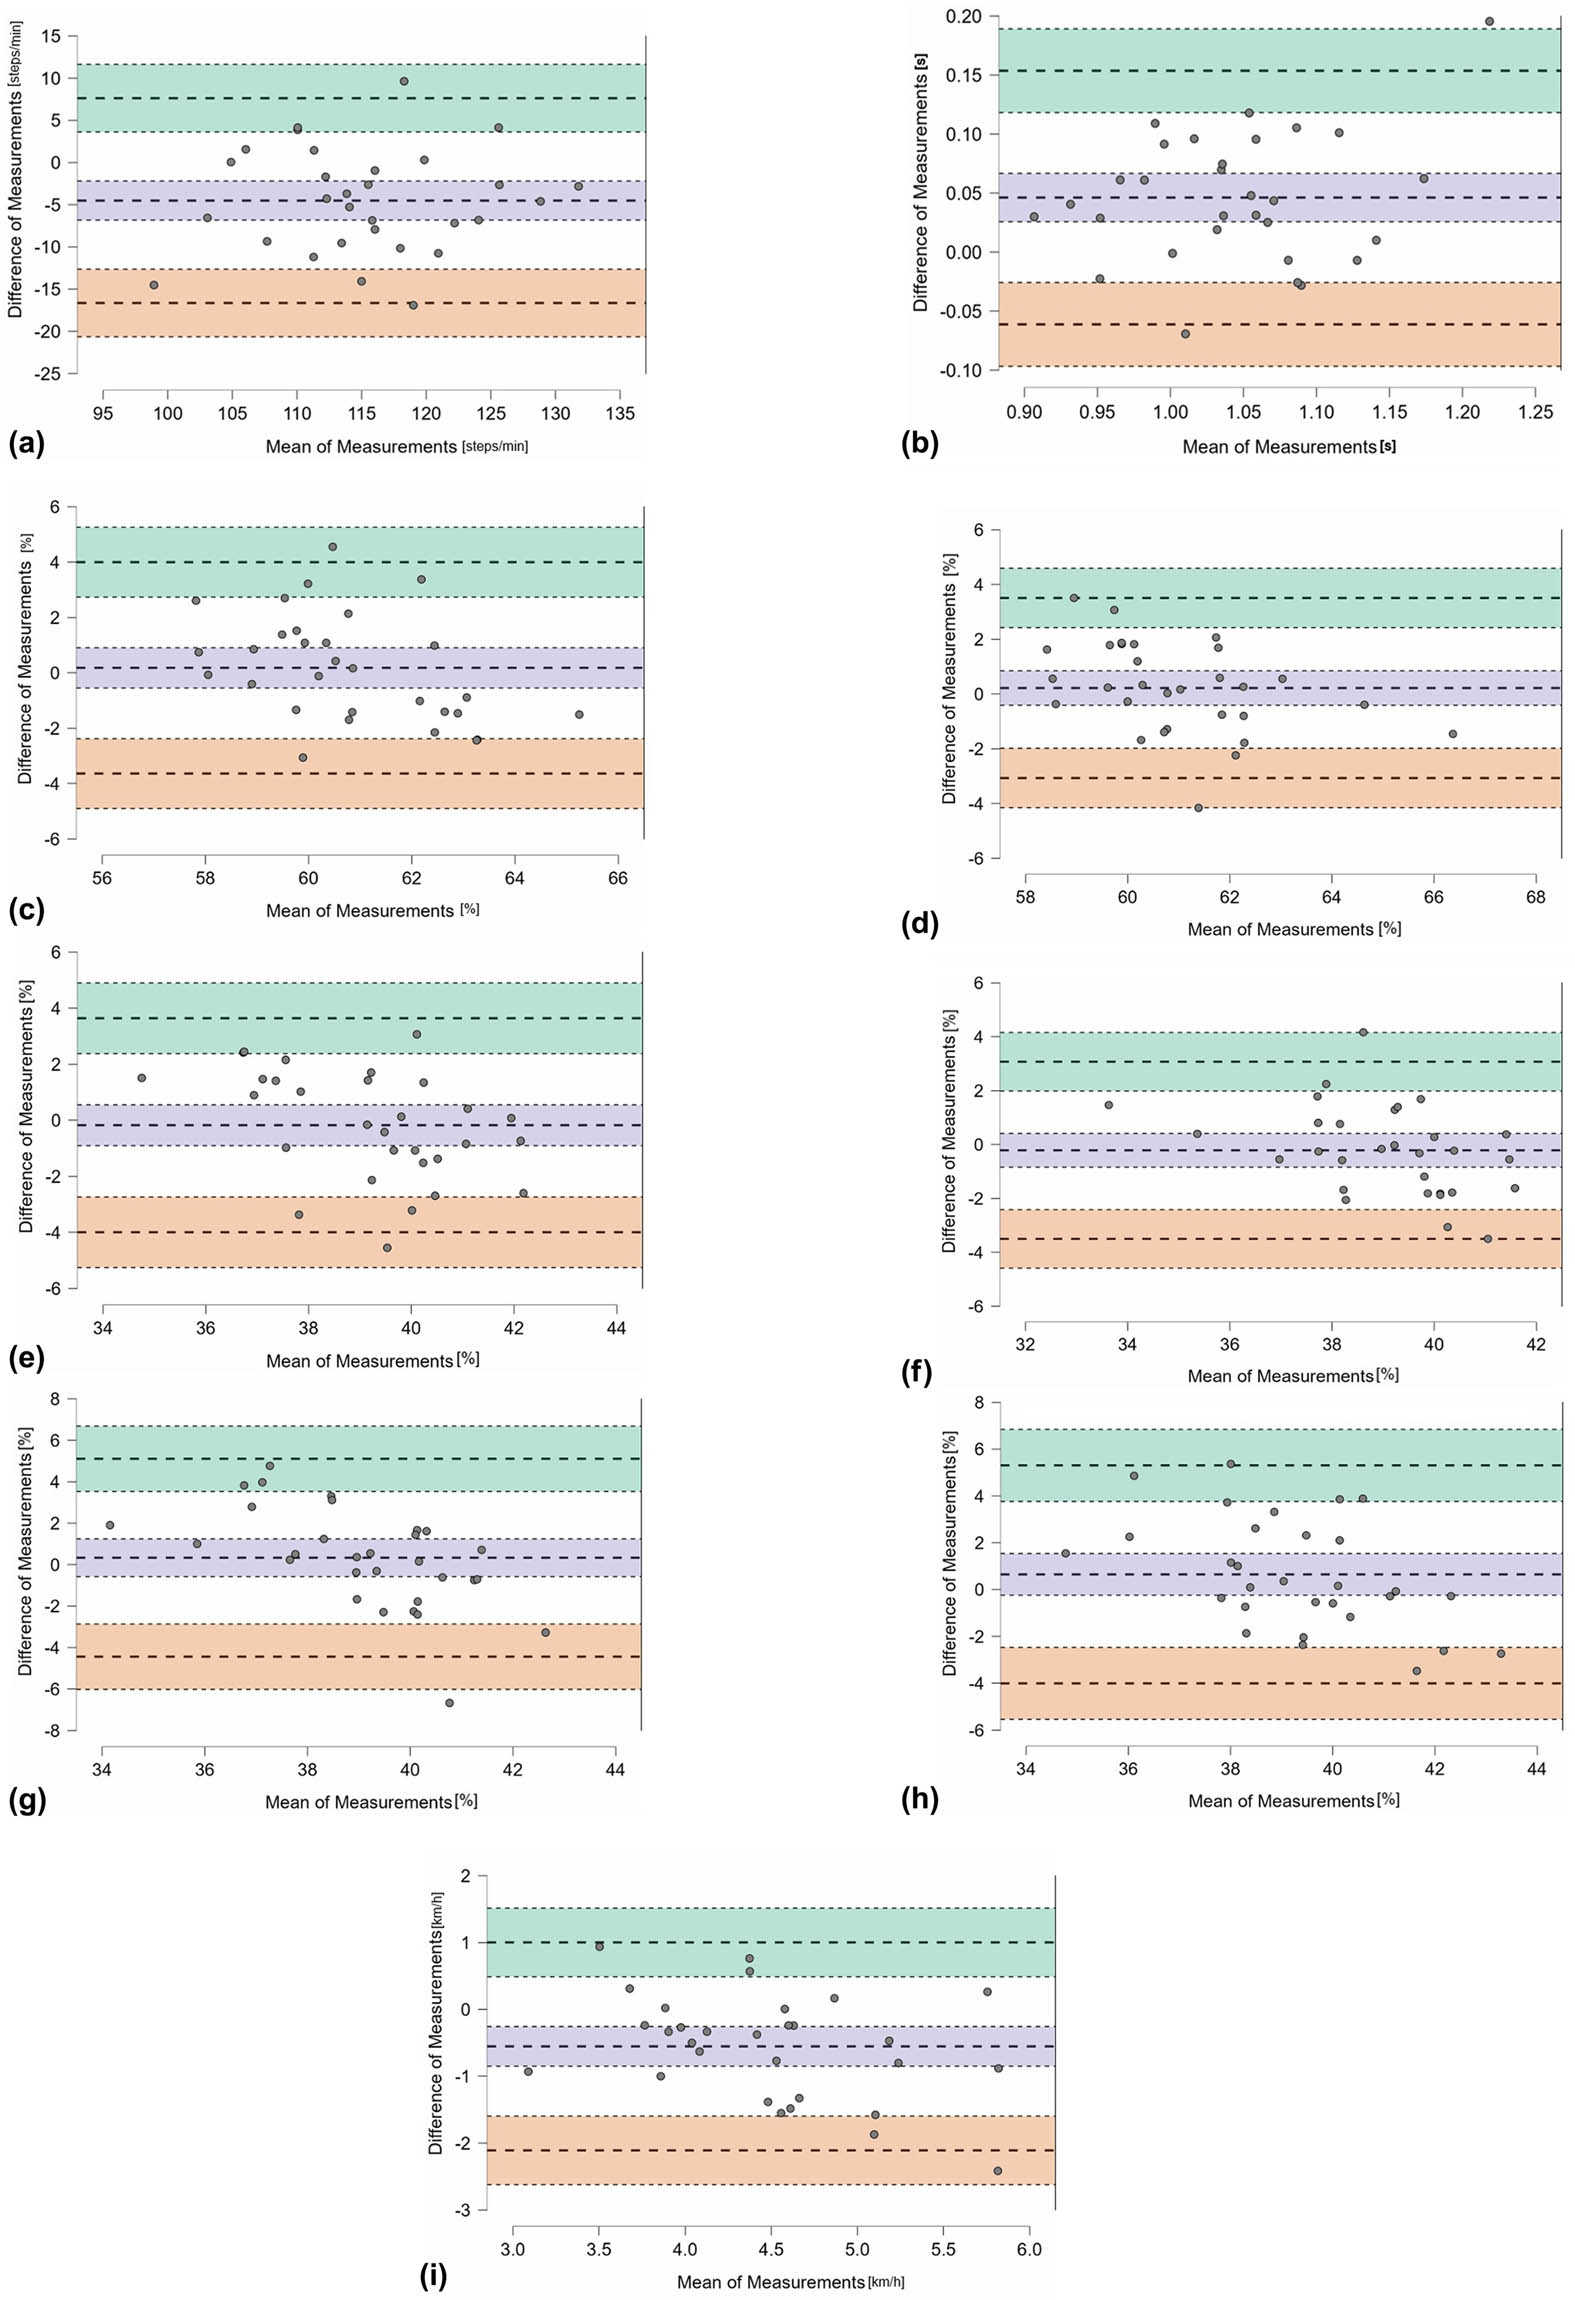
Figure 3
(a) Bland–Altman plots for agreement analysis between parameters cadence (steps/min), (b) Bland–Altman plots for agreement analysis between parameters stride time (s), (c) Bland–Altman plots for agreement analysis between parameters walk stance left (%), (d) Bland–Altman plots for agreement analysis between parameters walk stance right (%), (e) Bland–Altman plots for agreement analysis between parameters walk swing left (%), (f) Bland–Altman plots for agreement analysis between parameters walk swing right (%), (g) Bland–Altman plots for agreement analysis between parameters walk single support left (%), (h) Bland–Altman plots for agreement analysis between parameters walk single sSupport right (%), and (i) Bland–Altman plots for agreement analysis between parameters velocity (km/h).
3.2. Comparison of kinematics
For kinematic parameters, SPM analysis was performed (Figure 4). The analysis revealed no statistically significant differences in pelvic tilt, indicating that these movements were similar.In contrast, significant differences were observed for lower-limb joints during the stance phase; for the hip joint, statistically significant differences occurred between 0% and 44% and between 72% and 93% of the walk cycle; for the knee joint, between 0% and approximately 56% and between 70% and 100% of the walk cycle; and for ankle dorsiflexion, between 0% and 40% and between 87% and 100% of the walk cycle. Greater ranges of flexion were also observed for hip flexion, knee flexion, and ankle dorsiflexion during the TUG test compared with self-selected walking, indicating a more flexed lower-limb posture.
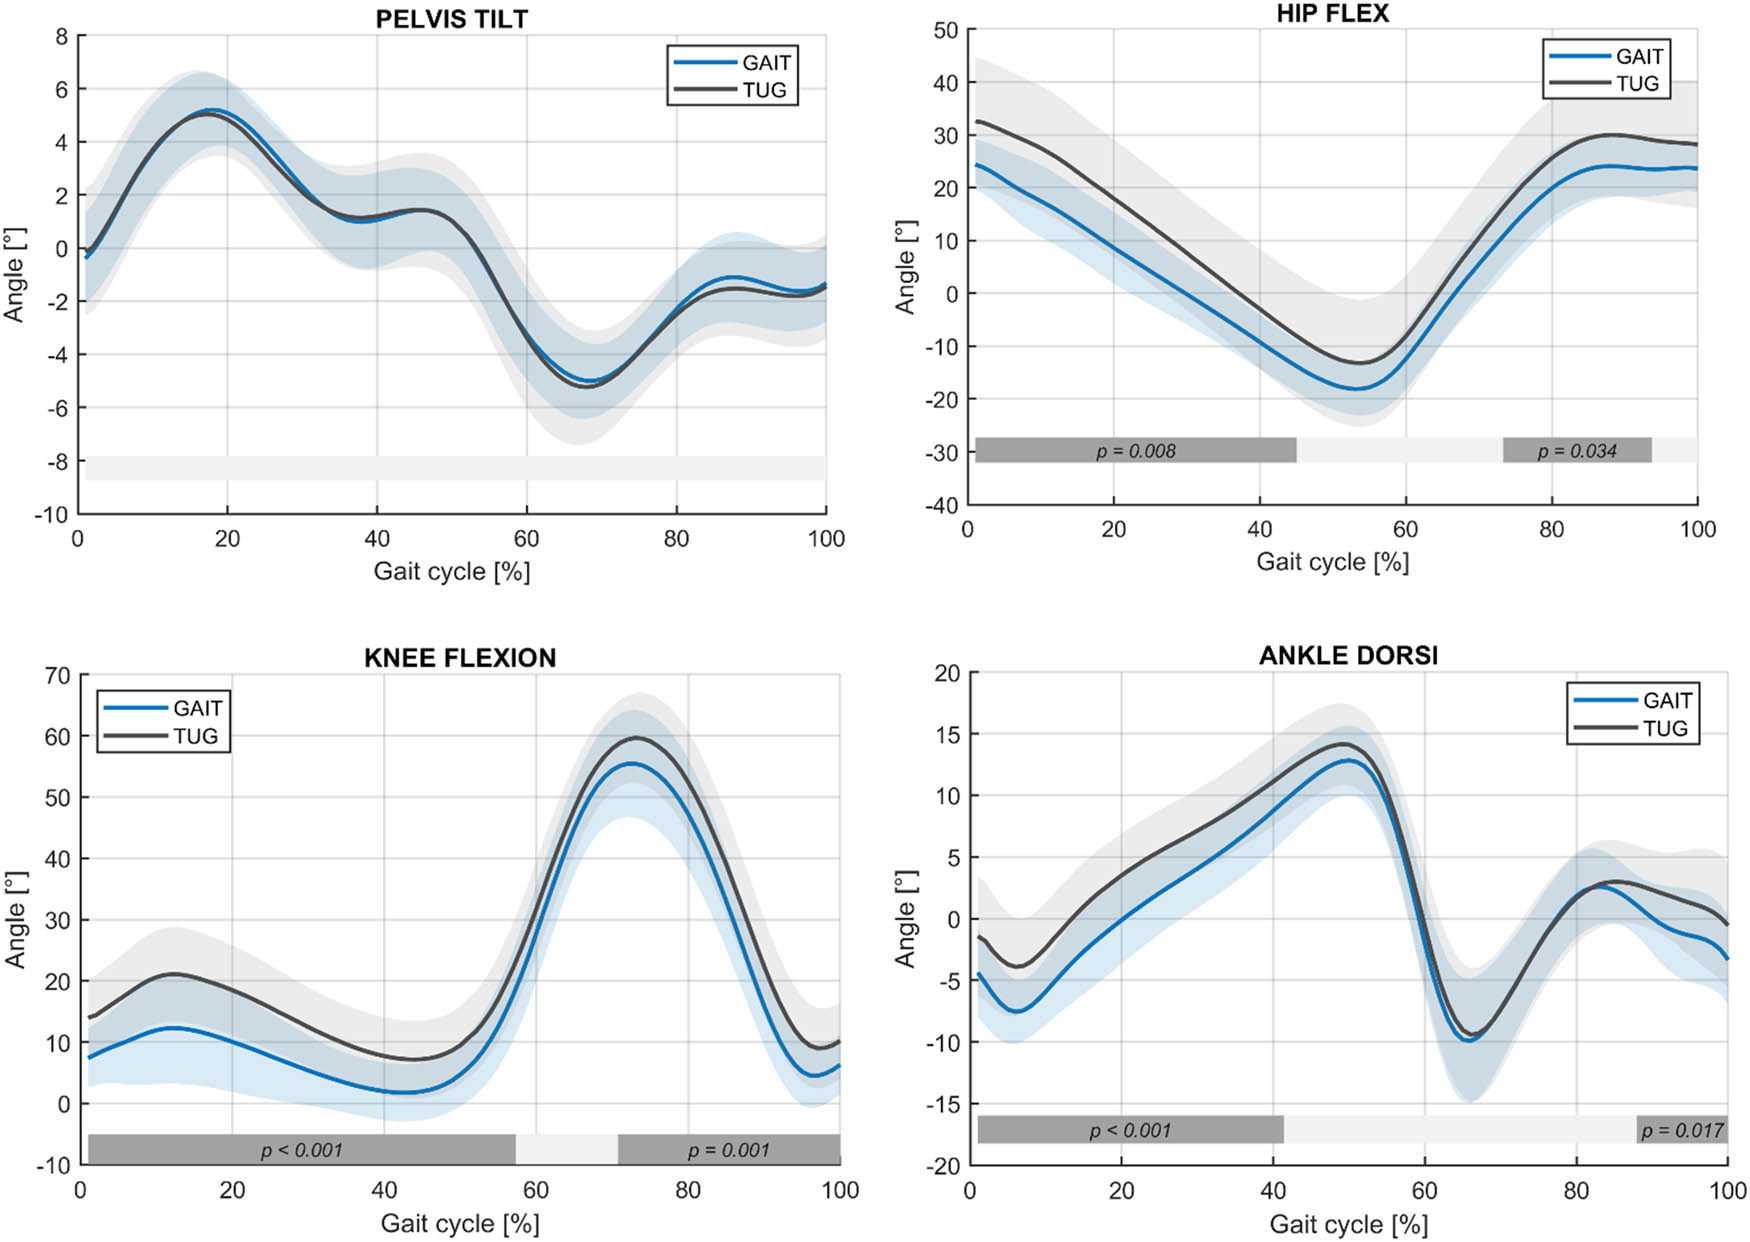
Figure 4
Mean kinematic waveforms of lower-limb joint flexion and pelvic tilt in the sagittal plane for the walk cycle during the TUG test and the walk test. The rectangular shaded area at the bottom of the plot represents the result of the test for SPM statistical differences.
In addition, Table 3 presents the minimum and maximum values, as well as the range of motion (ROM) for the analyzed joints. No substantial differences were observed for pelvic tilt or knee flexion, with motion range values in both tasks being 54° for knee flexion and 11° for pelvic tilt. For ankle dorsiflexion, the range differed by 0.85°. The largest difference, amounting to 2.81°, was observed for hip joint flexion.
Table 3
ROM during walk recorded in the walk test and the TUG test
| Joint | Test | Min | Max | ROM |
|---|---|---|---|---|
| Pelvis tilt (°) | Walk | −5.27 ± 1.4 | 5.45 ± 1.37 | 10.72 ± 2.75 |
| TUG | −5.65 ± 2.16 | 5.43 ± 1.62 | 11.08 ± 3.64 | |
| Hip flexion (°) | Walk | −18.41 ± 5.19 | 25.65 ± 4.85 | 44.06 ± 2.77 |
| TUG | −13.56 ± 12.1 | 33.31 ± 11.51 | 46.87 ± 7.52 | |
| Knee flexion (°) | Walk | 1.12 ± 4.35 | 55.63 ± 8.74 | 54.51 ± 7.42 |
| TUG | 5.75 ± 6.09 | 59.99 ± 7.32 | 54.24 ± 5.74 | |
| Ankle dorsiflexion (°) | Walk | −10.65 ± 4.59 | 13.04 ± 2.88 | 23.69 ± 4.52 |
| TUG | −10.13 ± 4.9 | 14.42 ± 3.33 | 24.54 ± 4.25 |
4. Discussion
The present study aimed to evaluate the extent to which spatiotemporal and kinematic parameters obtained during the waling phase of the iTUG test correspond to those observed during walking, in order to determine whether this phase provides clinically relevant information on natural gait performance and serve as a complementary assessment tool for functional evaluation. In this study, differences in spatiotemporal and kinematic walk parameters were evaluated during self-selected walking and during the walk phase in the TUG test. The results demonstrated significant differences in walk velocity (Δ = 0.15 m/s, p < 0.05) as well as in lower-limb kinematics, with mean differences in knee and hip joints flexion range of 0.3°–2.6°, respectively. These findings may suggest that the walk phase in the TUG test is not fully equivalent to self-selected walking. This is also indicated by the results of the Bland–Altman plots (Figure 3). The present findings highlight the need for more advanced approaches for analyzing gait parameters in the context of their dependence on walking speed. Future studies should consider applying speed-normalization techniques or using regression analysis to separate speed-dependent components from those related to motor control.
One of the reasons cited in the literature for the observed differences in walk outcomes of the TUG test may be variability in test administration, which can consequently influence task execution speed [16]. Participants may receive different instructions when performing the TUG test, such as completing the task “as fast as possible” [17] or walking at a self-selected pace, with or without assistive devices [18,19]. These differences in task instruction have been reported to influence test outcomes, particularly total completion time. However, comparisons across studies should be interpreted with caution due to differences in participant characteristics. For example, older adults with a mean age of approximately 85 years performed the TUG in 21.06 s under “as fast as possible” conditions [17], whereas studies using self-selected speed report substantially shorter times (e.g., 11.1 ± 1.7 s in individuals <75 years and 12.3 ± 2.0 s in those >75 years [18]). These discrepancies highlight that both task instructions and population characteristics contribute to variability in TUG performance, complicating direct comparisons across studies.In this study, despite instructions to perform the iTUG test in a natural manner, participants walked faster than during self-selected walking, which may suggest the influence of psychological and task-related factors, such as awareness of time measurement or motivation to achieve better results.
Analysis of walk velocity is crucial, as it represents one of the most frequently assessed indicators of locomotor performance and functional capacity of the motor system [20,21]. Walk velocity reflects both motor performance and overall condition, and its reduction may indicate the effects of injury, conditions such as sarcopenia [22], or disorders of the nervous system [23]. Moreover, the literature indicates correlations with fall risks [24] and lifespan [4,25]. In the present study, mean walk velocity was 1.17 ± 0.18 m/s during self-selected walking and 1.32 ± 0.25 m/s during the TUG test, corresponding to a difference of 0.15 m/s (approximately 14%, p < 0.05). Despite instructions to perform the test in a natural manner, participants walked faster during the iTUG test. This suggests the influence of task-related and motivational factors, such as awareness of time measurement. This phenomenon is consistent with the observations of Walz et al. [26], who reported an increase in walk velocity from 1.01 m/s during the iTUG tests performed at a preferred speed to 1.49 m/s in the fast variant (fast TUG). The obtained results underscore the importance of standardizing research procedures and providing clear instructions to participants, as subtle differences in task instructions may influence walk velocity.
Accounting for the dependence of spatiotemporal parameters on walk velocity enables differentiation of locomotor regulation mechanisms in the iTUG test and self-selected walking. The present study revealed that during self-selected walking, parameters such as cadence and stride time were characterized by a strong and predictable dependence on velocity. In contrast, this relationship was markedly weaker during the iTUG test, indicating that walk pace regulation is more strongly influenced by task-specific demands, such as movement initiation, turning, and stopping, rather than solely by walk velocity.
The increase in walk velocity during the iTUG test was automatically associated with changes in cadence, defined as the number of steps performed per unit time [27], which reflects walk rhythm and dynamics. In the present study, a significant increase in cadence was observed during the iTUG test compared with self-selected walking. However, considering the increase in cadence compared to the observed increase in velocity, it can be inferred that gait velocity was also influenced by an increase in step length, which constitutes a primary biomechanical explanation for the observed differences. The observed increase in gait velocity during the iTUG test is consistent with previous findings indicating that performance in TUG-based assessments may be influenced by task-related factors, such as instruction, time pressure, and test context, rather than reflecting walking conditions [28]. Similar tendencies have also been reported in studies employing instrumented TUG protocols, although these works were not specifically focused on detailed gait comparison [26,28,29].
This confirms that, despite its simplicity and repeatability, the TUG test introduces task- and time-related elements that may influence the locomotor pattern.
Another parameter identified in walk analysis is stride time, defined as the duration of a full walk cycle for a single limb [30]. This parameter reflects the rhythmicity and smoothness of the walk pattern, and maintaining its stability and regularity is important in the context of maintaining balance. In contrast, increased variability may indicate impaired motor control. Analysis of this parameter in the present study revealed significant differences between the iTUG test and self-selected walking (p < 0.05), with a mean difference of approximately 50 ms, suggesting that walk acceleration also affects rhythm. For comparison, Agathos et al. [31] reported the obtainment of value p = 0.0501, which is at the threshold of statistical significance, despite the fact that a stride time difference between the walk phase of the iTUG test and natural walking amounted to as much as 185 ms. This may indicate that stride time does not fully reflect the walk pattern observed during self-selected walking. Differences between the tests may instead result from different task execution conditions.
Analysis of the percentage contribution of walk phases, which can also be performed using IMU sensors in addition to other systems such as force plates or pressure-based devices, allows assessment of the duration of the stance and swing phases relative to the entire walk [32]. Monitoring phase percentage distribution is important because stability of the proportions between phases reflects appropriate motor coordination and balance, whereas disturbances, such as prolonged stance phase, may indicate stability-related problems. Alterations in walk phase contributions may indicate neuromuscular system problems [33] or compensatory adaptations following injury or disease [34]. In the present study, no statistically significant changes were observed in the percentage distribution of walk between the iTUG test and self-selected walking, suggesting that despite increased walk velocity and changes in cadence and stride time, the overall structure of the walk cycle remains preserved. This may indicate that temporal organization of the walk cycle is relatively robust across tasks, even when absolute spatiotemporal parameters differ.
Kinematic analysis using SPM enabled evaluation of differences in kinematic waveforms across the walk cycle. Statistically significant differences were identified for flexion and extension movements of the hip, knee, and ankle joints, whereas the range of pelvic tilt remained unchanged. Importantly, these kinematic differences can be largely explained by increased walk velocity during the iTUG test, rather than by the adoption of fundamentally different movement strategies. The ranges of motion observed during the TUG test can be compared with those reported for a control group discussed in article by Katakoka et al. [35], in which reported movement range values in healthy individuals were 46° for the hip joint, approximately 59° for the knee joint, and 30° for the ankle joint. In the present study, the values were comparable for the hip joint, whereas differences of 4° and 5° were observed for the knee and ankle joints, respectively. These differences may be attributable to testing instructions, as participants in the study by Kataoka et al. [35] walked at maximum speed. These results underscore that changes in lower-limb kinematics during the iTUG test are a consequence of increased velocity and altered movement strategy, whereas pelvic control remains unchanged.
The TUG test is a simple, fast, and widely used method for assessing functional health status in older adults. It enables evaluation of mobility, balance, and fall risk. The use of the Noraxon system, employing three inertial sensors (IMUs), enables quantitative analysis of the spatiotemporal parameters of individual test stages as well as precise measurement of their durations.Additional placement of sensors on the lower limbs allows acquisition of joint kinematic data that are not available in the standard version of the test.
The results demonstrated statistically significant differences between walk parameters observed during the TUG test and self-selected walking. However, the purpose of this comparison is not to demonstrate equivalence, but to identify which parameters remain consistent across conditions and may therefore have practical value in functional assessment. However, this does not imply that walk analysis in the TUG test is not useful, on the contrary, incorporating spatiotemporal and kinematic parameters into the assessment may provide valuable information on walk characteristics and compensatory strategies employed by older adults.
Therefore, there is a need to develop normative values for walk parameters in the iTUG test, which could serve as reference points for functional diagnostics and monitoring changes in patient mobility. Additionally, recording the TUG test using a larger number of sensors (e.g., 16) offers the potential for comprehensive monitoring of rehabilitation progress and evaluation of therapeutic intervention effectiveness, which may substantially enhance functional assessment in clinical practice.
The use of inertial sensors (IMUs) in TUG test analysis may be particularly valuable in the rehabilitation process. Quantitative, time-based assessment of individual walk parameters enables precise monitoring of changes – both improvements and potential lack of progress – thereby allowing accurate tailoring of therapeutic programs to individual patient needs. Continuous recording of data from IMU sensors also enables early detection of movement abnormalities and real-time evaluation of the effectiveness of implemented therapeutic modifications. As a result, this technology may become an important component of modern, personalized motor rehabilitation, supporting both clinicians and patients in achieving optimal functional performance.
4.1. Limitations to this work and directions for further research
When interpreting differences between the recorded spatiotemporal parameters (cadence, stride time, and walk velocity), it should be taken into account that the walk phase of the TUG test is performed over a short distance of 3 m. Such a limited walking distance may prevent full stabilization of the locomotor pattern and walk rhythm, as participants may not reach a velocity comparable to that of self-selected walking. An additional confounding factor is the presence of direction changes and turning movements, which alter the natural characteristics of walk and may lead to underestimation or overestimation of selected biomechanical parameters. For these reasons, the obtained results should be interpreted with caution, in the context of the specific characteristics of a functional test rather than a typical laboratory-based walk analysis.Other limitation of the present study is the lack of full normalization of gait parameters with respect to walking speed. Therefore, future analyses should consider implementing speed-matched comparisons or appropriate normalization approaches. This would allow for a more accurate interpretation of biomechanical differences and reduce the confounding effect of walking speed.
Future studies should consider the use of an extended walking distance in the iTUG test, for example up to 6 m, which could allow stabilization of walk rhythm and the acquisition of parameters more closely resembling those observed during natural gait analysis. However, such a modification would require the development of new reference values and interpretative criteria specifically tailored to IMU-based measurements, as no widely accepted normative data for iTUG-derived gait parameters are currently available. In subsequent stages of research, it would also be worthwhile to include a larger study group, greater diversity in participants’ functional capacity, and comparison of results with measurements obtained using high-resolution laboratory-based systems. Such an approach would allow verification of the validity and repeatability of the iTUG test as a tool for assessing walk parameters in the older adult population.
5. Conclusion
The results indicate limited agreement between the parameters obtained from the iTUG test and walking, particularly with regard to walking speed, cadence and selected variables related to gait phases, as evidenced by systematic deviations and wide confidence intervals.Unlike self-selected walking, the TUG test includes phases of acceleration, stopping, and direction changes, which may influence walk rhythm. Additionally, the way participants are instructed may introduce an element of time pressure, which can lead to increased walk velocity. For this reason, the TUG test should be regarded as a complex task that integrates several activities of daily living, and selected spatiotemporal and kinematic parameters obtained during the iTUG test may provide complementary information about functional mobility rather than directly reflecting natural walk patterns.
Funding information
The Article Processing Charge was co-financed under the European Funds for Silesia 2021 – 2027 Programco-financed by the Just Transition Fund – project entitled “Development of the Silesian biomedical engineering potential in the face of the challenges of the digital and green economy (BioMeDiG).” (project number: FESL.10.25-IZ.01-07G5/23). This research and the Article Processing Charge were supported by the Department of Biomechatronics, Faculty of Biomedical Engineering, Silesian University of Technology, Poland, project: “The use of inertial sensors for an objective assessment of mobility in the Up and Go test.” (project number: 07/030/BKM26/2086).
Author contributions
Piotr Szaflik: Preparation of the research program, execution of the research, statistical analysis, interpretation of data, and preparation of the manuscript. Katarzyna Nowakowska-Lipiec: Preparation of the research program, execution of research, statistical analysis, interpretation of data, and preparation of the manuscript. Hanna Zadoń: Preparation of the research program, execution of research, statistical analysis, and preparation of the manuscript. Robert Michnik: Preparation of the research program and preparation of the manuscript.
Conflict of interest statement
Authors state no conflict of interest.
Ethics approval
The research procedure was approved by the ethical committee of the Silesian University of Technology (Resolution No.10/2025, approval date: 28 November 2025).
Data availability statement
The datasets generated and/or analyzed as part of this study are not publicly available. They may be obtained from the corresponding author upon reasonable request.