
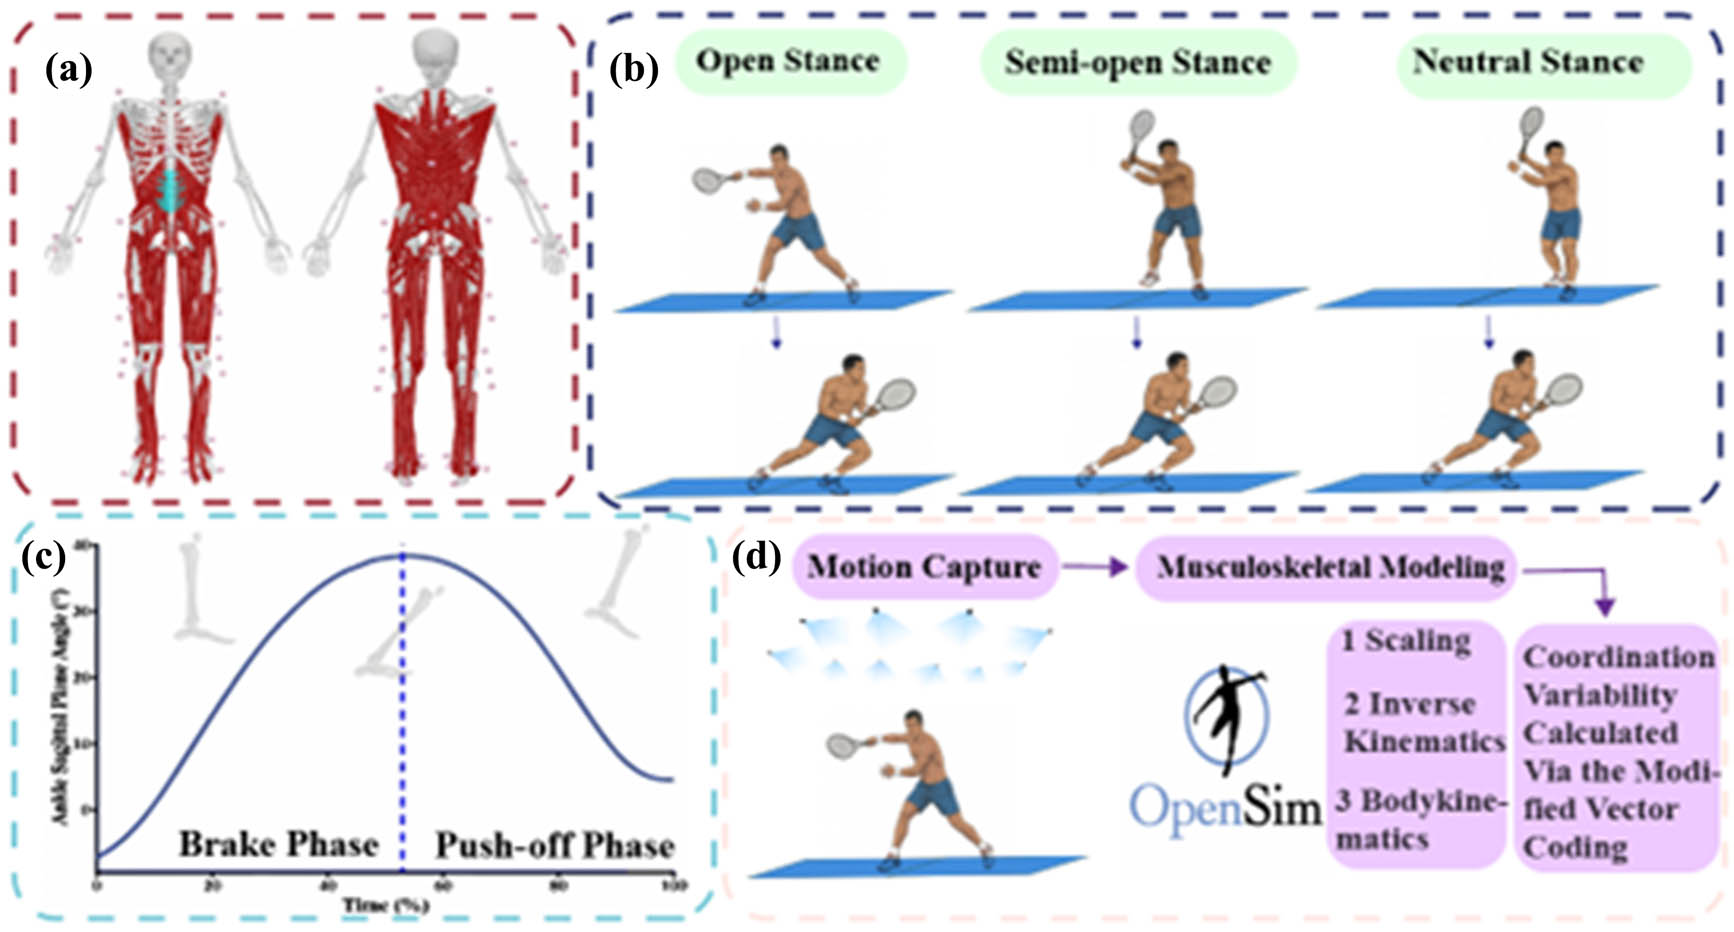
Figure 1
Data acquisition process and processing: (a) reflective marker placement locations; (b) schematic of recovery movements following three different hitting stances; (c) movement phases divided based on the peak ankle sagittal plane angle; (d) motion capture, OpenSim inverse kinematics calculation, and CV calculation.
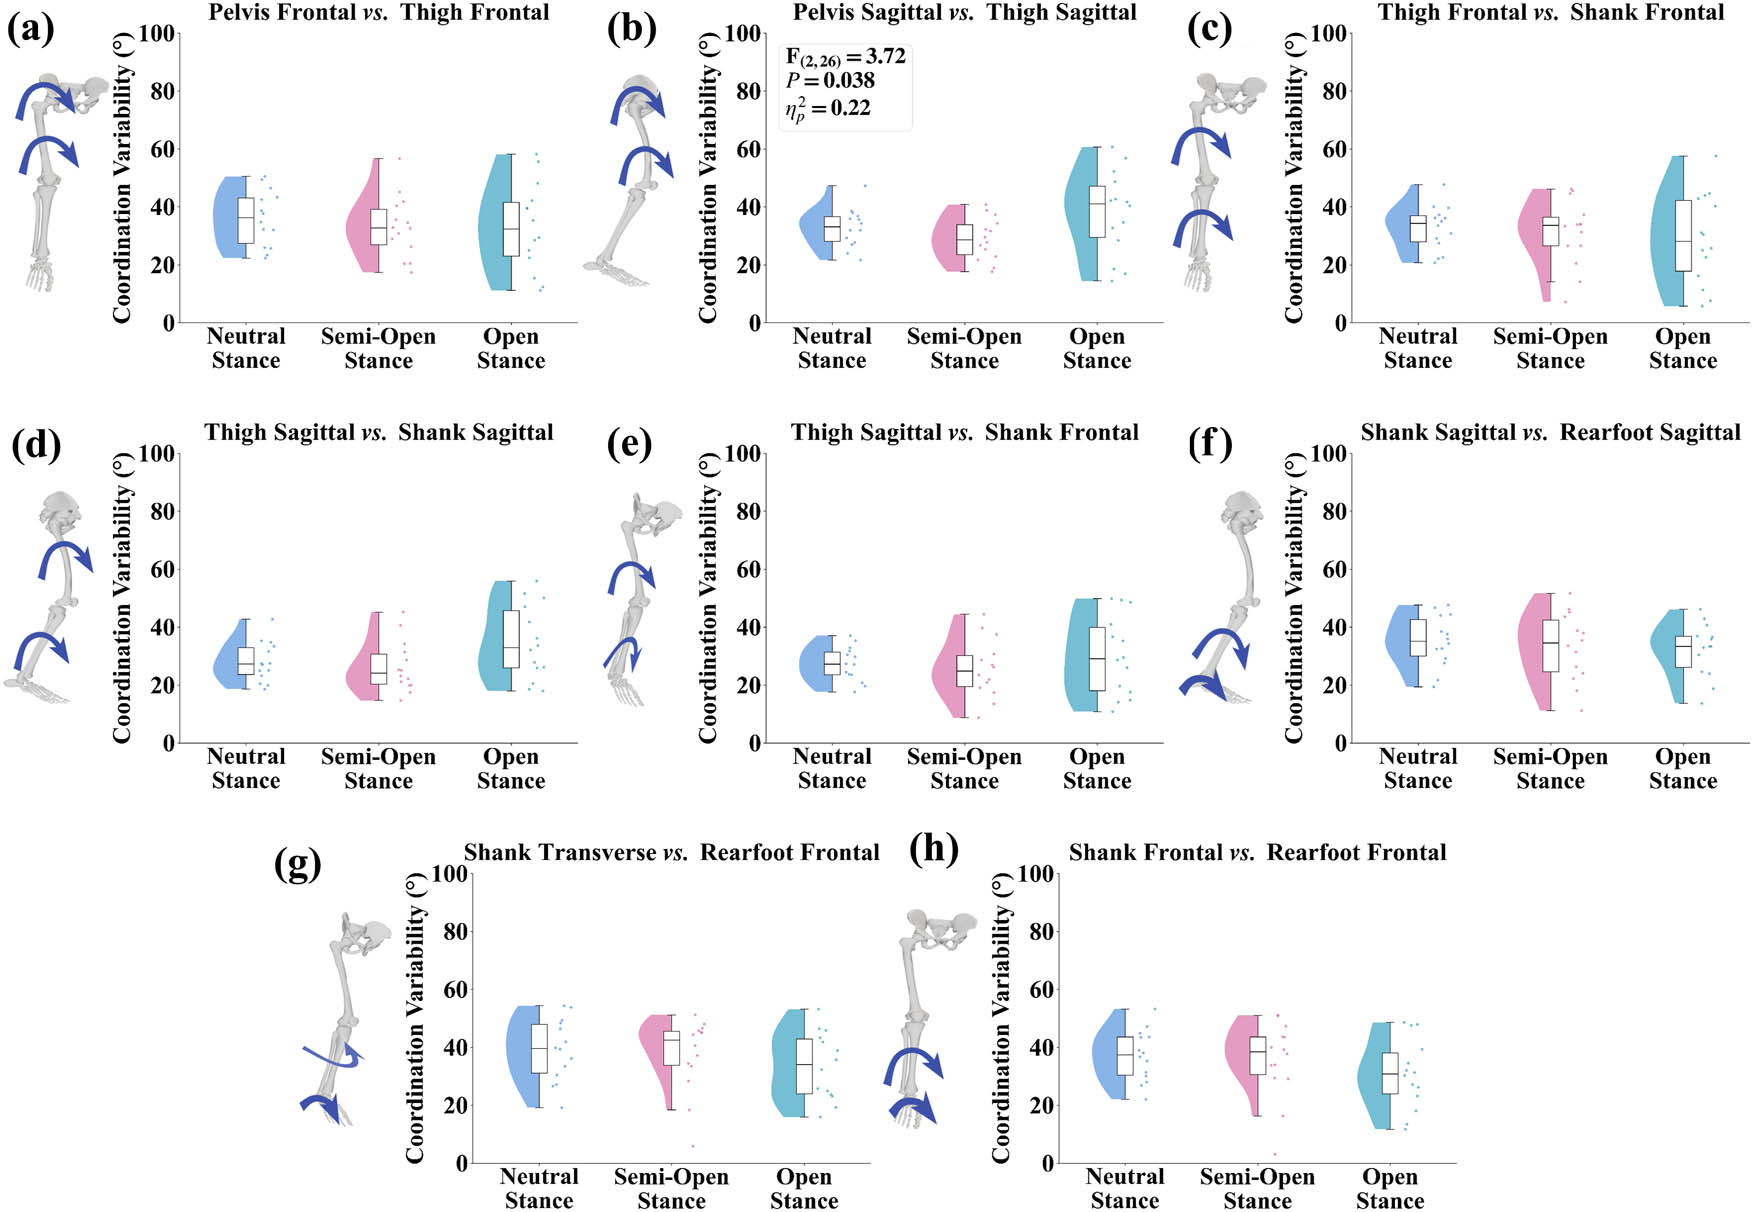
Figure 2
CV data of the segments of interest during the brake phase of the post-stroke recovery movement across the three stances. (a) Pelvis frontal vs thigh frontal, (b) pelvis sagittal vs thigh sagittal, (c) thigh frontal vs shank frontal, (d) thigh sagittal vs shank sagittal, (e) thigh sagittal vs shank frontal, (f) shank sagittal vs rearfoot sagittal, (g) shank transverse vs rearfoot frontal, and (h) shank frontal vs rearfoot frontal.
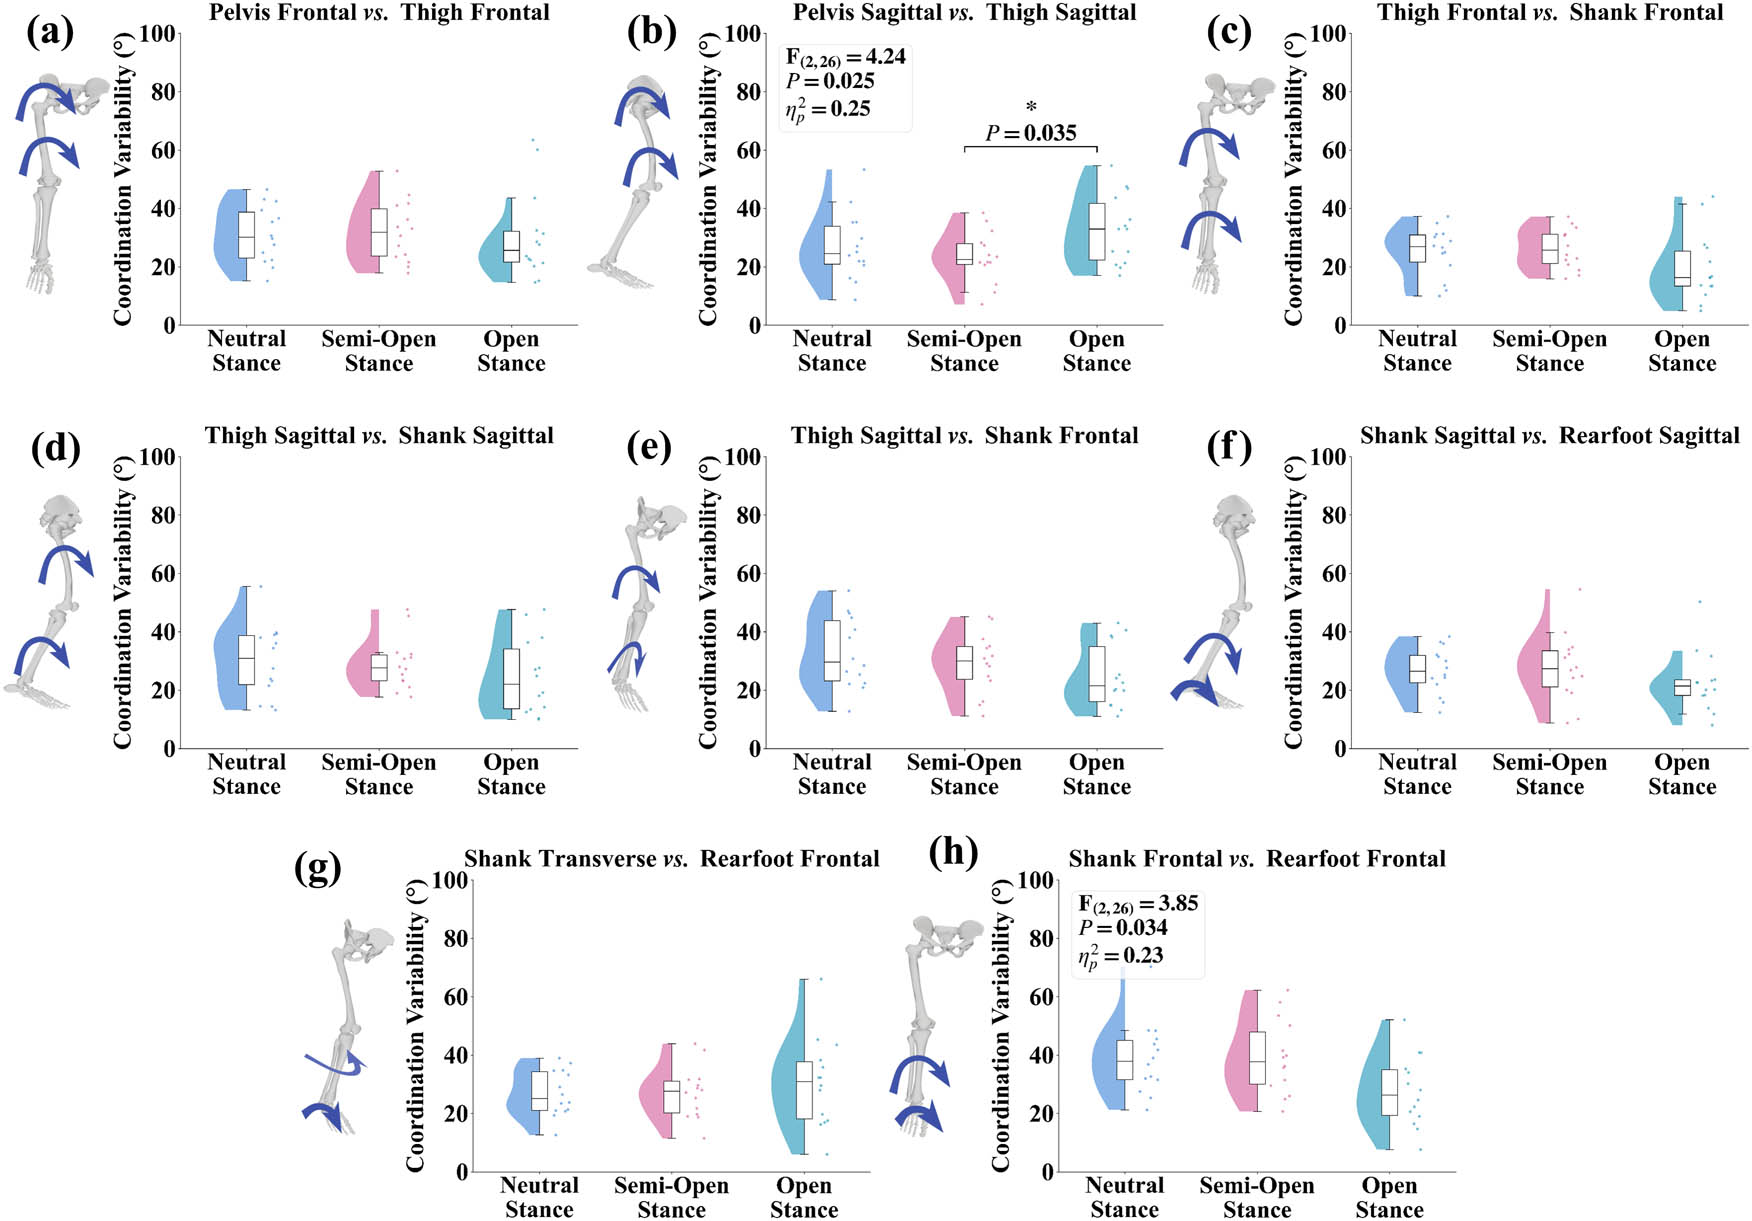
Figure 3
CV data of the segments of interest during the push-off phase of the post-stroke recovery movement across the three stances. (a) Pelvis frontal vs thigh frontal, (b) pelvis sagittal vs thigh sagittal, (c) thigh frontal vs shank frontal, (d) thigh sagittal vs shank sagittal, (e) thigh sagittal vs shank frontal, (f) shank sagittal vs rearfoot sagittal, (g) shank transverse vs rearfoot frontal, and (h) shank frontal vs rearfoot frontal.
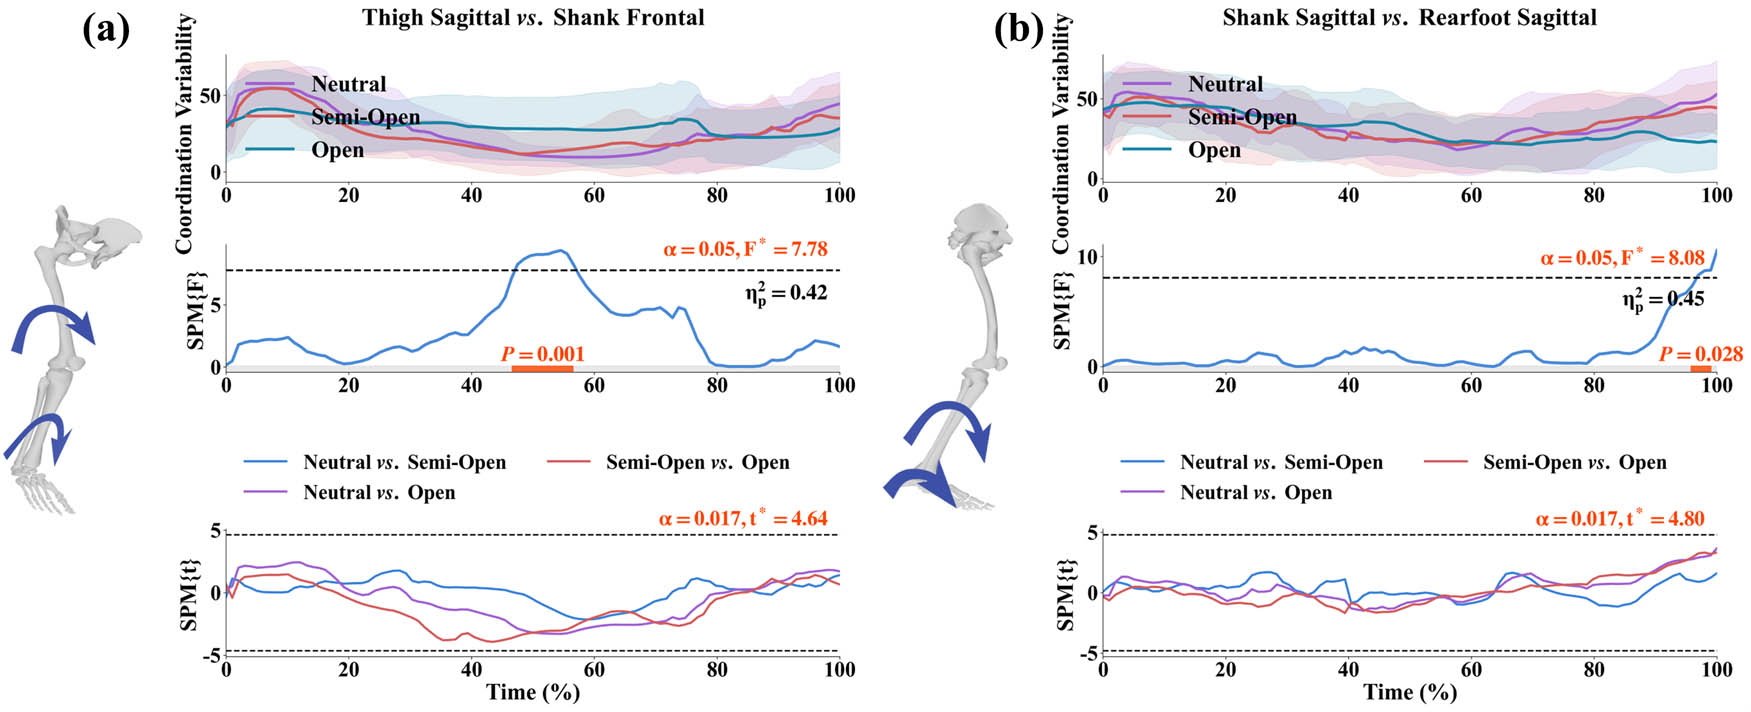
Figure 4
CV time series results during the brake phase of the recovery movement across different stances. (a) Thigh sagittal vs shank frontal and (b) shank sagittal vs rearfoot sagittal. CV (°): mean value ± standard deviation; SPM{F}: main effect results of SPM1d for CV, with the solid blue line representing the statistical parametric mapping {F} statistic and the dashed black line indicating the significance threshold; SPM{t}: post-hoc t-test results, with the solid blue, purple, and red lines representing the statistical parametric mapping {t} statistic, and the dashed black lines indicating the significance thresholds and directions. SPM: statistical parametric mapping.
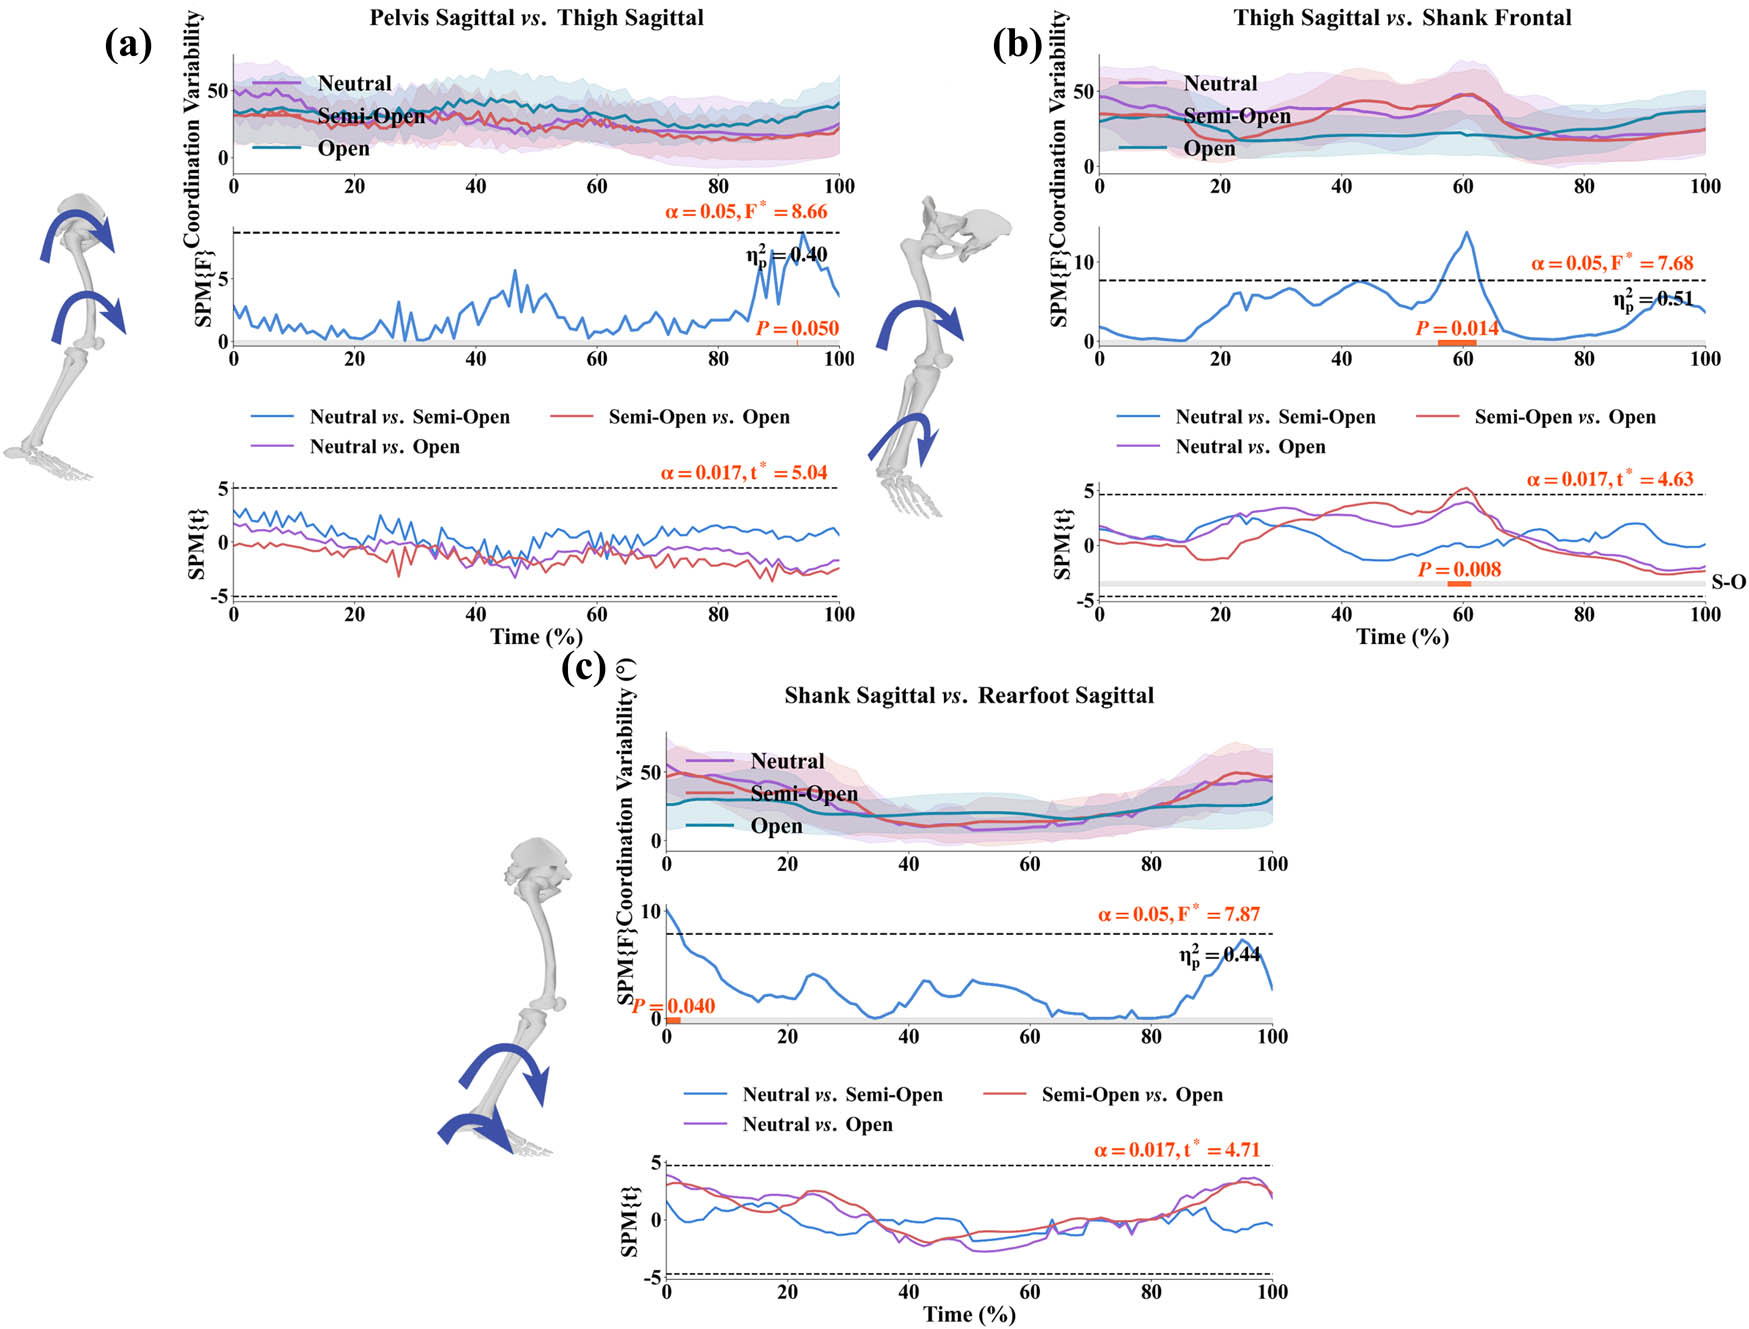
Figure 5
CV time series results during the push-off phase of the recovery movement across different stances. (a) Pelvis sagittal vs thigh sagittal; (b) thigh sagittal vs shank frontal; and (c) shank sagittal vs rearfoot sagittal. CV (°): mean value ± standard deviation; SPM{F}: main effect results of SPM1d for CV, with the solid blue line representing the statistical parametric mapping {F} statistic and the dashed black line indicating the significance threshold; SPM{t}: post-hoc t-test results, with the solid blue, purple, and red lines representing the statistical parametric mapping {t} statistic, and the dashed black lines indicating the significance thresholds and directions. S–O: semi-open vs open. SPM: statistical parametric mapping.