
Table 1
Dataset characteristics and specifications
| Property | UCI lower limb dataset [19] | Vastus medialis dataset [20] | K2MUSE dataset [21] | Above-knee STS dataset [22] |
|---|---|---|---|---|
| Subjects | 22 males (11 normal and 11 (knee abnormalities)) | 22 healthy (11 males and 11 females) | 30 healthy (20 males, 10 females) | 9 unilateral above-knee (transfemoral) amputees (K3-level community ambulators) |
| EMG electrodes | 4 (RF, BF, VM, ST) | 1 (VM) | 13 (TA, MG, LG, SOL, RF, VL, VM, BF, SEM) | 4 surface EMG sensors (Delsys Trigno Avanti) placed on the intact-side lower limb (non-prosthesis side) |
| Sampling frequency | 1 kHz | 1 kHz | 1 kHz | 2 kHz |
| Recording duration | 5 repetitions | 5 s, 3 repetitions | 40 s, 5 repetitions | 8–10 repetitions |
| Classification target (number of classes) | Posture/activity classification: sitting, standing, walking (3 classes, original labels) | Movement type classification: sitting, standing, gait (3 classes, original labels) | Acquisition-condition classification under locomotion: ideal vs fatigue (2 classes); ideal vs shift (2 classes); ideal/fatigue/shift (3 classes, derived from dataset condition labels) | Binary task-phase classification: intact-side stand-up vs sit-down (2 classes, original labels) |
| Original pre-processing | Band pass filter | Band pass filter | Band pass filter, notch filter, rectified and segmented, time normalization, stored values per channel | Segmentation of start/stop indices using knee angle and velocity thresholds |
Note: Muscle abbreviations: RF, rectus femoris; BF, biceps femoris; VM, vastus medialis; ST, semitendinosus; TA, tibialis anterior; MG, medial gastrocnemius; LG, lateral gastrocnemius; SOL, soleus; VL, vastus lateralis; SEM, semimembranosus.

Figure 1
Standardized EMG pre-processing and feature extraction pipeline used across all datasets.
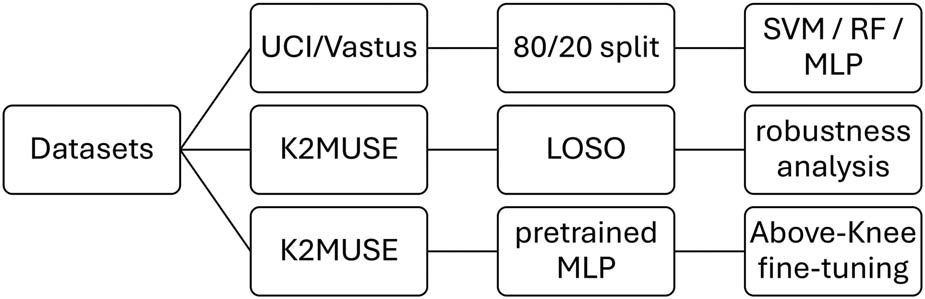
Figure 2
Evaluation protocols used for baseline classification, LOSO robustness analysis, and transfer learning across datasets.
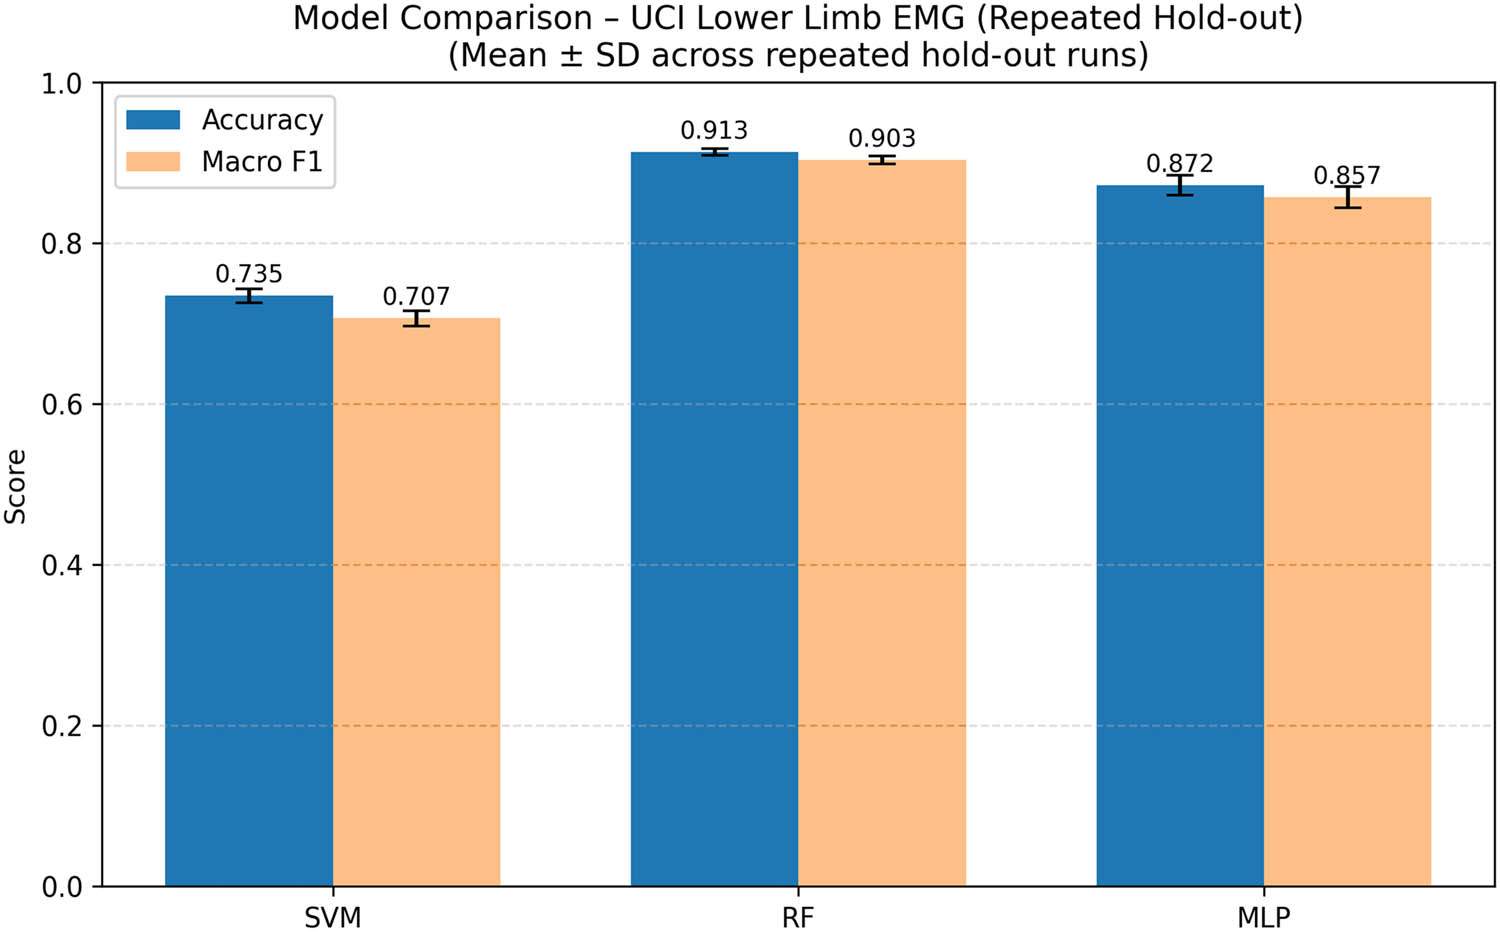
Figure 3
UCI EMG classification performance under 20 repeated stratified hold-out runs. Bars show mean accuracy and macro-F1; error bars indicate standard deviation.
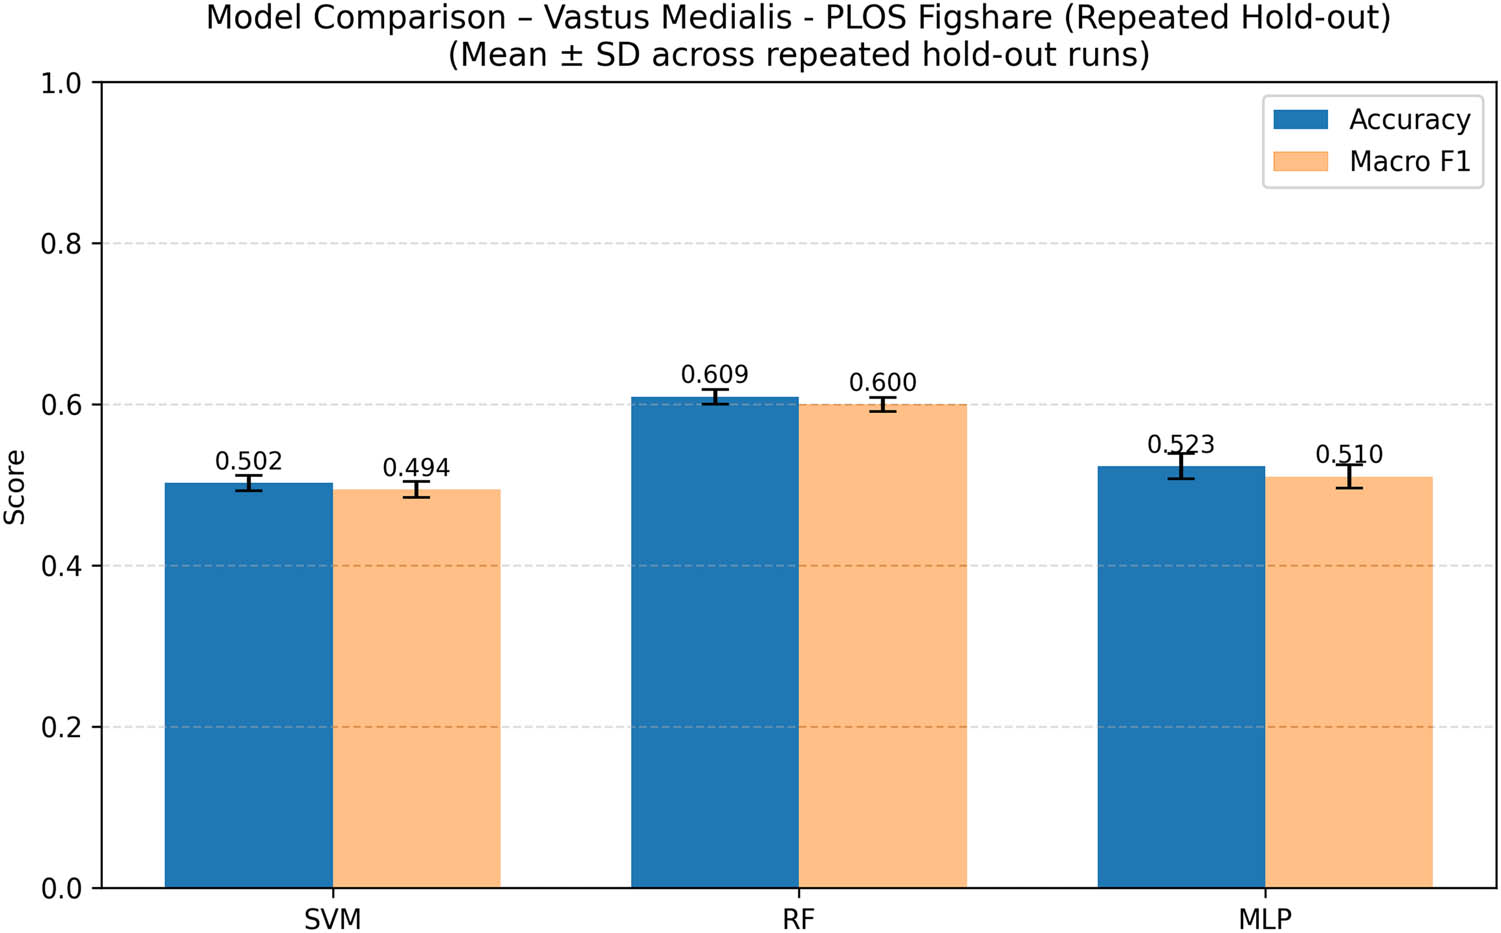
Figure 4
Vastus EMG classification performance under 20 repeated stratified hold-out runs. Bars show mean accuracy and macro-F1; error bars indicate standard deviation.
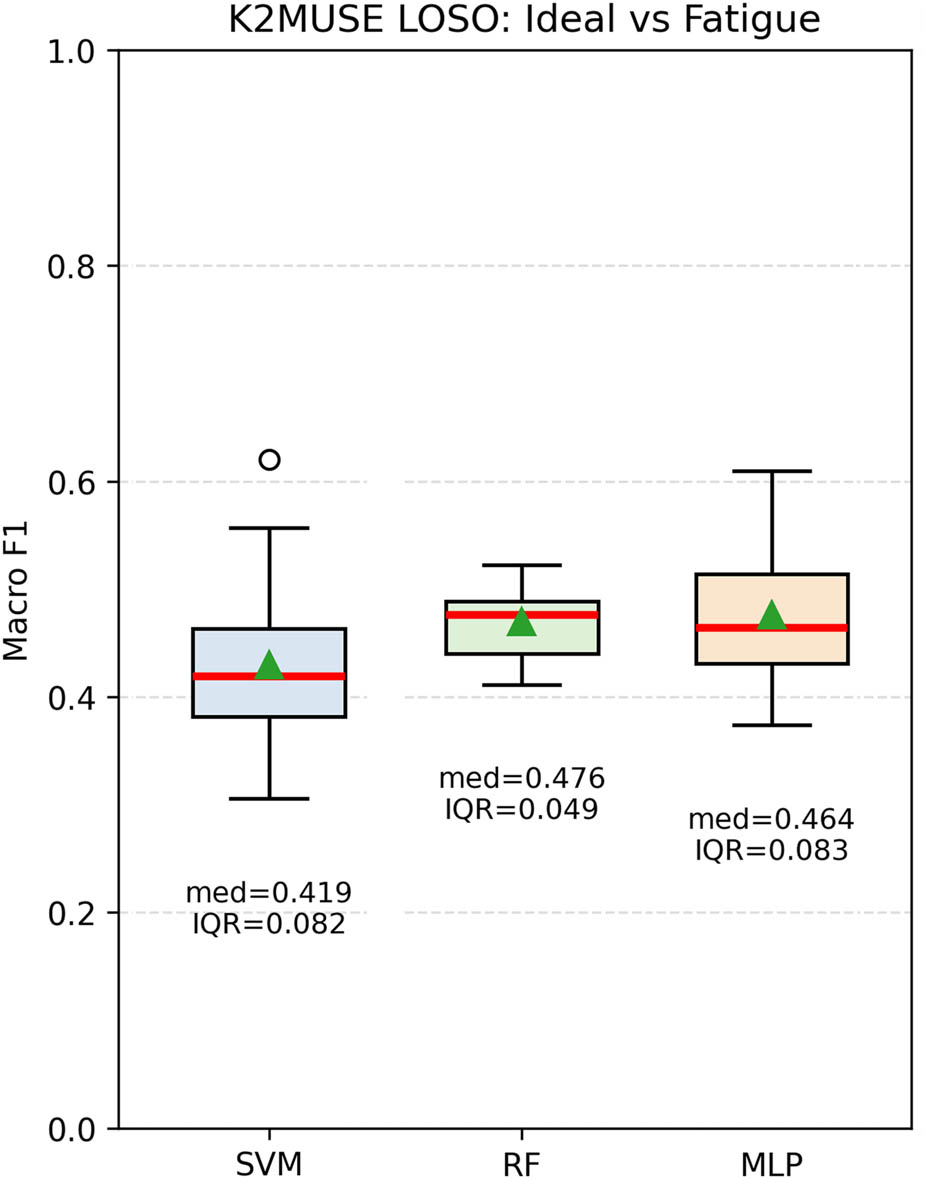
Figure 5
LOSO subject-wise macro-F1 distributions for K2MUSE ideal versus fatigue classification. Annotations indicate median and IQR.
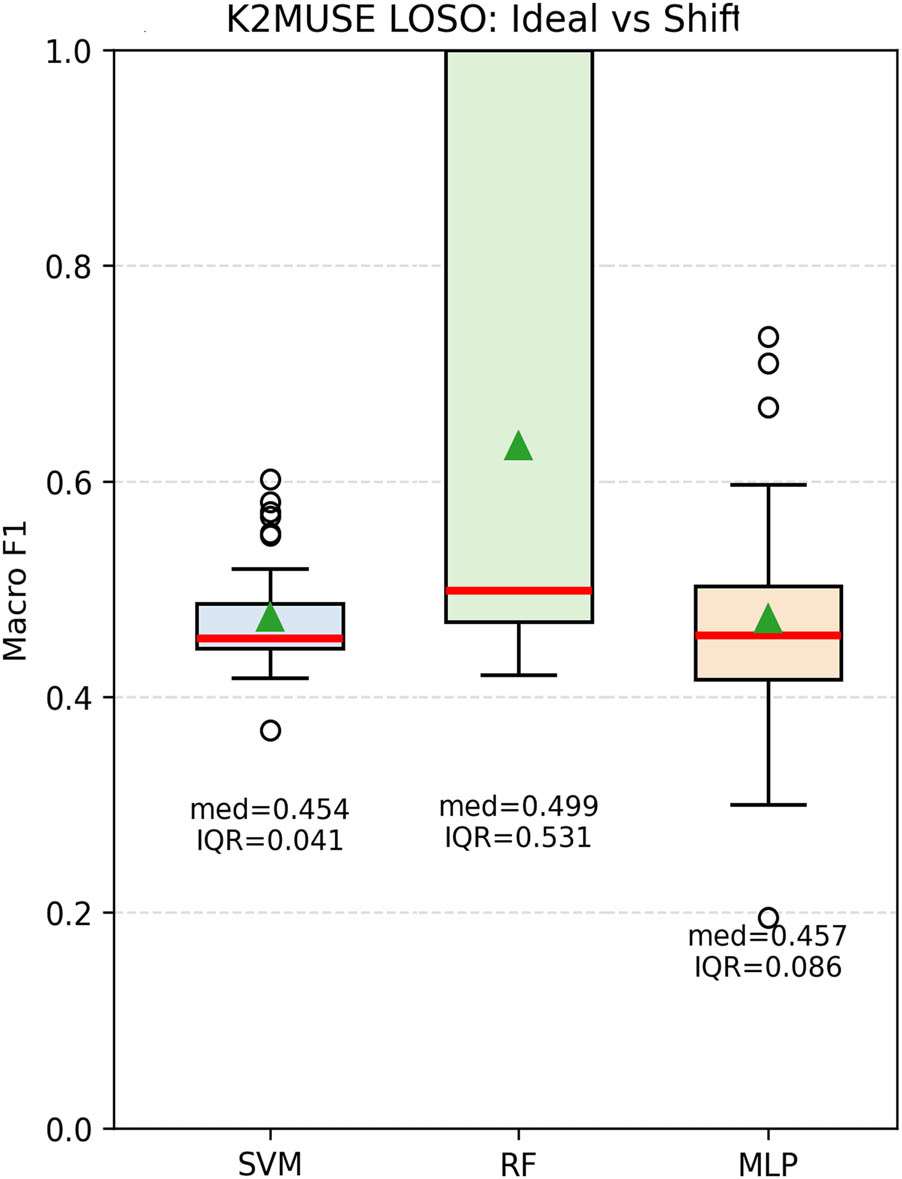
Figure 6
LOSO subject-wise macro-F1 distributions for K2MUSE Ideal versus shift classification. Annotations indicate median and IQR.
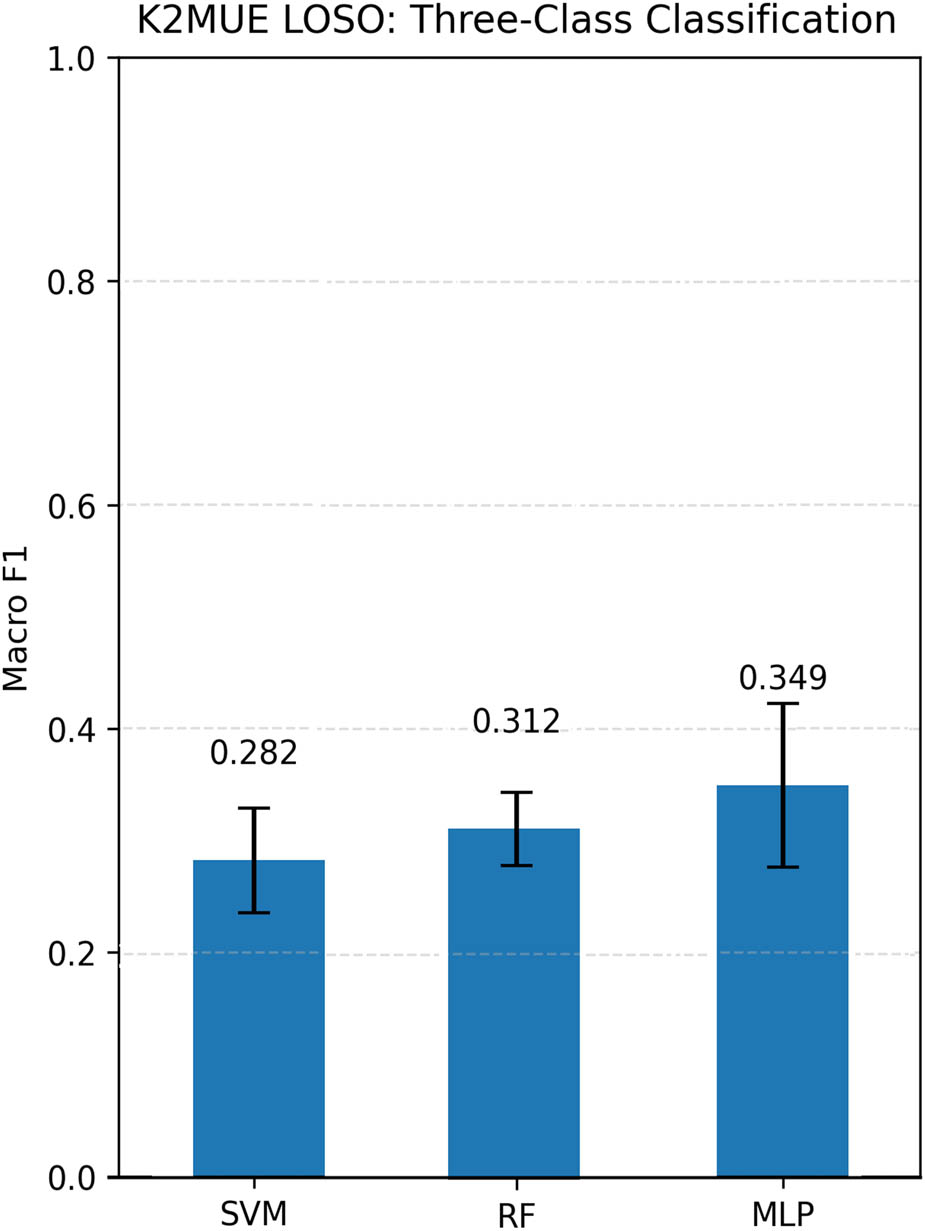
Figure 7
LOSO performance for K2MUSE three-class acquisition-condition classification (ideal, fatigue, shift). Bars show mean macro-F1; error bars indicate standard deviation.
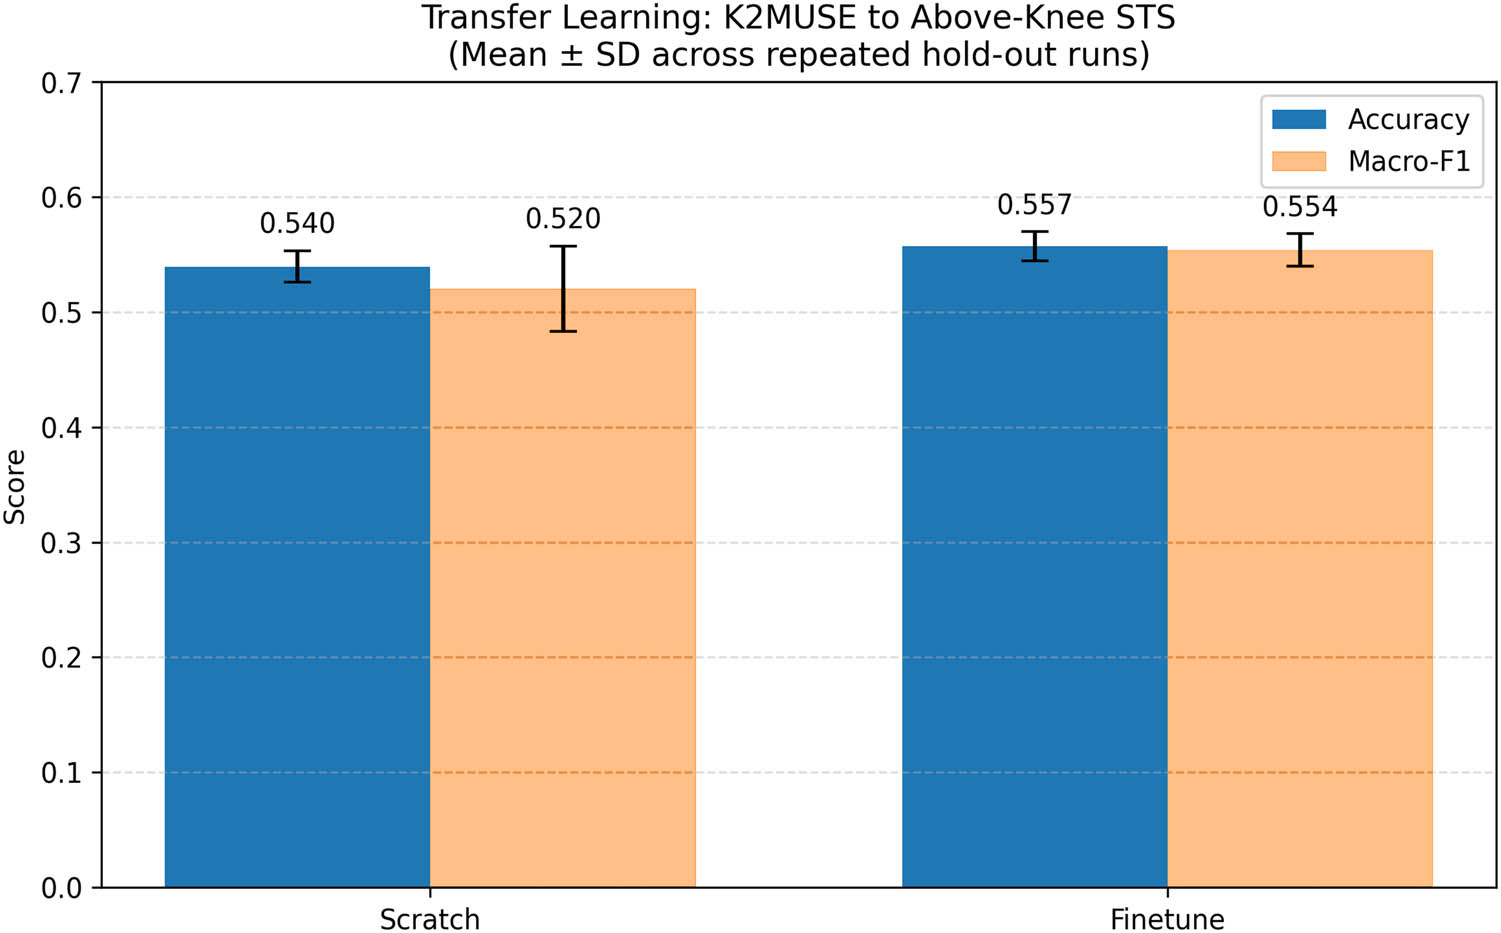
Figure 8
Transfer-learning performance on the above-knee STS dataset under 10 repeated stratified hold-out runs. Bars show mean accuracy and macro-F1; error bars indicate standard deviation.