
Table 1
Response of all interviewees to the question on what they consider to be the essential elements of case management system.
| ELEMENTS | |||||
|---|---|---|---|---|---|
| FREQUENCY | PERCENT | VALID PERCENT | CUMULATIVE PERCENT | ||
| Valid | Control and Others | 1 | .4 | .4 | .4 |
| Non | 5 | 2.0 | 2.0 | 2.4 | |
| Other (Sound Procedures and Decisions) | 6 | 2.4 | 2.4 | 4.8 | |
| Others | 16 | 6.3 | 6.3 | 11.1 | |
| Scheduling of Time and Events | 5 | 2.0 | 2.0 | 13.1 | |
| Scheduling of Time and Events, and Control | 42 | 16.7 | 16.7 | 29.8 | |
| Scrutinization and Control | 13 | 5.2 | 5.2 | 34.9 | |
| Scrutinization or Early Screening | 7 | 2.8 | 2.8 | 37.7 | |
| Scrutinization, and Scheduling of Time and Events | 28 | 11.1 | 11.1 | 48.8 | |
| Scrutinization, Scheduling of Time and Events, and Control | 97 | 38.5 | 38.5 | 87.3 | |
| Supervision or Control Over Proceedings | 32 | 12.7 | 12.7 | 100.0 | |
| Total | 252 | 100.0 | 100.0 | ||
Table 2
Frequency table for the identification of scrutinization or early screening as an element of case management system.
| SCRUTINIZATION OR EARLY SCREENING | |||||
|---|---|---|---|---|---|
| FREQUENCY | PERCENT | VALID PERCENT | CUMULATIVE PERCENT | ||
| Valid | 1 | 145 | 57.5 | 100.0 | 100.0 |
| Missing | System | 107 | 42.5 | ||
| Total | 252 | 100.0 | |||
Table 3
Frequency table for the identification of scheduling of time and events as an element of case management system.
| SCHEDULING OF TIME AND EVENTS | |||||
|---|---|---|---|---|---|
| FREQUENCY | PERCENT | VALID PERCENT | CUMULATIVE PERCENT | ||
| Valid | 1 | 172 | 68.3 | 100.0 | 100.0 |
| Missing | System | 80 | 31.7 | ||
| Total | 252 | 100.0 | |||
Table 4
Frequency table for the identification of supervision or control over proceedings as an element of case management system.
| SUPERVISION OR CONTROL OVER PROCEEDINGS | |||||
|---|---|---|---|---|---|
| FREQUENCY | PERCENT | VALID PERCENT | CUMULATIVE PERCENT | ||
| Valid | 1 | 185 | 73.4 | 100.0 | 100.0 |
| Missing | System | 67 | 26.6 | ||
| Total | 252 | 100.0 | |||
Table 5
Frequency table on whether the case management system applied in the High Court contains all the essential elements.
| ELEMENTS CONTAINED IN APPLIED CMS | |||||
|---|---|---|---|---|---|
| FREQUENCY | PERCENT | VALID PERCENT | CUMULATIVE PERCENT | ||
| Valid | Yes | 37 | 14.7 | 14.7 | 14.7 |
| Partly | 177 | 70.2 | 70.2 | 84.9 | |
| I don’t know | 6 | 2.4 | 2.4 | 87.3 | |
| No | 22 | 8.7 | 8.7 | 96.0 | |
| Confounding | 10 | 4.0 | 4.0 | 100.0 | |
| Total | 252 | 100.0 | 100.0 | ||
Table 6
Frequency table on the missing element in the case management system applied in the High Court.
| MISSING ELEMENT | |||||
|---|---|---|---|---|---|
| FREQUENCY | PERCENT | VALID PERCENT | CUMULATIVE PERCENT | ||
| Valid | Scrutinization or Early Screening | 14 | 5.6 | 5.6 | 5.6 |
| Scheduling of Time and Events | 9 | 3.6 | 3.6 | 9.1 | |
| Supervision or Control Over Proceedings | 148 | 58.7 | 58.7 | 67.9 | |
| Scheduling of Time and Events and Control | 16 | 6.3 | 6.3 | 74.2 | |
| Scrutinization and Control | 8 | 3.2 | 3.2 | 77.4 | |
| Non | 37 | 14.7 | 14.7 | 92.1 | |
| Confounding | 12 | 4.8 | 4.8 | 96.8 | |
| I don’t Know | 8 | 3.2 | 3.2 | 100.0 | |
| Total | 252 | 100.0 | 100.0 | ||
Table 7
Frequency table on identification of scrutinization or early screening as the missing element.
| SCRUTINIZATION OR EARLY SCREENING | |||||
|---|---|---|---|---|---|
| FREQUENCY | PERCENT | VALID PERCENT | CUMULATIVE PERCENT | ||
| Valid | 1 | 22 | 8.7 | 100.0 | 100.0 |
| Missing | System | 230 | 91.3 | ||
| Total | 252 | 100.0 | |||
Table 8
Frequency table on identification of scheduling of time and events as the missing element.
| SCHEDULING OF TIME AND EVENTS | |||||
|---|---|---|---|---|---|
| FREQUENCY | PERCENT | VALID PERCENT | CUMULATIVE PERCENT | ||
| Valid | 1 | 25 | 9.9 | 100.0 | 100.0 |
| Missing | System | 227 | 90.1 | ||
| Total | 252 | 100.0 | |||
Table 9
Frequency table on identification of supervision or control over proceedings as the missing element.
| SUPERVISION OR CONTROL OVER PROCEEDINGS | |||||
|---|---|---|---|---|---|
| FREQUENCY | PERCENT | VALID PERCENT | CUMULATIVE PERCENT | ||
| Valid | 1 | 172 | 68.3 | 100.0 | 100.0 |
| Missing | System | 80 | 31.7 | ||
| Total | 252 | 100.0 | |||
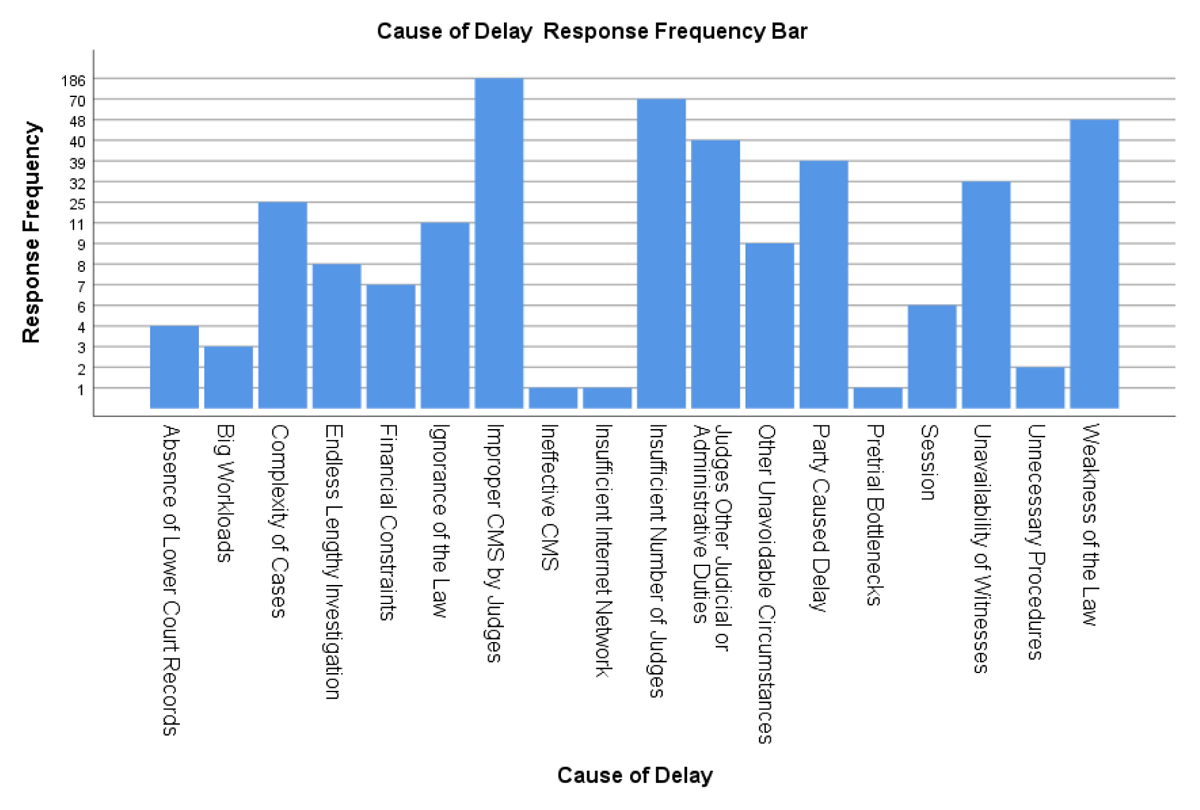
Bar Chart 1
Y/X Bar Chart on the response frequency with which each cause of delay was identified.
Table 10
Statistics on the response frequency identifying improper case management system as a cause of delay.
| IMPROPER CMS BY JUDGES | |||||
|---|---|---|---|---|---|
| FREQUENCY | PERCENT | VALID PERCENT | CUMULATIVE PERCENT | ||
| Valid | 1 | 186 | 73.8 | 100.0 | 100.0 |
| Missing | System | 66 | 26.2 | ||
| Total | 252 | 100.0 | |||
Table 11
Statistics on the response frequency identifying insufficient number of Judges as a cause of delay.
| INSUFFICIENT NUMBER OF JUDGES | |||||
|---|---|---|---|---|---|
| FREQUENCY | PERCENT | VALID PERCENT | CUMULATIVE PERCENT | ||
| Valid | 1 | 70 | 27.8 | 100.0 | 100.0 |
| Missing | System | 182 | 72.2 | ||
| Total | 252 | 100.0 | |||
Table 12
Statistics on the response frequency identifying weakness of the law as a cause of delay.
| WEAKNESS OF THE LAW | |||||
|---|---|---|---|---|---|
| FREQUENCY | PERCENT | VALID PERCENT | CUMULATIVE PERCENT | ||
| Valid | 1 | 48 | 19.0 | 100.0 | 100.0 |
| Missing | System | 204 | 81.0 | ||
| Total | 252 | 100.0 | |||