
1. Introduction
Access to justice is a fundamental right, yet case backlogs and delays slow down court systems worldwide. As delayed case resolution rises in Kenya, economic productivity, social welfare, and public trust suffer. The Kenyan judiciary has long grappled with significant case backlogs and delays. To illustrate this, the Kenya National Bureau of Statistics (KNBS, 2020) reported over 100,000 pending cases in 2020, underscoring the need for reforms to enhance judicial efficiency. Maseno (2019) highlighted procedural inefficiencies as a key driver of these delays, emphasizing the importance of targeted interventions. This study builds on these insights by employing survival analysis to quantitatively assess case resolution timelines, a novel approach for the Kenyan context. Globally, studies like Medvedeva et al. (2020) have shown the value of predictive modeling in judicial systems, providing a framework that this study adapts to Kenyan High Courts.
Lengthy case disposition timeframes impose significant costs on commercial and governmental entities, including increased legal fees, litigant uncertainty, poor resource allocation, incentives for vexatious litigation, and impaired rule of law (Bielen et al., 2017; Tsintzos & Plakandaras, 2020). Complex elements affecting legal case time have been studied internationally. Davila & Christina (2015) revealed that U.S. county court case processing times were influenced by criminal charge severity, pretrial detention length, and number of crimes. Pradhan (2018) found unique crime rates in San Francisco by place and time, using exploratory data mining. In the European Court of Human Rights, machine learning prediction models predicted case completion with 75% accuracy (Medvedeva et al., 2020). The Kenyan judiciary has little quantitative examination of case disposition time factors.
Survival analysis accounts for censored data and is useful for determining the time until an event of interest (Emmert-Streib & Dehmer, 2019; Moore (2016)). It has several legal uses. Perez & Figueroa (2007) used Kaplan-Meier estimators and Cox proportional hazards regression to estimate Argentine civil case duration. Dirks-Linhorst & Linhorst (2012) applied Cox models to U.S. mental health court data, and they identified significant predictors of recidivism timelines. In comparing models, the flexibility of semi-parametric Cox regression has frequently proven advantageous over restrictive fully parametric methods, such as Weibull and log-normal distributions (Teshnizi et al., 2017).
Judicial inefficiencies in Kenyan High Courts stem not only from procedural obstacles, but also from broader systemic challenges. Disparities in resource allocation, the complexity of legal procedures, and limited judicial expertise in some regions contribute to the rise in delays. Understanding these contextual factors enriches the quantitative analysis and aligns with global efforts to improve judicial efficiency.
This study seeks to address the knowledge gap regarding quantitative assessment of disposition timelines within Kenyan High Courts through survival analysis techniques. The analysis investigates case duration as the outcome of interest, examining both case-level and court-level predictors. The methodological approach entails utilizing exploratory data techniques to understand influential factors, the application of Cox proportional hazards regression, comparison with parametric models, and leveraging the best-fitting model to generate insights into policy and process interventions that can enhance timely access to justice. Beyond introducing advanced analytic tools to the Kenyan legal context, findings can inform evidence-based reforms to alleviate judicial backlogs, reduce unnecessary delays, and strengthen the equity and efficiency of the court system.
2. Materials and Methods
2.1 Data Sources and Analysis
The study used secondary data from 2012 to 2022, which was retrieved from Kenyan judiciary databases. The study variables included in-court factors – such as type of the case, number of appeals, and testimonial proofs – the time at which the case was filed in a High Court of law, the hearings of the case, and finally the point in time at which the case was concluded. The dependent variable is the time at which the case was disposed off. The data was analyzed using survival models such as Kaplan-Meier estimator, Cox regression, Weibull, and Exponential. To compare the performance of the survival models, the Akaike Information Criterion and the Cox-Snell Residuals were applied. The better-performing model was applied to estimate the survival time for a case to be determined in Kenyan High Courts.
2.2 Survival Models
Survival analysis, which involves the study of time-to-event occurrences (Kleinbaum & Klein, 2012), was applied in this study using models such as the Kaplan-Meier estimator, the Cox Proportional Hazards model, and parametric models including the Weibull and Exponential distributions. The choice of survival analysis is motivated by its ability to handle censored data and provide insights into time-to-event phenomena, a method successfully applied in various legal contexts. For instance, Medvedeva et al. (2020) demonstrated its utility in predicting judicial outcomes, while Maseno (2019) provided a groundwork for analyzing delays in Kenyan courts. This study builds upon these methodologies, incorporating data from KNBS (2020) to contextualize case resolution timelines within Kenya’s unique judicial environment.
Furthermore, each survival model provides unique insights into case resolution timelines. The Kaplan-Meier estimator predicts the duration cases take to resolve by plotting probabilities over time. This is useful for identifying overall trends. The Cox Proportional Hazards model isolates key predictors, such as whether a case is appealed or the type of case, helping policymakers design targeted interventions. Parametric models, such as the Weibull and Exponential distributions, are particularly effective for forecasting long-term outcomes and determining where resources should be allocated to in order to reduce delays. Including all models ensures a comprehensive understanding of both immediate and systemic factors.
2.2.1 Kaplan-Meier Estimator for the Survival Function
The Kaplan-Meier estimator was used to estimate the survival function by plotting a Kaplan-Meier curve, which is a graphical representation of the survival probability over time. It is especially helpful for comparing the likelihood of resolution across various case types. By doing this, it highlights which types are more likely to experience delays.
The Kaplan–Meier (KM) estimator of a survival function SKM (t) is given by the following equation.
The Kaplan-Meier estimator holds for all t > 0 and it depends only on two variables, ni and di which are number in risk at time ti and number of events at time ti respectively.
2.2.2 Cox Proportional Hazard
The Cox Proportional Hazard distribution model is a type of survival analysis that can be used to analyze the time taken for a case to be determined in the High Courts of Kenya. This semi-parametric model analyzes how different factors, such as case type, whether the case is an appealed one, and other variables, affect the speed of case resolution. It is useful for pinpointing specific elements in the judicial process that lead to delays, such as case complexity or the presence of appeals.
The model is based on two factors: the baseline hazard function, h0(t), which is unaffected by the predictor variables; and the exponential function, eβx which involves the predictor variables. It is assumed that the hazard ratio is constant over time, and this is referred to as the proportional hazard’s assumption. The hazard ratio is the ratio of the hazard rate for an individual with the predictor values x to the hazard rate for a reference individual with the same baseline hazard function but different predictor values. The Cox PH model is expressed as:
where h(t, x) is the hazard function at time t for an individual with predictor values xj, while h0(t) is the baseline hazard function that is unaffected by the predictor variables, and βj’sare the regression coefficients for the predictor variables xj’s. The individual’s relative hazard ratio () is the ratio of the hazard rate for an individual with the predictor values xj’s to the hazard rate for a reference person with the same baseline hazard function but different predictor values. The proportional hazards assumption holds that the hazard ratio remains constant.
2.2.3 Weibull distribution
The two-parameter Weibull distribution explains lifespan phenomena, including mechanical component failure. This predictive power is crucial for court administrators, as it helps identify which case types will require more resources to resolve in a timely manner. It can simulate Kenyan High Court time-to-event data, such as case determination time. Assuming that the Weibull distribution has the parameter θ > 0 and β > 0 and the survival function is given by,
For t > 0, the Weibull density function is given by
The hazard function can be obtained by dividing the Weibull density function by the survival function
The maximum likelihood estimation (MLE) estimates the Weibull parameters. MLE maximizes the log-likelihood function with respect to θ and β, while the Newton-Raphson or Expectation-Maximization (EM) algorithms may be used to calculate the MLE estimates θ and β.
With High Court data, researchers can estimate the Weibull parameters of the time it takes Kenyan High Courts to decide a case and anticipate the time. The model’s accuracy may be compared to other parametric survival models.
2.3.4 Exponential distribution
The exponential distribution model is a type of parametric survival model that is used to analyze the time taken for cases to be determined in Kenyan High Courts. The exponential model assumes that the “hazard” (or the probability of a case terminating within an interval of time) is constant over time. The survival function of the exponential model is the probability that a case will not terminate in time “t”. Suppose that the random variable T follows an exponential distribution with parameter θ such that θ > 0. Then, the density function of the exponential distribution with parameter θ > 0 is given by
The survival function is estimated from the exponential function as
Time is treated as a continuous variable in the above models. The Kaplan-Meier estimator and Cox Proportional Hazard Model both use continuous time as a measure, while the Weibull, Gamma Log-Logistic, Log-normal, and Exponential distributions all use continuous time equations to represent the likelihood of a particular event occurring. The parameters that are estimated in these models are also related to the continuous-time function, such as the exponential coefficient (θ) in the Exponential model or the log-normal mean (µ) and variance (σ) in the Log-normal model. Thus, all of the above models treat time as a continuous variable.
2.3 Comparison between Cox regression and Parametric Survival Models
To compare the performance of the survival models, model diagnostics and comparison were performed using the Akaike information criterion (AIC). The better performing model can be applied to estimate the survival time for a case to be decided in the Kenyan High Court in future studies.
3. Results
3.1 Exploratory Data Analysis (EDA)
3.1.1 Summary statistics
The data contained 91,405 observations on court cases in Kenya. Variables included county number, court name, filing and disposal dates, duration of the case (in years and months), case type, appeal status, and case events. Case type was a factor variable with 5 levels: anti-corruption, civil, constitutional, criminal, and family. Appeals was a binary variable indicating whether the case was appealed (1) or not (0).
The mean time taken across case types ranges from 14.23 months (Anti-Corruption) to 40.20 months (Family), with standard deviations from 16.01 months (Anti-Corruption) to 30.14 months (Family). For Appeals, cases that were appealed spanned a mean duration of 30.08 months (SD = 23.09 months) to resolve compared to 26.22 months (SD = 28.47 months) for non-appealed cases as shown in Table 1.
3.1.2 T-test for mean comparison between appealed and un-appealed cases
A t-test was conducted to compare the mean time in months for appealed versus un-appealed cases. The results of the independent sample t-test (Table 2), showed that the appealed cases lasted significantly longer on average (Mean = 30.08, SD = 3.49) compared to un-appealed cases (Mean = 26.22, SD = 4.22), t (48116) = –20.67. The results were significant at 95% (p < .001).
Table 2
T-test statistics for appealed and non-appealed cases.
| STATISTIC | VALUE |
|---|---|
| t-value | –20.67 |
| Degrees of Freedom | 48116 |
| p-value | < 2.2e-16 |
| Confidence Interval Lower | –4.22 |
| Confidence Interval Upper | –3.49 |
| Mean in Group 0 | 26.22 |
| Mean in Group 1 | 30.08 |
[i] **Alternative hypothesis: True difference in means between group 0 and group 1 is not equal to 0.
Histogram of time by case type
Figure 1 shows the histogram in months grouped by case type. The distribution of case times is right skewed across case types in the histograms, again with longer right tails, especially for Family and Civil cases.
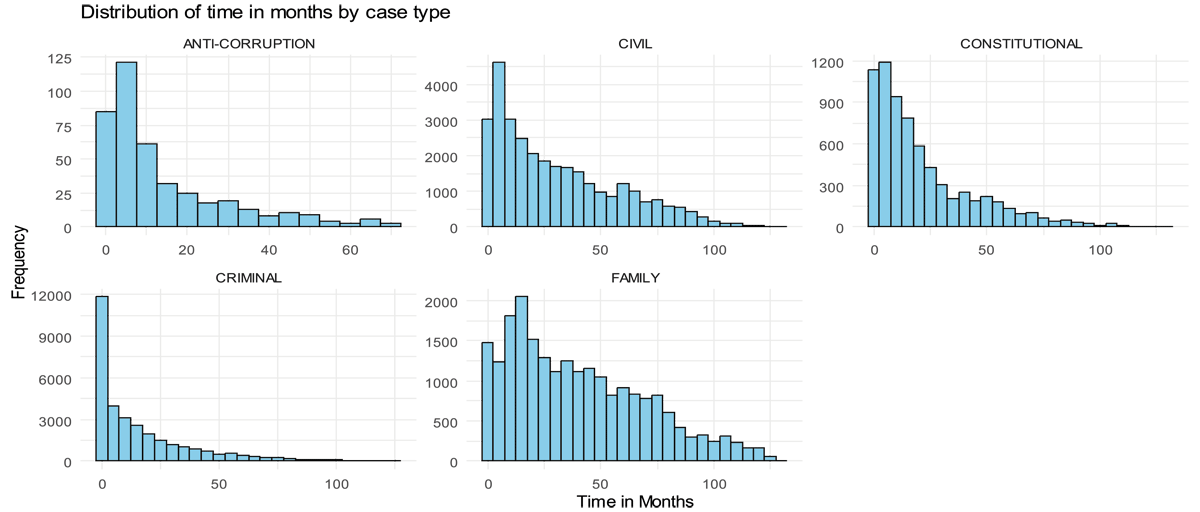
Figure 1
Distribution of time in months by case type.
Quantile of time by case type
The boxplot provides a comprehensive visualization of the distribution of case durations (in months) across the different case types – anti-corruption, civil, constitutional, criminal, and family cases. It becomes evident that there are significant disparities in the time taken to resolve cases, with family cases exhibiting the longest durations. The median duration for family cases is around 35 months, but the distribution is heavily skewed to the right, with the 75th percentile reaching around 60 months and the maximum duration extending beyond 120 months as shown in Figure 2. This indicates that while the typical family case may take around 3 years to resolve, there are numerous instances where cases stretch out for much longer periods, up to 10 years or more.
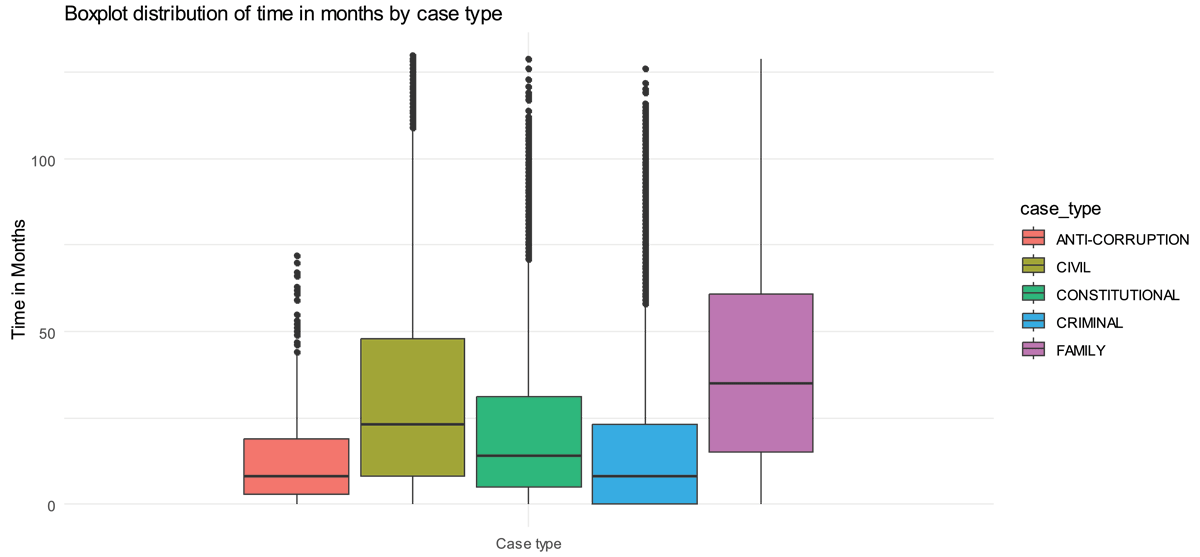
Figure 2
Boxplot of time by case.
Civil cases follow a similar pattern, with the second-highest median duration of approximately 23 months. However, the distribution is also positively skewed, with the 75th percentile at around 48 months and the maximum duration approaching 130 months. While there are fewer extreme outliers compared to family cases, a substantial number of civil cases still require 4 years or longer to conclude.
Comparatively, constitutional cases take 14 months on average. Compared to family and civil cases, the distribution is less skewed, yet outliers surpass 100 months. Criminal and anti-corruption cases have the lowest median lengths, 8 months. These case categories have less skewed distributions; however, some outliers have case durations beyond 100 months.
The boxplot shows that case durations vary greatly within and across case categories. Outliers and strong right skewness for particular case categories show that certain variables or events may be causing these lengthy durations, warranting additional examination. The broad ranges and diversity within each case category suggest that court-specific factors, case complexity, and resource availability may affect case resolution time.
3.2 Survival Analysis
3.2.1 Kaplan Meier survival curve
Kaplan-Meier curves show the survival function, which assesses the chance of instances “surviving” or remaining unresolved after a certain time point. These curves help explain case durations and compare resolution rates across case kinds.
Anti-corruption cases have a strong early decrease in the Kaplan-Meier curve, suggesting that many are resolved within a year as shown in Figure 3. The curve flattens rapidly, implying that the remaining cases are settled within a few years with fewer long-term outliers than other case categories. Similar to anti-corruption proceedings, criminal cases reduce sharply in the early months, indicating that many are concluded quickly swiftly. The curve flattens more gradually, suggesting a prolonged resolution rate for non-anti-corruption cases.
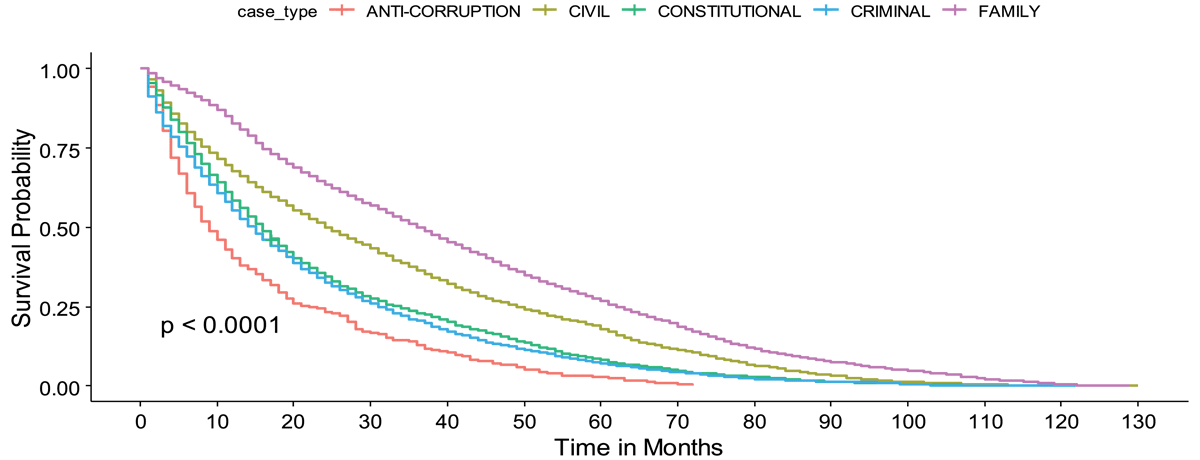
Figure 3
Kaplan Meier survival curve per case type.
The constitutional Kaplan-Meier curve declines more incrementally than anti-corruption and criminal cases, indicating a slower resolution rate. The graph slopes downward, suggesting consistent but slower case resolution. Civil cases had a slower initial fall than other case categories, suggesting fewer early resolutions. The slope then progressively flattens out, implying that many civil disputes take months, possibly even years to settle.
Family cases had the longest case resolution time and the slowest Kaplan-Meier curve decrease. The steep slope of the graph indicates that family cases have a low-resolution rate over time, with many cases remaining unresolved after many years.
Summarily, the Kaplan-Meier curve illustrates how case resolution rates vary greatly by type. Concretely, the settlement rate of constitutional cases is slower than that of anti-corruption and criminal trials, while civil and family matters take even longer to settle, with numerous such cases remaining unresolved for years. These findings suggest that court processes for family cases need targeted reforms and additional resources to reduce delays.
3.2.2 Survival regression models
Based on the provided results, the following survival models were fitted to the court case data: Cox Proportional Hazards Model, Weibull Model, Exponential Model, Log-normal Model, and Log-logistic Model.
Cox Proportional Hazards Model
The Cox Proportional Hazards Model examines the effect of case type and appeal status on the hazard rate, or the risk of case resolution. According to the results in Table 3, civil cases have a significantly lower hazard rate for case resolution compared to the reference case type, anti-corruption cases. The hazard ratio of 0.502 indicates that civil cases have approximately 49.8% lower risk of being resolved at any given point in time, suggesting that civil cases tend to take longer to resolve than anti-corruption cases. This effect is statistically significant, with a 95% confidence interval of [0.456, 0.553] and a p-value less than 0.001.
Table 3
Results of the Cox Proportional Hazards Model.
| COVARIATE | COEFFICIENT (β) | HAZARD RATIO (exp(β)) | 95% CI FOR HAZARD RATIO | p-VALUE |
|---|---|---|---|---|
| Case Type: Civil | –0.690 | 0.502 | [0.456, 0.553] | <0.001 |
| Case Type: Constitutional | –0.470 | 0.625 | [0.566, 0.690] | <0.001 |
| Case Type: Criminal | –0.073 | 0.930 | [0.844, 1.024] | 0.138 |
| Case Type: Family | –1.105 | 0.331 | [0.301, 0.365] | <0.001 |
| Appeals | –0.312 | 0.732 | [0.720, 0.743] | <0.001 |
Similarly, constitutional cases also exhibit a lower hazard rate for case resolution compared to anti-corruption cases. With a hazard ratio of 0.625, constitutional cases have a 37.5% lower risk of being resolved at any given time point, indicating that such proceedings tend to have longer durations than anti-corruption cases. This effect is statistically significant, with a 95% confidence interval of [0.566, 0.690] and a p-value less than 0.001.
In contrast, the difference in case resolution rate between criminal cases and anti-corruption cases is not statistically significant. The hazard ratio of 0.930 for criminal cases suggests a 7% lower hazard rate compared to anti-corruption cases, but the 95% confidence interval [0.844, 1.024] includes 1, and the p-value of 0.138 indicates that this difference is not significant.
Family cases exhibit the most pronounced effect, with a hazard ratio of 0.331, indicating that family cases have a 66.9% lower hazard rate for case resolution compared to anti-corruption cases. This suggests that family cases take significantly longer to resolve than anti-corruption cases. Notably, the effect is statistically significant, with a 95% confidence interval of [0.301, 0.365] and a p-value less than 0.001.
With regards to the appeal status, the results show that appealed cases have a lower hazard rate for case resolution compared to non-appealed cases. The hazard ratio of 0.732 indicates that appealed cases have a 26.8% lower risk of being resolved at any given point in time, suggesting that the duration of appealed cases tend to exceed those of non-appealed cases. This effect is statistically significant, with a 95% confidence interval of [0.720, 0.743] and a p-value less than 0.001.
The hazard ratios indicate that civil, constitutional, and family cases have a lower hazard rate (longer duration) compared to the reference case type (anti-corruption). Appeal cases also have a lower hazard rate (longer duration) compared to non-appealed cases.
Weibull Model
The Weibull Model is a parametric survival model that assumes the survival times follow a Weibull distribution. In this model, the coefficients represent the log of the acceleration factor, where positive values indicate a shorter duration and negative values indicate a longer duration compared to the reference group as shown in Table 4.
Table 4
Results of the Weibull Model.
| COVARIATE | COEFFICIENT (β) | exp(β) | STANDARD ERROR | z-VALUE | p-VALUE |
|---|---|---|---|---|---|
| (Intercept) | 2.767 | 15.905 | 0.047 | 59.310 | <0.001 |
| Appeals | 0.130 | 1.139 | 0.008 | 16.600 | <0.001 |
| Case Type: Civil | 0.674 | 1.962 | 0.047 | 14.370 | <0.001 |
| Case Type: Constitutional | 0.432 | 1.541 | 0.048 | 9.010 | <0.001 |
| Case Type: Criminal | 0.310 | 1.363 | 0.047 | 6.600 | <0.001 |
| Case Type: Family | 0.992 | 2.696 | 0.047 | 21.080 | <0.001 |
The intercept coefficient of 2.767 corresponds to the baseline hazard rate for the reference group (anti-corruption cases without appeals). The positive value suggests a relatively higher hazard rate or shorter duration for this group.
Regarding the appeal status, the coefficient of 0.130 and the corresponding exp(β) value of 1.139 indicate that appealed cases have a 13.9% higher hazard rate compared to non-appealed cases. In other words, appealed cases tend to have shorter durations than non-appealed cases, after accounting for the effects of case type. This effect is statistically significant, with a z-value of 16.600 and a p-value less than 0.001.
Considering case types, civil cases have a coefficient of 0.674 and an exp(β) value of 1.962, suggesting that civil cases have a 96.2% higher hazard rate (or shorter duration) compared to anti-corruption cases. This effect is statistically significant (z = 14.370, p < 0.001). Similarly, constitutional cases (coefficient = 0.432, exp(β) = 1.541) and criminal cases (coefficient = 0.310, exp(β) = 1.363) also exhibit higher hazard rates (or shorter durations) compared to anti-corruption cases, with statistically significant effects.
However, family cases show a different pattern. The coefficient of 0.992 and the corresponding exp(β) value of 2.696 indicate that family cases have a 169.6% higher hazard rate (or shorter duration) compared to anti-corruption cases. This effect is statistically significant (z = 21.080, p < 0.001), but the positive value of the coefficient is counterintuitive, as family cases are generally expected to have longer durations based on the previous models.
Exponential Model
The Exponential Model is a special case of the Weibull Model, which assumes a constant hazard rate over time for the survival times. This model provides insight into the effects of the case type and appeal status on the hazard rate or the risk of case resolution.
The intercept coefficient of 2.714 represents the baseline hazard rate for the reference group, which is anti-corruption cases without appeals. The positive value suggests a relatively higher hazard rate or shorter duration for this group as shown in Table 5.
Table 5
Results of the Exponential Model.
| COVARIATE | COEFFICIENT (β) | exp(β) | STANDARD ERROR | z-VALUE | p-VALUE |
|---|---|---|---|---|---|
| (Intercept) | 2.714 | 15.078 | 0.052 | 52.570 | <0.001 |
| Appeals | 0.153 | 1.166 | 0.009 | 17.750 | <0.001 |
| Case Type: Civil | 0.679 | 1.972 | 0.052 | 13.070 | <0.001 |
| Case Type: Constitutional | 0.443 | 1.558 | 0.053 | 8.350 | <0.001 |
| Case Type: Criminal | 0.307 | 1.360 | 0.052 | 5.910 | <0.001 |
| Case Type: Family | 1.017 | 2.766 | 0.052 | 19.530 | <0.001 |
For the appeal status, the coefficient of 0.153 and the corresponding exp(β) value of 1.166 indicate that appealed cases have a 16.6% higher hazard rate compared to non-appealed cases. This means that appealed cases tend to have shorter durations than non-appealed cases, after accounting for the effects of case type. The effect is statistically significant, with a z-value of 17.750 and a p-value less than 0.001.
Regarding case types, civil cases have a coefficient of 0.679 and an exp(β) value of 1.972, suggesting that civil cases have a 97.2% higher hazard rate (or shorter duration) compared to anti-corruption cases. This effect is statistically significant, with a z-value of 13.070 and a p-value less than 0.001. Similarly, constitutional cases (coefficient = 0.443, exp(β) = 1.558) and criminal cases (coefficient = 0.307, exp(β) = 1.360) also exhibit higher hazard rates (or shorter durations) compared to anti-corruption cases, with statistically significant effects.
Family cases, however, show a different pattern. The coefficient of 1.017 and the corresponding exp(β) value of 2.766 indicate that family cases have a 176.6% higher hazard rate (or shorter duration) compared to anti-corruption cases. This effect is statistically significant, with a z-value of 19.530 and a p-value less than 0.001. However, similar to the Weibull Model, the positive value of the coefficient contradicts the expected pattern observed in the previous models, where family cases tend to have longer durations.
Log-normal Model
The Log-normal Model assumes that the logarithm of the survival times follows a normal distribution. This model provides insights into the effects of the case type and appeal status on the duration of cases, as shown in Table 6.
Table 6
Results of the Log-normal Model.
| COVARIATE | COEFFICIENT (β) | exp(β) | STANDARD ERROR | z-VALUE | p-VALUE |
|---|---|---|---|---|---|
| (Intercept) | 2.110 | 8.249 | 0.058 | 36.450 | <0.001 |
| Appeals | 0.506 | 1.659 | 0.010 | 52.530 | <0.001 |
| Case Type: Civil | 0.627 | 1.873 | 0.058 | 10.770 | <0.001 |
| Case Type: Constitutional | 0.537 | 1.711 | 0.060 | 9.020 | <0.001 |
| Case Type: Criminal | 0.181 | 1.199 | 0.058 | 3.110 | 0.002 |
| Case Type: Family | 1.259 | 3.523 | 0.058 | 21.570 | <0.001 |
The intercept coefficient of 2.110 represents the baseline log-hazard for the reference group, which is anti-corruption cases without appeals. The positive value of the coefficient suggests a relatively higher hazard rate or shorter duration for this group.
Regarding the appeal status, the coefficient of 0.506 and the corresponding exp(β) value of 1.659 indicate that appealed cases have a 65.9% higher hazard rate compared to non-appealed cases. In other words, appealed cases tend to have shorter durations than non-appealed cases, after accounting for the effects of case type. This effect is statistically significant, with a z-value of 52.530 and a p-value less than 0.001.
Considering case types, civil cases have a coefficient of 0.627 and an exp(β) value of 1.873, suggesting that civil cases have an 87.3% higher hazard rate (or shorter duration) compared to anti-corruption cases. This effect is statistically significant, with a z-value of 10.770 and a p-value less than 0.001. Similarly, constitutional cases (coefficient = 0.537, exp(β) = 1.711) also exhibit a higher hazard rate (or shorter duration) compared to anti-corruption cases, with a statistically significant effect (z = 9.020, p < 0.001).
For criminal cases, the coefficient of 0.181 and the corresponding exp(β) value of 1.199 indicate a 19.9% higher hazard rate (or shorter duration) compared to anti-corruption cases. This effect is statistically significant, with a z-value of 3.110 and a p-value of 0.002.
However, family cases show a different pattern. The coefficient of 1.259 and the corresponding exp(β) value of 3.523 indicate that family cases have a 252.3% higher hazard rate (or shorter duration) compared to anti-corruption cases. This effect is statistically significant, with a z-value of 21.570 and a p-value less than 0.001. Similar to the Weibull and Exponential Models, the positive value of the coefficient contradicts the expected pattern observed in the previous models, where family cases tend to have longer durations.
Log-logistic Model
The Log-logistic Model assumes that the logarithm of the survival times follows a logistic distribution. This model provides insights into the effects of the case type and the appeal status on the duration of cases as shown in Table 7.
Table 7
Results of the Log-logistic Model.
| COVARIATE | COEFFICIENT (β) | exp(β) | STANDARD ERROR | z-VALUE | p-VALUE |
|---|---|---|---|---|---|
| (Intercept) | 2.125 | 8.371 | 0.058 | 36.460 | <0.001 |
| Appeals | 0.484 | 1.622 | 0.010 | 49.910 | <0.001 |
| Case Type: Civil | 0.704 | 2.022 | 0.059 | 12.000 | <0.001 |
| Case Type: Constitutional | 0.588 | 1.800 | 0.060 | 9.800 | <0.001 |
| Case Type: Criminal | 0.237 | 1.267 | 0.059 | 4.020 | <0.001 |
| Case Type: Family | 1.330 | 3.783 | 0.059 | 22.640 | <0.001 |
The intercept coefficient of 2.125 represents the baseline log-hazard for the reference group, which is anti-corruption cases without appeals. The positive value of the coefficient suggests a relatively higher hazard rate or shorter duration for this group.
As for the appeal status, the coefficient of 0.484 and the corresponding exp(β) value of 1.622 indicate that appealed cases have a 62.2% higher hazard rate compared to non-appealed cases. In other words, appealed cases tend to have shorter durations than non-appealed cases, after accounting for the effects of case type. This effect is statistically significant, with a z-value of 49.910 and a p-value less than 0.001.
Considering case types, civil cases have a coefficient of 0.704 and an exp(β) value of 2.022, suggesting that civil cases have a 102.2% higher hazard rate (or shorter duration) compared to anti-corruption cases. This effect is statistically significant, with a z-value of 12.000 and a p-value less than 0.001. Similarly, constitutional cases (coefficient = 0.588, exp(β) = 1.800) and criminal cases (coefficient = 0.237, exp(β) = 1.267) also exhibit higher hazard rates (or shorter durations) compared to anti-corruption cases, with statistically significant effects.
However, family cases once again show a different pattern. The coefficient of 1.330 and the corresponding exp(β) value of 3.783 indicate that family cases have a 278.3% higher hazard rate (or shorter duration) compared to anti-corruption cases. This effect is statistically significant, with a z-value of 22.640 and a p-value less than 0.001. Similar to the previous parametric models, the positive value of the coefficient contradicts the expected pattern observed in the non-parametric models, where family cases tend to have longer durations.
3.3 Model Comparison
Based on the provided AIC results in Table 8, the Weibull model emerges as the best-performing model among the compared models, with the lowest AIC value of 713383.0. A lower AIC value indicates a better trade-off between goodness of fit and model complexity.
Table 8
Comparison of Survival Models Using AIC.
| MODEL | df | AIC |
|---|---|---|
| Cox Proportional Hazards | 5 | 1915086.7 |
| Weibull | 7 | 713383.0 |
| Exponential | 6 | 714643.8 |
| Log-normal | 7 | 721860.8 |
| Log-logistic | 7 | 723709.4 |
The Cox Proportional Hazards model (coxph), despite being a semi-parametric model with more flexibility, has a substantially higher AIC value of 1915086.7, suggesting that the Weibull distribution provides a better fit to the case disposition data compared to the Cox model.
Among the other parametric models, the Exponential model, which is a special case of the Weibull model with a constant hazard rate, has the next lowest AIC value of 714643.8. This indicates that the added flexibility of the Weibull distribution, which allows for a non-constant hazard rate, improves the model fit compared to the Exponential model.
The Log-normal and Log-logistic models have greater AIC values than both the Weibull and Exponential models, indicating a worse data match. The Weibull distribution may better describe case disposition data than these models, which assume different logarithmic distributions for survival periods.
The findings echo global concerns about judicial inefficiencies, as noted by Bielen et al. (2017), who identified the societal costs of prolonged case resolutions, such as weakened public trust and economic losses. Similarly, the delays observed in Kenyan courts, as documented by KNBS (2020) and Maseno (2019), highlight systemic issues that require immediate attention. The advanced quantitative techniques used in this study contribute to a growing body of literature advocating for evidence-based reforms in judicial systems worldwide.
This study reveals critical insights into case resolution timelines within the Kenyan High Courts. Family cases exhibit the longest median resolution time, averaging 35 months, indicating a need for targeted reforms in these courts. By contrast, anti-corruption and criminal cases are resolved much faster, with a median resolution time of just 8 months. Furthermore, cases involving appeals require significantly more time to resolve than cases that were not appealed, highlighting the impact of procedural complexities and resource allocation challenges. These findings emphasize the necessity of prioritizing resource distribution and adopting streamlined case management practices to reduce delays, particularly for family and civil cases.
While the Cox Proportional Hazards model successfully identifies predictors such as the case type and appeal status, parametric models, such as Weibull, provide better long-term predictions. For example, the Weibull model illustrates that delays in family and civil cases increase over time, reflecting systemic challenges that may not be immediately visible. Retaining all models enhances the analysis by providing detailed insights into both short-term trends and long-term patterns.
4. Discussion
This study illuminates Kenya’s High Court case disposition timelines and compares survival analysis methodologies for forecasting this key outcome. Exploratory data analysis and thorough modeling comparisons revealed major case duration factors and indicated that parametric Weibull regression was superior to semi-parametric choices.
Nevertheless, delays in Kenyan High Courts are influenced by broader systemic issues not captured in this dataset, such as staffing shortages, variations in judicial expertise, and inconsistent case management practices. For instance, courts with fewer judges per capita often struggle to process complex cases efficiently, leading to prolonged delays. Recognizing these factors is critical for addressing the fundamental causes of judicial inefficiencies.
In accordance with Amutah, M. (2015), our EDA found that family concerns last the longest, whereas anti-corruption cases and criminal matters are resolved most expeditiously. These findings show that varied litigation sectors need court-specific changes and resource optimization (Maseno, 2019; Wakhungu, 2018). Appealed cases consumed significantly more time than non-appealed ones, demonstrating how case factors may delay resolution.
Nonetheless, this study has limitations, including potential biases such as missing data on case complexity and confounders like judicial caseloads. While survival models provide a robust framework for analysis, they simplify dynamic court processes that evolve over time. Future studies should incorporate qualitative methods, such as interviews with legal experts, to complement these quantitative findings.
The parametric Weibull distribution outperformed the semi-parametric Cox Proportional Hazards assumption in Akaike Information Criterion survival regression model evaluations. This contradicts earlier research that recommended Cox models over parametric ones with tight assumptions (Teshnizi et al., 2017). It supports the idea that Weibull and other parametric distributions might improve data structure accuracy and efficiency, notably in health sciences.
The findings from this study illustrate how different aspects of the judicial process contribute to delays in case resolution and how each model helps identify and address these issues.
Delays in Family and Civil Cases
The Kaplan-Meier curves and Cox model reveal that family cases experience the most delays, followed by civil cases. These findings point to the need for procedural changes, such as implementing specialized mediation or prioritizing these case types. The Weibull model further supports this by predicting extended durations for these cases in the future.
Impact of Appeals
The Cox model underscores the significant role appeals play in delaying case resolution. Cases with appeals take substantially longer to resolve, suggesting that simplifying the appeals process could be an effective reform. The Kaplan-Meier survival curves confirm this by showing slower resolution rates for appealed cases compared to those without appeals.
Resource Allocation
The Weibull model’s predictions highlight the importance of allocating resources based on expected delays. Family and civil cases, which require more time to resolve, should receive higher priority. This predictive insight is crucial for improving court efficiency and ensuring that resources are directed to areas where they are most needed.
The superiority of the Weibull model suggests that the underlying hazard of case disposition within Kenya’s judicial system may not uphold the proportional hazards assumption. Rather, the hazard function appears to follow the non-constant, monotonically increasing or decreasing form characterized by the Weibull’s shape and scale parameters. This highlights how methodologically flexible parametric models can sometimes provide a better fit to real-world data than semi-parametric techniques.
Importantly, the estimates and hazard ratios derived from the best-fitting Weibull specification offer interpretable quantification of the effects exerted by different case types and the appeal status. Cases involving civil matters, constitutional issues, and family disputes all exhibited significantly lower hazards of resolution compared to the anti-corruption reference category. Appealed cases are also resolved at reduced rates compared to their non-appealed counterparts. These findings can guide judicial resource allocation and policies to address areas with disproportionately longer case dependencies.
From a broader perspective, this work addresses identified gaps by introducing advanced survival analysis techniques to characterize delays and inefficiencies within Kenya’s judicial system. The ability to quantify backlog dynamics through rigorous data modeling lays the analytical foundation for evidence-based policies to strengthen court processes, optimize resource deployment, and ultimately uphold constitutional guarantees of timely justice.
5. Conclusion
This study employed a rigorous analytical framework to investigate the determinants of case disposition timelines within Kenya’s High Court system. By leveraging exploratory data analysis techniques and survival regression modeling, we identified significant predictors of case duration and evaluated the performance of various parametric and semi-parametric survival models. The Weibull distribution emerged as the best-fitting parametric specification according to the Akaike Information Criterion, outperforming the commonly used semi-parametric Cox Proportional Hazards model for these data.
Estimates from the Weibull regression revealed that cases involving civil matters, constitutional issues, family disputes, and appeals all exhibited significantly lower hazards of resolution compared to the anti-corruption reference category. These findings underscore how certain case characteristics can prolong judicial proceedings, with profound ramifications for economic productivity, social welfare, and public trust in the legal system.
While representing a substantial advance over previous representations, potential limitations include counterintuitive results for family cases and the need to explore additional court-level and contextual covariates. Nonetheless, this study provides a robust quantitative framework to identify obstacles, allocate resources effectively, and uphold constitutional guarantees of timely access to justice for all Kenyan citizens.
Looking ahead, valuable extensions include comparative analyses across regional court jurisdictions, the incorporation of qualitative insights from legal experts, and the development of forecasting models to anticipate future caseloads and optimize operational planning. Continued refinement of the survival regression approach, coupled with a comprehensive understanding of the underlying institutional dynamics, can drive evidence-based judicial reforms to enhance Kenya’s economic competitiveness and societal well-being.
6. Recommendations
The findings of this study provide comprehensive insights into the duration of case determination in Kenyan High Courts, which calls for prompt action to address the identified areas of improvement. By focusing on key areas, the Kenyan judiciary can become significantly more efficient and responsive, ensuring that justice is delivered within a time frame that respects the needs of and the parties involved. Prioritizing resources for family and civil cases, which often require more time, can help resolve these disputes more quickly, reducing stress and uncertainty for families and individuals involved (Bielen et al., 2017). Streamlining the appeal process to address the significant delays highlighted by the Cox model is essential. Simplifying the process or introducing pre-appeal screening mechanisms to only include crucial cases can accelerate resolutions and help reduce the time required to resolve these cases, improving overall efficiency.
The resource allocation should be guided by the predictions of the Weibull model, which indicates that family and civil cases will continue to require more time to resolve. Prioritizing these areas by increasing the number of judges or deploying specialized staff can enhance the court’s capacity to handle such cases more effectively. Modern case management systems can be utilized to better predict case durations and manage caseloads, minimizing waiting times. Training judges and court staff in tools like survival analysis will enhance their understanding of case trends and improve time management, leading to swifter justice.
To further address delays, especially in family and civil cases, courts should implement mediation programs to reduce reliance on lengthy trials. Developing targeted strategies for complex cases, such as family disputes, and promoting alternative resolution methods like mediation could prevent lengthy court processes. The monitoring of case durations and outcomes is crucial for identifying areas that need improvement and ensuring that courts are functioning optimally. Simplifying legal processes can help expedite case flow, particularly in civil and family courts, making dispute resolution faster. Increasing public awareness about the judicial process and the impacts of prolonged legal battles can deter frivolous lawsuits and promote quicker resolutions. Encouraging the resolution of issues out of court can further alleviate the court’s burden, offering a less formal and more amicable setting for dispute resolution. Finally, continually collecting data and researching court processes are essential for maintaining an efficient and adaptable judicial system.
Reforms may face challenges, such as limited funding and resistance to change among judiciary staff. These challenges can be mitigated through phased implementation. For instance, mediation programs can be piloted in selected courts, while training workshops on data-driven planning techniques like survival analysis can build technical capacity and foster acceptance of new processes.
Data Accessibility Statement
The data supporting the conclusions of my study titled “Analysis of Time for a Case to be Determined in Kenyan High Courts Using Survival Models” are available upon request. Interested researchers can contact Alex Kandie through email alexkandie5@gmail.com for access to the dataset.
Ethics and Consent
Due to privacy and confidentiality concerns, we cannot publicly release the dataset in its entirety. However, we can share anonymized or aggregated data under specific conditions and after approval from the relevant ethics committee. We will evaluate requests for data access on a case-by-case basis in consultation with the Office of the Registrar, Judiciary of Kenya, to ensure compliance with data protection regulations and ethical guidelines.
Acknowledgements
I am deeply grateful to God for the wisdom, strength, and opportunity to carry out this study on the Kenyan judiciary system. Special thanks to the Kenyan Judiciary for allowing me to access their extensive database of court cases, which was essential for my analysis. I appreciate the cooperation of court administrators and staff who provided valuable insights into the judicial process, enhancing the depth and accuracy of my research.
I would also like to acknowledge the support from the Department of Mathematics and Statistics, University of Embu, which provided all the necessary resources and an encouraging academic environment that enabled me to pursue this project to its finality.
In addition, my gratitude extends to my family, relatives, and friends, specifically those who actively got involved and whose support and patience were crucial during this demanding project. Their encouragement sustained me through the complexities of the research process.
Competing Interests
The authors have no competing interests to declare.
Author Contributions
All co-authors contributed significantly to the preparation and submission of this manuscript.