
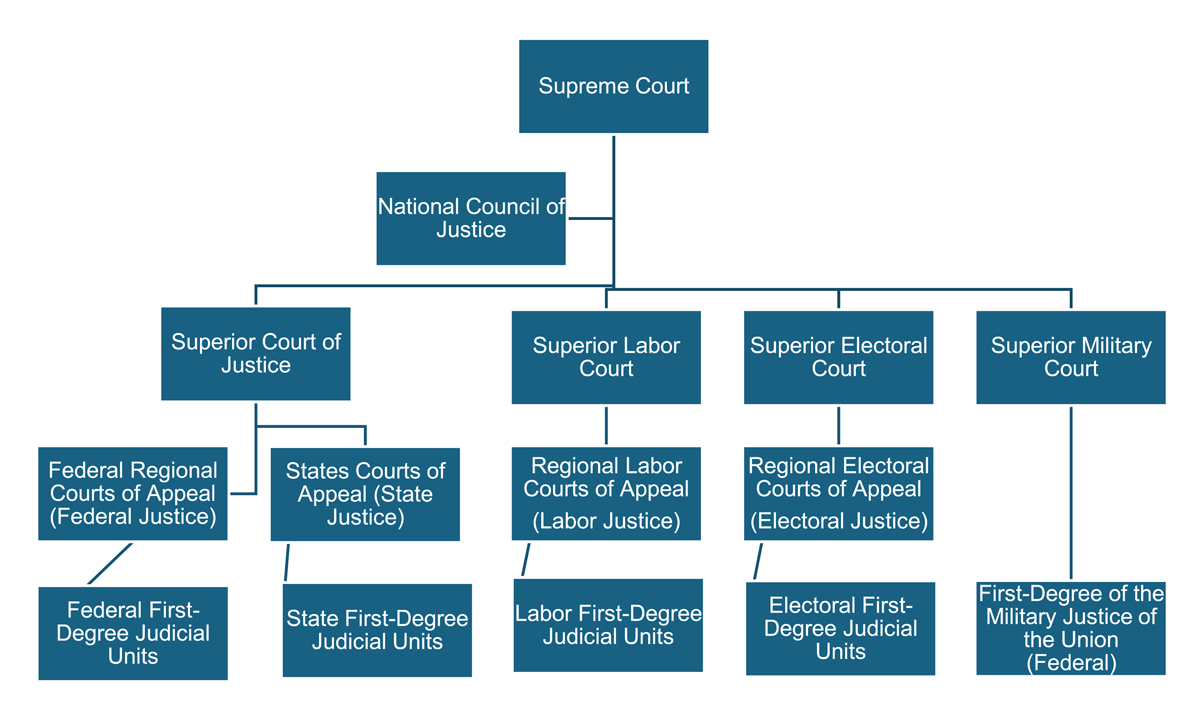
Figure 1
Organizational Chart of the Structure of the Brazilian Judiciary.
Table 1
Variables, Factors, and Factor Loadings of Judges’ Questionnaires.
| VARIABLE | RESOLVABILITY | OUTCOMES-BASED MANAGEMENT | COMMUNICATION | JUDICIAL PROCESS MANAGEMENT |
|---|---|---|---|---|
| Communicates clearly to achieve productivity targets | 0.5405 | |||
| Encourages dialogue with the team | 0.8786 | |||
| Monitors progress of delegated tasks | 0.63 | |||
| Recognizes the team’s achievements | 0.6368 | |||
| Holds regular meetings to monitor the judicial unit’s performance | 0.5253 | |||
| Welcomes suggestions from staff for service improvements | 0.5599 | |||
| Sets goals for the judicial unit | 0.8661 | |||
| Renders sentence at hearings whenever possible to expedite the court proceedings | 0.6591 | |||
| Approves agreements in conciliation sessions, with the parties present being summoned | 0.7302 | |||
| Takes actions to expedite service to the external public | 0.9574 | |||
| Monitors procedural reports from court systems | 0.8293 | |||
| Works with a focus on achieving goals | 0.6784 | |||
| Issues rulings and decisions, providing instructions to be followed by the clerk’s office in the event of future occurrences | 0.7463 | |||
| Maintains communication with external stakeholders (Public Prosecutor’s Office, Public Defender’s Office, Lawyers, etc.) to establish an effective workflow | 0.5175 |
Table 2
Variables, factors and factor loadings of the court clerks’ questionnaires.
| VARIABLE | LEADERSHIP AND TEAM MANAGEMENT | JUDICIAL PROCESS MANAGEMENT | PERFORMANCE MONITORING |
|---|---|---|---|
| Facilitates implementation of innovative work initiatives | 0.6761 | ||
| Updates knowledge to enhance the judicial unit’s performance | 0.5859 | ||
| Works actively to foster team integration | 0.7446 | ||
| Communicates clearly to achieve productivity targets | 0.6832 | ||
| Encourages dialogue with the team | 0.8974 | ||
| Holds regular staff meetings on specific topics | 0.6916 | ||
| Recognizes the team’s achievements | 0.7055 | ||
| Celebrates team successes to acknowledge achieved results | 0.5288 | ||
| Provides feedback on the quality of tasks performed by staff | 0.5769 | ||
| Holds regular meetings to monitor the judicial unit’s performance | 0.6383 | ||
| Maintains an approachable demeanor | 0.8874 | ||
| Welcomes suggestions from staff for service improvements | 0.9269 | ||
| Unifies the team around a common purpose | 0.7578 | ||
| Renders sentence at hearings whenever possible to expedite the court proceedings | 0.7068 | ||
| Approves agreements in conciliation sessions, with the parties present being summoned | 0.5261 | ||
| Takes actions to expedite service to the external public | 0.5556 | ||
| Monitors procedural reports from court systems | 0.9052 | ||
| Works with a focus on achieving goals | 0.6818 | ||
| Issues rulings and decisions, providing instructions to be followed by the clerk’s office in the event of future occurrences | 0.7572 | ||
| Maintains communication with external stakeholders (Public Prosecutor’s Office, Public Defender’s Office, Lawyers, etc.) to establish an effective workflow | 0.5918 |
Table 3
Summary of regression measures for the backlog index, judges’ model.
| FACTOR | BETA | 95% CI1 | P-VALUE |
|---|---|---|---|
| Resolvability | –0.14 | –0.43 0.14 | 0.3 |
| Outcomes-based Management | 0.30 | –0.02 0.63 | 0.065 |
| Communication | 0.14 | –0.19 0.47 | 0.4 |
| Judicial Process Management | 0.23 | –0.09 0.55 | 0.2 |
[i] CI1 = Confidence Interval.
R² = 0.156; Adjusted R² = 0.085; p-value = 0.082; Number of Observations: = 53.
Table 4
Summary of regression measures for the congestion rate, judges’ model.
| FACTOR | BETA | 95% CI1 | P-VALUE |
|---|---|---|---|
| Resolvability | –0.06 | –0.34 0.23 | 0.7 |
| Outcomes-based Management | –0.46 | –0.78 –0.14 | 0.006 |
| Communication | 0.00 | –0.33 0.33 | >0.9 |
| Judicial Process Management | 0.02 | –0.29 0.34 | 0.9 |
[i] CI1 = Confidence Interval.
R² = 0.172; Adjusted R² = 0.103; p-value = 0.055; Number of Observations: = 53.
Table 5
Summary of regression measures for the backlog index, court clerks’ model.
| FACTOR | BETA | 95% CI1 | P-VALUE |
|---|---|---|---|
| Leadership and Team Management | –0.22 | –0.49 0.04 | 0.10 |
| Judicial Process Management | 0.32 | 0.07 0.56 | 0.011 |
| Performance Monitoring | –0.12 | –0.33 0.09 | 0.2 |
[i] CI1 = Confidence Interval.
R² = 0.044; Adjusted R² = 0.027; p-value = 0.052; Number of Observations: = 177.
Table 6
Summary measures of the congestion rate regression, court clerks’ model.
| FACTOR | BETA | 95% CI1 | P-VALUE |
|---|---|---|---|
| Leadership and Team Management | 0.31 | 0.05 0.58 | 0.022 |
| Process Management | –0.32 | –0.57 –0.08 | 0.010 |
| Performance Monitoring | 0.02 | –0.19 0.22 | 0.9 |
[i] CI1 = Confidence Interval.
R² = 0.042; Adjusted R² = 0.026; p-value = 0.058; Number of Observations: = 177.