
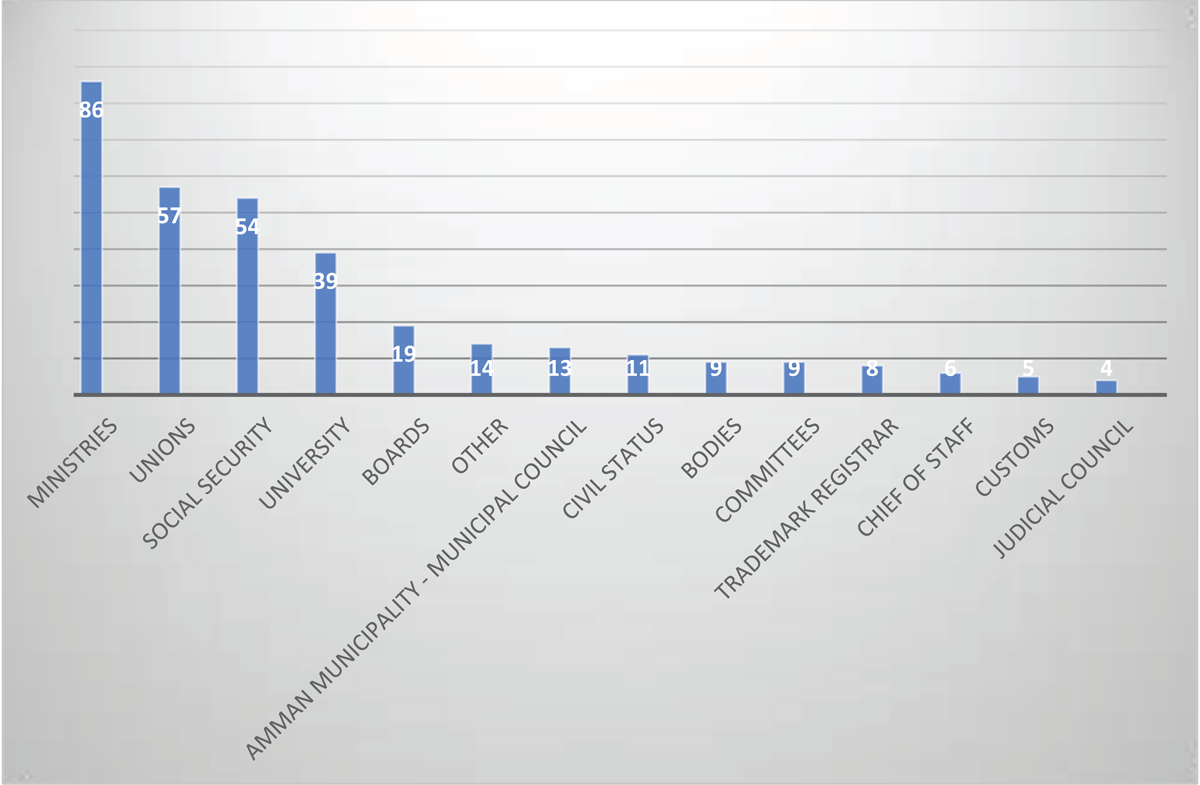
Figure 1
The Supreme Administrative Court works based on the authority issuing the administrative decision of 2020.16
Table 1
Classification of administrative orders adjudicated by the Supreme Administrative Court.
| DISMISSAL IN FORM | DISMISSAL IN SUBJECT | RESCINDED | RESCINDED AND RETURNED | A CASE CONCLUDED | TOTAL |
|---|---|---|---|---|---|
| 5 | 244 | 43 | 17 | 2 | 311 |
| 1.6% | 78.5% | 13.8% | 5.5% | 0.6% | 100% |
Table 2
The reason for cancelling the administrative decisions adjudicated by the Supreme Administrative Court.
| NUMBER OF CASES | THE REASON FOR CANCELLATION |
|---|---|
| 8 | A formal reason (related to the issuance of the decision by a non-competent party, a non-final decision, a confirmatory decision). |
| 13 | An objective reason (cancellation of the administrative decision complained of being contrary to the law) |
| 7 | Rescinding the Administrative Court’s order in a specific part and canceling the administration’s decision or rescinding it in its entirety |
| Total | 28 |
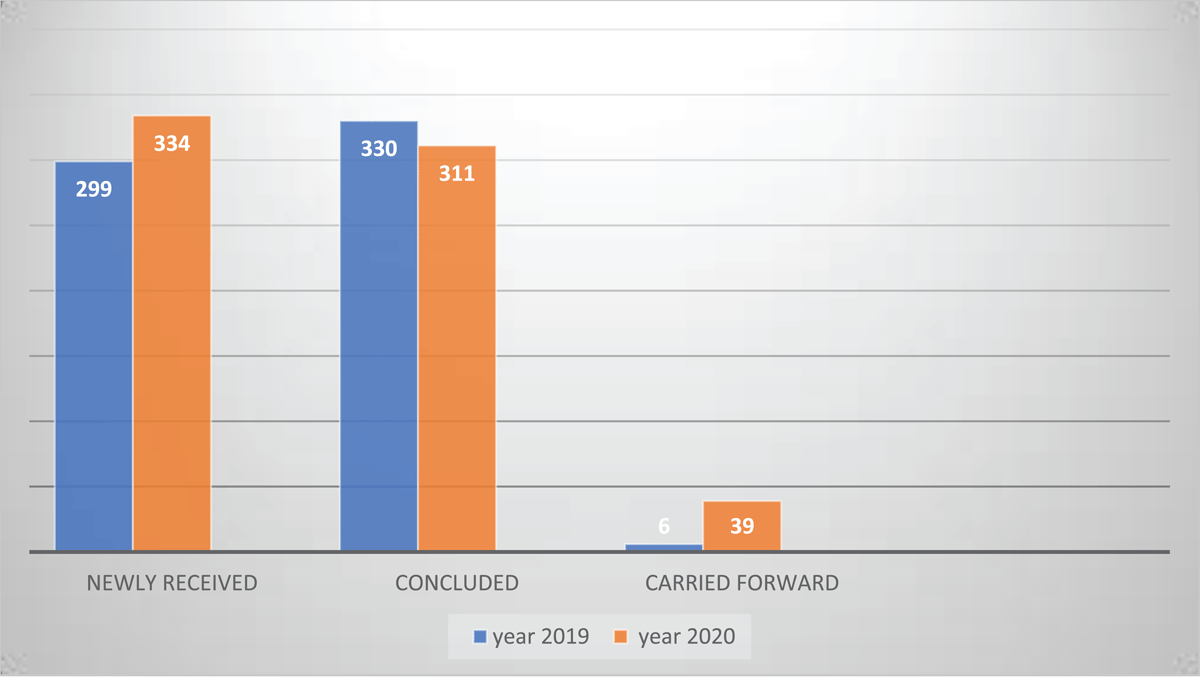
Figure 2
Change in the number of newly received, concluded and pending cases before the Supreme Administrative Court in 2020 compared to 2019.
Table 3
Rate of conclusion of cases at the Supreme Administrative Court.
| COURT | NUMBER OF CASES | THE AVERAGE NUMBER OF DAYS AT THE STAGE THE CASE PREPARATION | THE AVERAGE NUMBER OF DAYS AT THE STAGE OF ENTERTAINING THE CASE | THE AVERAGE NUMBER OF DAYS AT THE STAGE OF TYPING, CHECKING AND FILING THE CONCLUSION | TOTAL |
|---|---|---|---|---|---|
| Supreme Administrative | 305 | 8 | 38 | 25 | 71 |
| Percentage to the total | 91% | 11.5% | 53.6% | 34.9% | 100% |
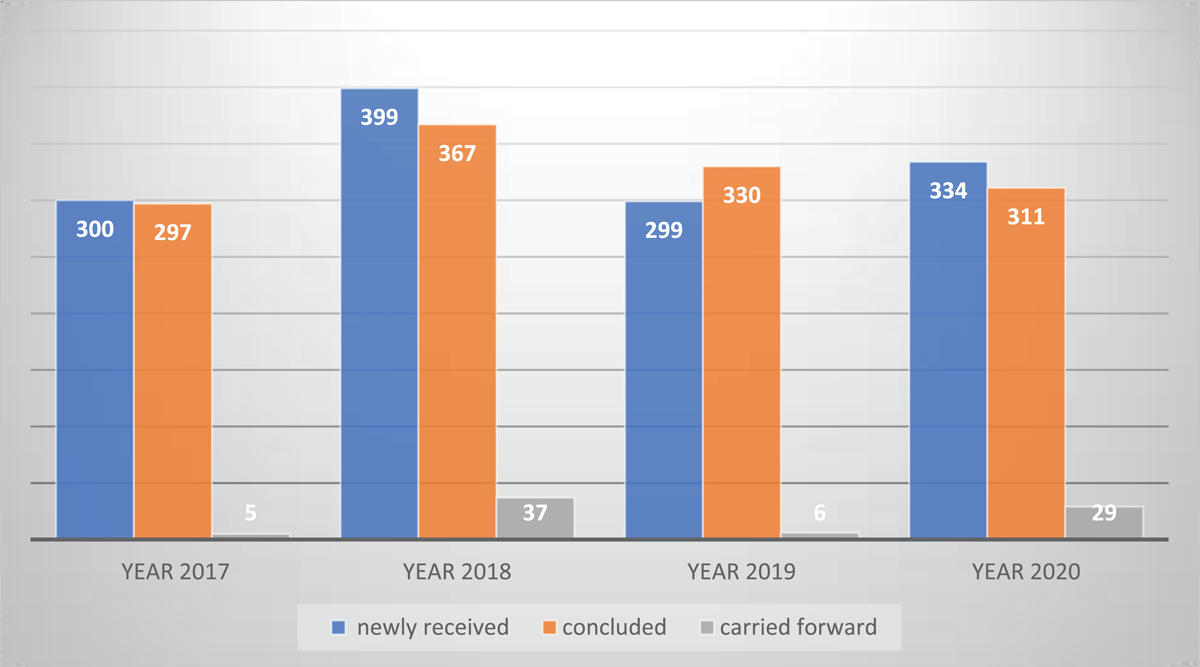
Figure 3
Change in the number of newly received, concluded and pending cases at the Supreme Administrative Court for the years (2017–2020).31
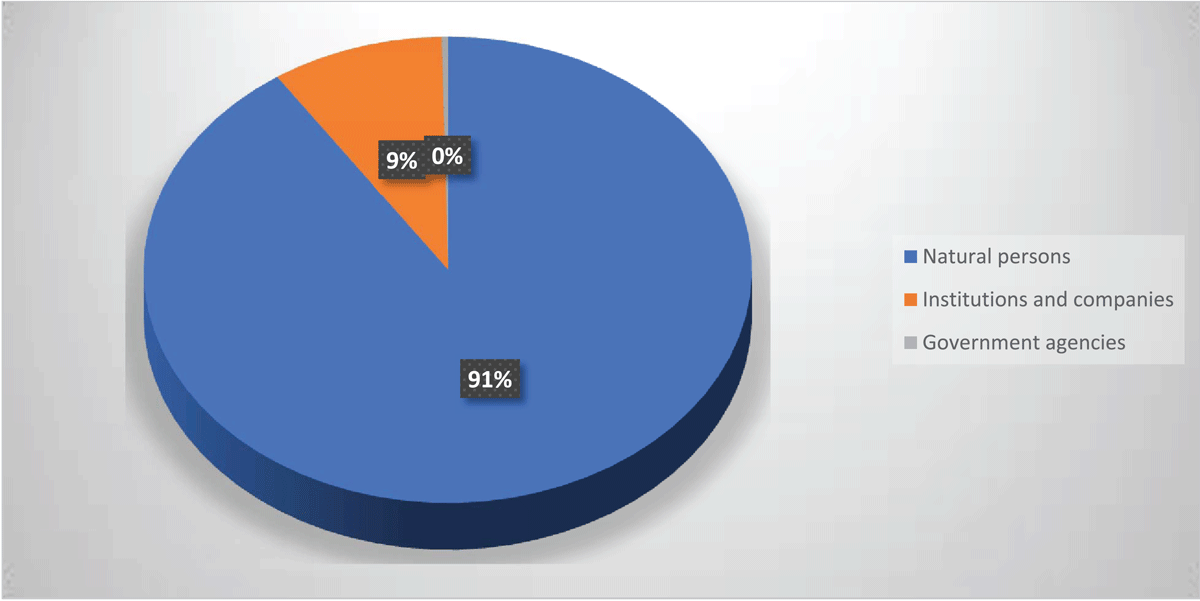
Figure 4
The works of the Administrative Court according to the party submitting the case.45
Table 4
Classification of administrative orders adjudicated by the Administrative Court.48
| DISMISSAL IN FORM | DISMISSAL IN SUBJECT | ACCEPTANCE OF THE APPEAL AND ANNULMENT OF THE ADMINISTRATIVE DECISION | DROPPING | CONSIDERING THE CASE CLOSED | TOTAL |
|---|---|---|---|---|---|
| 141 | 187 | 104 | 53 | 7 | 492 |
| 29% | 38% | 21% | 11% | 1% | 100% |
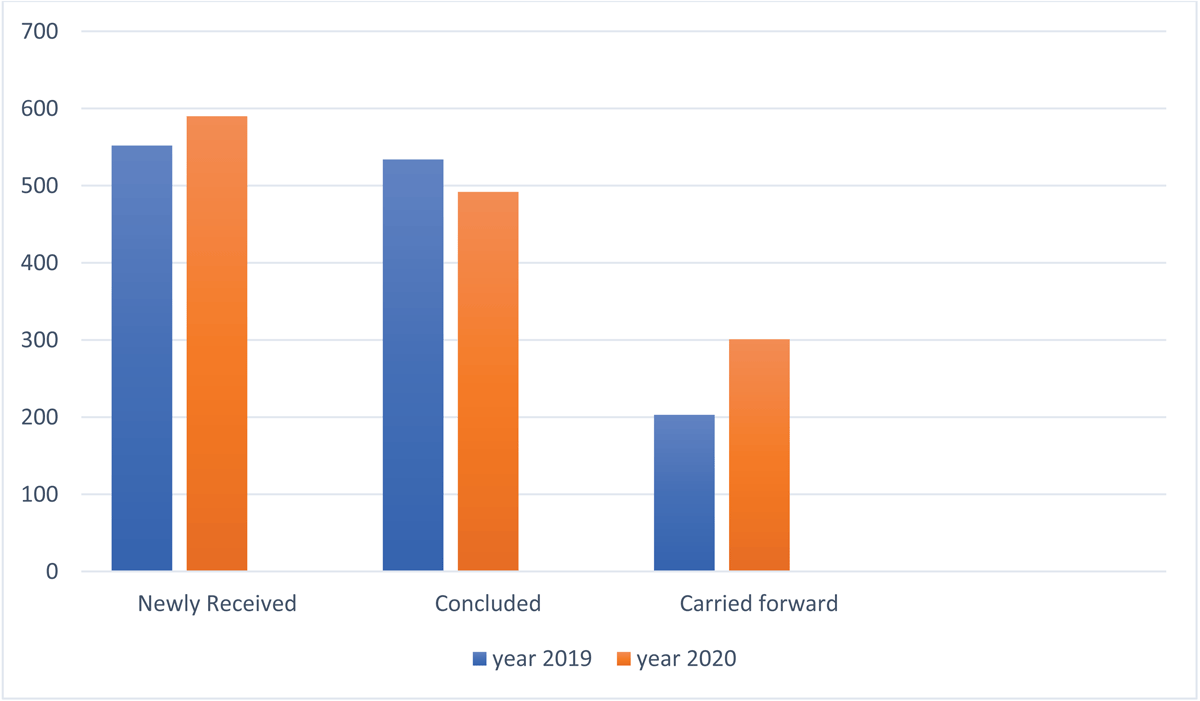
Figure 5
Change in the number of newly received, concluded and pending cases before the Administrative Court in 2020 compared to 2019.
Table 5
The rate of adjudication of cases before the Administrative Court.52
| THE COURT | NUMBER OF CASES | THE AVERAGE NUMBER OF DAYS AT THE STAGE OF PREPARATION OF THE CASE | THE AVERAGE NUMBER OF DAYS AT THE STAGE OF ENTERTAINING THE CASE | THE AVERAGE NUMBER OF DAYS AT THE STAGE OF TYPING, CHECKING AND FILING THE CONCLUSION | TOTAL |
|---|---|---|---|---|---|
| Administrative Court | 289 | 99 | 62% | 8 | 168 |
| Percentage of the total | 49% | 58.8% | 36.8% | 4.4 | 100% |
Table 6
Appeals submitted by the Public Prosecution to the Supreme Administrative Court.
| NUMBER OF CASES RECEIVED | NUMBER OF CASSATION CASES (RULED FOR THE BENEFIT OF THE PUBLIC PROSECUTION) | NUMBER OF CASES DISMISSED IN SUBJECT (RULED AGAINST THE PUBLIC PROSECUTION) |
|---|---|---|
| 55 | 9 | 26 |
Table 7
The agenda of the Administrative Public Prosecution before the Administrative Court.
| THE AGENDA OF THE ADMINISTRATIVE PUBLIC PROSECUTION BEFORE THE ADMINISTRATIVE COURT | THE CONCLUDED CASE BASED ON THE MANNER OF THE SAME | |||||||
|---|---|---|---|---|---|---|---|---|
| CARRIED FORWARD FROM 2019 | NEWLY RECEIVED CASES DURING 2020 | TOTAL CARRIED FORWARD (PENDING) | CONCLUDED CASES | CURRENT PENDING | CANCELLATION OF THE ADMINISTRATIVE DECISION | DISMISSAL OF THE CASE | DROPPING THE CASE | CONSIDERING THE CASE TERMINATED AND IRRELEVANT |
| 96 | 289 | 385 | 249 | 136 | 55 | 156 | 31 | 7 |