
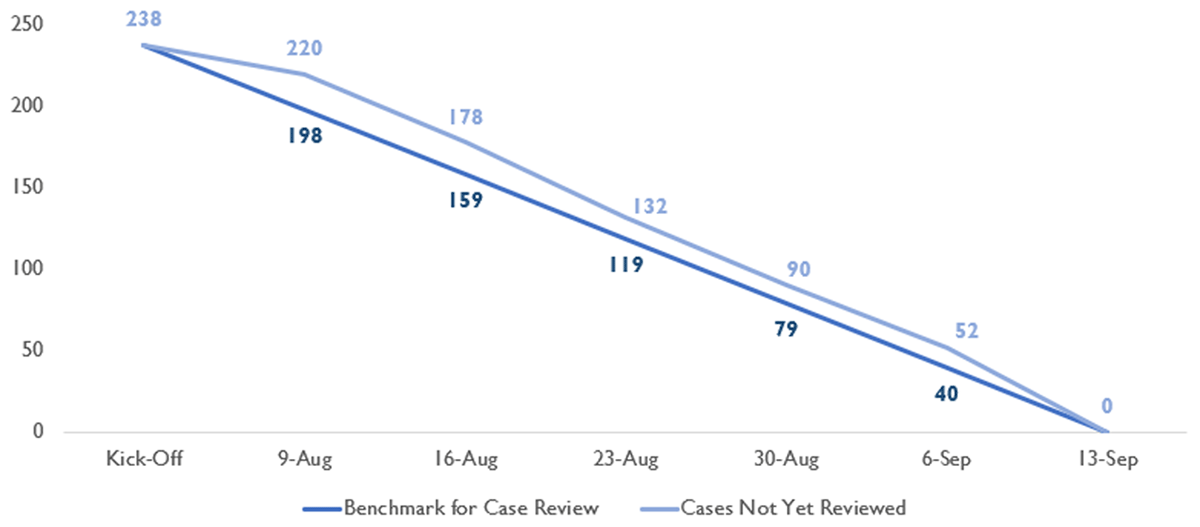
Figure 1
Data Review Cycle Management: Burn Down Chart – Example.
Table 1
Data Review Cycle Management: Weekly Conversion Issue Monitoring – Example.
| ISSUE STATUS | COUNT | PERCENTAGE |
|---|---|---|
| Active | 13 | 3.2% |
| Waiting for Push | 0 | 0.0% |
| Waiting to Close | 0 | 0.0% |
| Ready for Review | 1 | 0.2% |
| Closed | 390 | 96.1% |
| Resolved | 0 | 0.0% |
| Reopened | 0 | 0.0% |
| On Hold | 2 | 0.5% |
| Total | 406 | 100.0% |
| PRIORITY STATUS | COUNT | PERCENTAGE |
| Low | 39 | 9.6% |
| Medium | 245 | 60.3% |
| High | 82 | 20.2% |
| Showstopper | 40 | 9.9% |
| Total | 406 | 100.0% |
| PRIORITY STATUS (AMONG ACTIVE) | COUNT | PERCENTAGE |
| Low | 0 | 0.0% |
| Medium | 7 | 53.8% |
| High | 4 | 30.8% |
| Showstopper | 2 | 15.4% |
| Total | 13 | 100.0% |
[i] Note: Data reflective of issue status as of September 27, 2020.
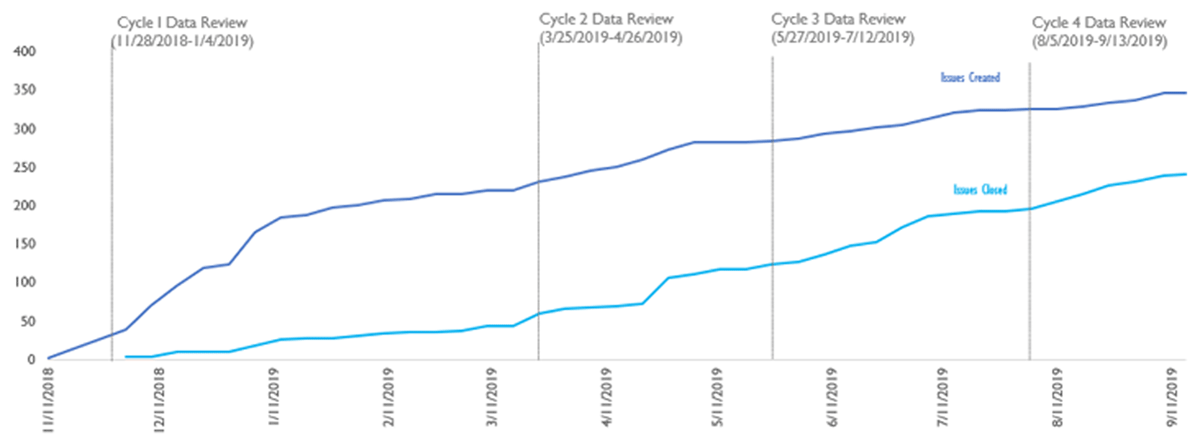
Figure 2
Conversion Issue Monitoring: Burn Up, Data Review Cycles 1–4.
Table 2
Conversion Issue Monitoring: Issues Created, Closed and Cleared, by Cycle.8
| PERFORMANCE METRICS | CYCLE 1 | CYCLE 2 | CYCLE 3 | CYCLE 4 | TOTAL |
|---|---|---|---|---|---|
| Issues Created | 220 | 62 | 42 | 22 | 346 |
| Issues Closed | 44 | 73 | 76 | 48 | 241 |
| Clearance Rates | 20.0% | 117.7% | 180.9% | 218.2% | 69.7% |
[i] Note: The ‘cycle’ period in the table reflects issue counts up until the beginning of the next data review cycle.