
Table 1.
Characteristics and results of biomarker examination.
| Characteristic | Description/category | PE (55) | Normotension (55) | Signifikan |
|---|---|---|---|---|
| Age (years) | Mean ± SD (Min-Maks) | 32.86 ± 6.61 (21–44) | 25.63 ± 3.10 (21–31) | <0.001b |
| Parity | Primigravida | 13.8 | 17.2 | 0.024c |
| Multigravida | 34.5 | 19.0 | ||
| Grandemultigravida | 13.8 | 1.7 | ||
| Pre-pregnancy weight | Mean ± SD (Min-Maks) | 69.75 ± 18.71 (49.00–125.00) | 47.19 ± 6.45 (35.00–59.00) | <0.001b |
| BMI (kg/m2) | Mean ± SD (Min-Maks) | 30.12 ± 7.04 (18.30–48.80) | 20.45 ± 2.31 (15.40–24.60) | <0.001a |
| Sistole (mmHg) | Mean ± SD (Min-Maks) | 161.11 ± 17.34 (117–193) | 104.54 ± 7.01 (90–122) | <0.001b |
| Diastole (mmHg) | Mean ± SD (Min-Maks) | 101.11 ± 14.21 (76–130) | 68.45 ± 6.55 (60–86) | <0.001a |
| MAP | Mean ± SD (Min-Maks) | 121.05 ± 13.42 (100–150) | 80.31 ± 6.31 (70–98) | <0.001b |
| Cortisol | Mean ± SD (Min-Maks) | 47.20 ± 37.94 (10.39–162.56) | 24.27 ± 14.62 (4.18–49.40) | 0.008b |
| ACE | Mean ± SD (Min-Maks) | 66.89 ± 49.18 (32.57–216.47) | 47.32 ± 16.99 (24.39–100.69) | 0.089b |
| VEGF | Mean ± SD (Min-Maks) | 699.56 ± 692.87 (185.05–3837.00) | 557.18 ± 334.32 (235.53–1404.51) | 0.226b |
Table 2.
Analysis gene FTO pada PE and normotension
| Model | Gene FTO | Normotension (n = 55) | PE (n = 55) | Chi2 | p-value | OR (95% CI) |
|---|---|---|---|---|---|---|
| Codominant | AA | 1 | 7 | 5.627 | 0.018* | 0.016 (0.012–0.922) |
| AT | 23 | 25 | 3.512 | 0.120 | 0.155 (0.018–1.361) | |
| TT | 31 | 23 | 0.919 | 0.338 | 0.683 (0.312–1.492) | |
| Dominant | AA/AT + TT | 1/54 | 7/48 | 4.853 | 0.028* | 0.127 (0.015–1.070) |
| Recessive | AA + AT/TT | 24/31 | 32/23 | 2.328 | 0.127 | 0.556 (0.261–1.185) |
| Alel A | 25 | 39 | 4.319 | 0.038* | 0.535 (0.296–0.969) | |
| Alel T | 85 | 76 |
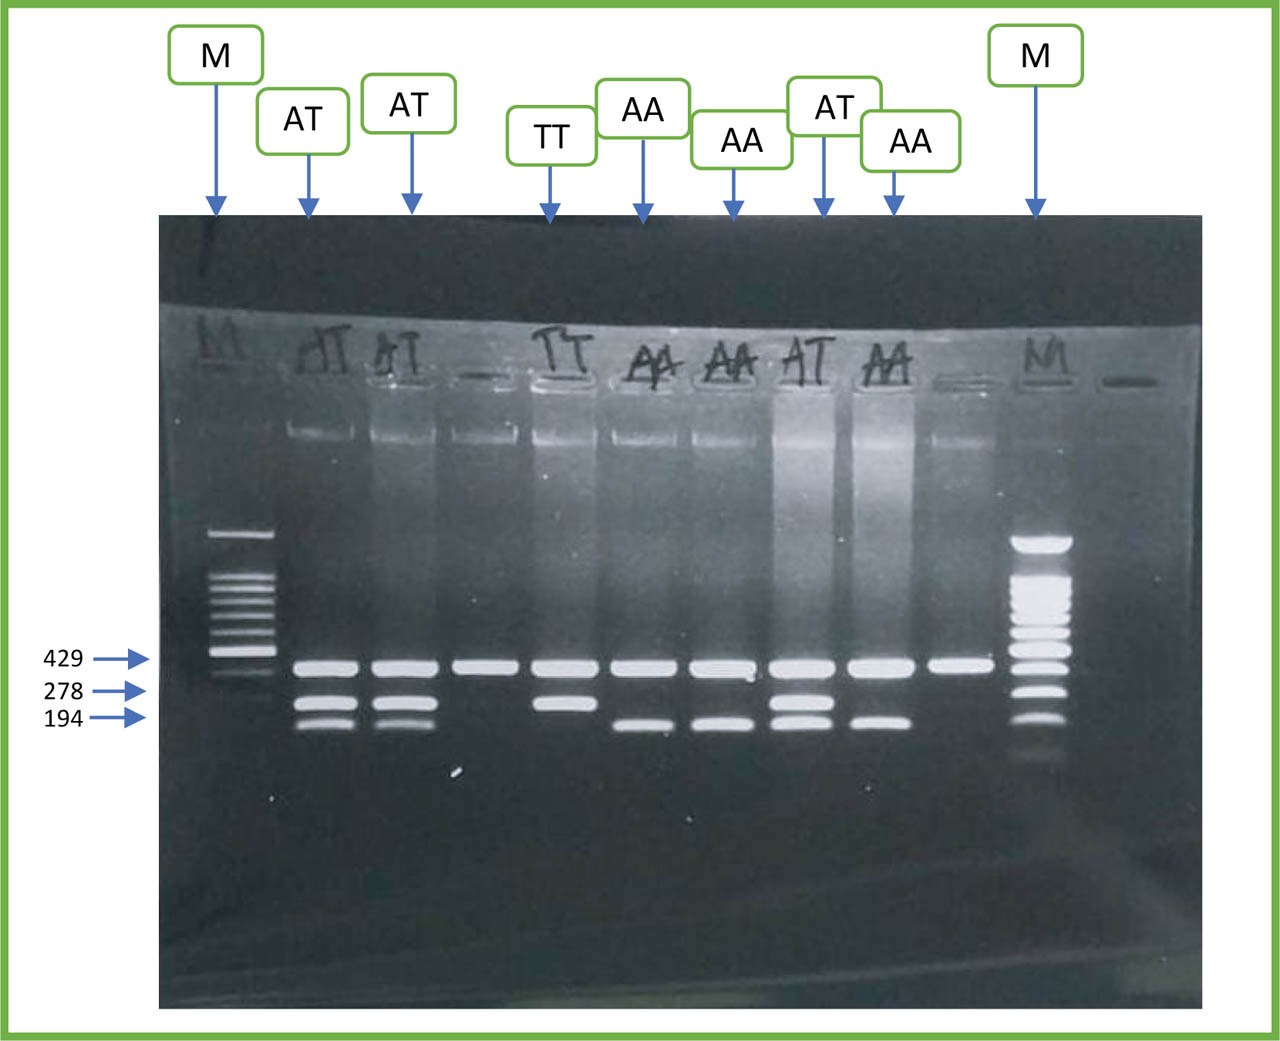
Figure 1.
Electrophoresis gene FTO rs9939609 genotypes. Marker (M) 1000 bp DNA ladder, 1 Pita NTC, 3 Pita AT genotype (uk 194, 278, and 429 bp), 2 Pita TT genotype (uk 278 and 429 bp), and 2 Pita AA genotype (uk 194 and 429 bp). NTC, non-template control.
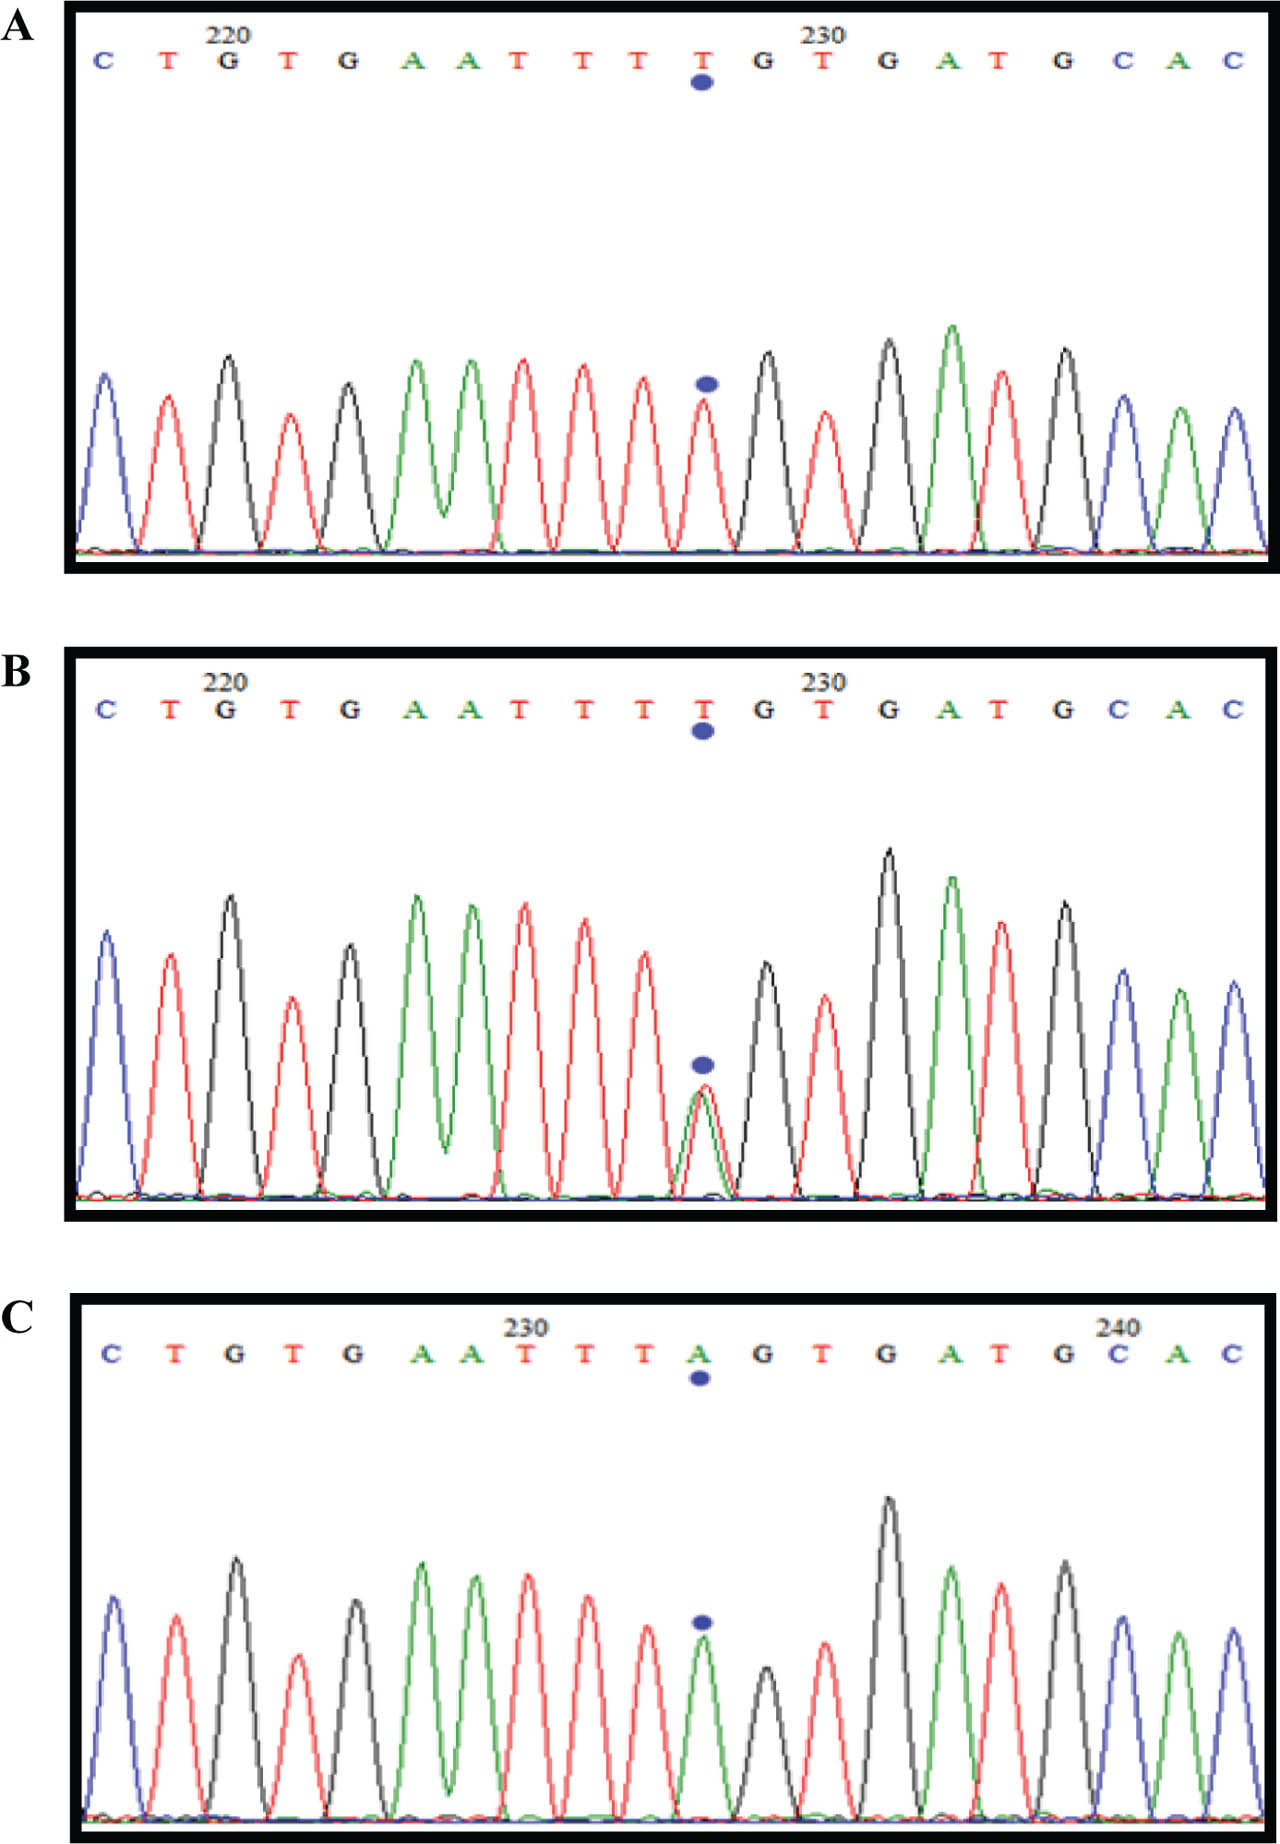
Figure 2.
Sequencing gene FTO rs9939609 polymorphism. (A) TT genotype; (B) AT genotype; (C) AA genotype.