
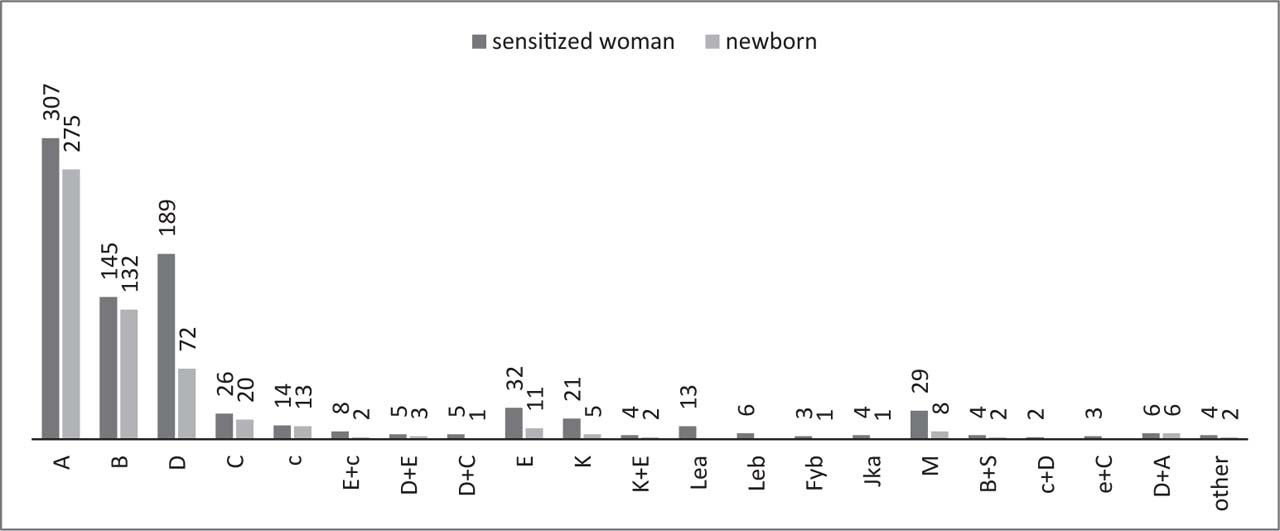
Graph 1.
Illustrates the number of pregnant women and newborns with HDN based on the type of sensitisation from 2000 to the end of 2024.
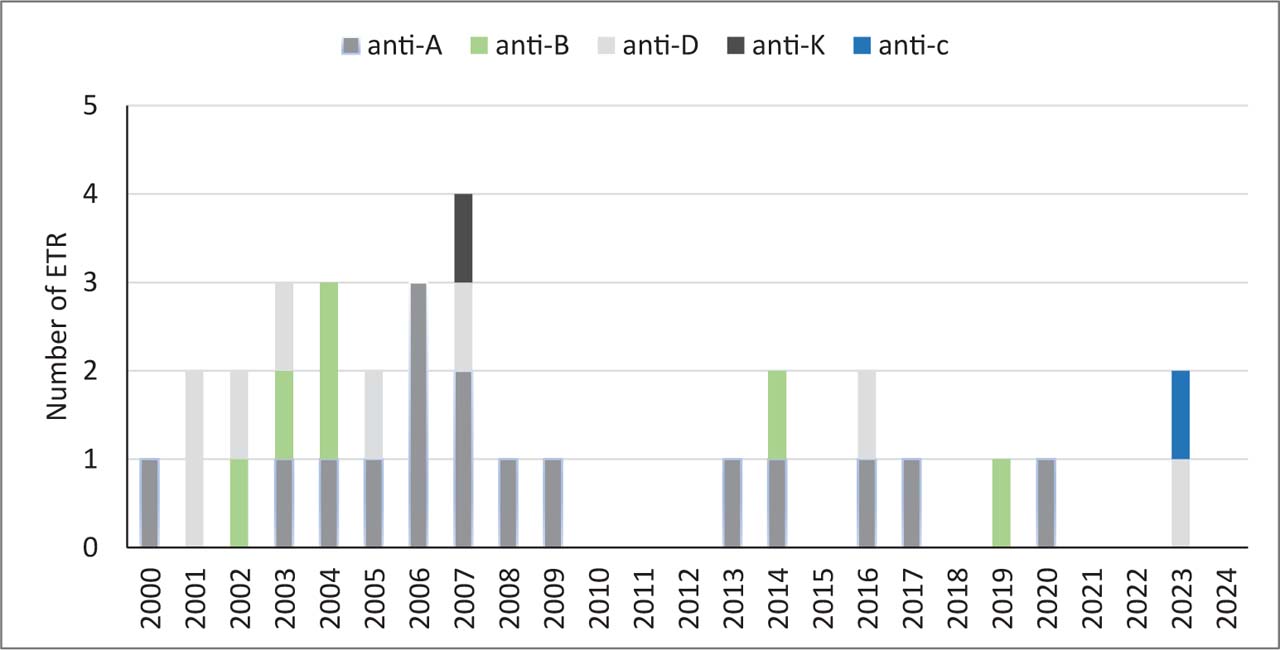
Graph 2.
Distribution of ET on HDN causes during the period from 2000 to the end of 2024.
Table 1.
Gestational age and mean concentration of individual laboratory parameters in newborns with HDN who underwent ET during the period from 2000 to the end of 2024.
| Antibodies | number | Gestational age (week) | Mean ± Standard deviation | % | |||
|---|---|---|---|---|---|---|---|
| <37 | 37+6/7-42 | Concentration of bilirubin (NV: 0–200 µmol/L) | Number of erythrocytes (NV: 3.9-5.5 × 10¹²/L) | Concentration of haemoglobin (NV: 136–199 g/L) | Reticulocyte | ||
| Anti-A | 16 | 1 | 15 | 386.4 ± 23.1 | 3.9 ± 0.5 | 127.9 ± 21.7 | 75 |
| Anti-B | 6 | 6 | 352.1 ± 5.2 | 4.6 ± 0.4 | 144.2 ± 4.8 | 35 | |
| Anti-D | 8 | 8 | 237.2 ± 13.9 | 3.9 ± 0.3 | 139.4 ± 3.4 | 47 | |
| Anti-K | 1 | 1 | 342 | 3.7 | 108 | 9 | |
| Anti-c | 1 | 1 | 300 | 1.8 | 73 | 8 | |