
Table 1.
Food and vegetable frequency per week.
| Variables | Control (n = 121) | Selective eating (n = 162) | P value |
|---|---|---|---|
| Demographic variables Age, years Male, % | 4.6 ± 1.0 59.5% | 4.6 ± 0.9 57.4% | 0.562 0.808 |
| FFQ | |||
| Rice | 12.7 ± 3.1 | 12.4 ± 3.1 | 0.403 |
| Bread | 5.1 ± 2.9 | 5.2 ± 2.6 | 0.887 |
| Noodle | 1.8 ±1.1 | 1.7 ± 1.5 | 0.963 |
| Fish | 2.6 ± 1.6 | 2.5 ± 2.0 | 0.677 |
| Meat | 5.5 ± 3.2 | 5.0 ± 2.7 | 0.158 |
| Eggs | 3.6 ± 2.3 | 3.2 ± 2.6 | 0.109 |
| Beans/tofu | 3.7 ± 2.6 | 3.1 ± 2.7 | 0.063 |
| Vegetable | 11.2 ± 3.9 | 9.0 ± 5.0 | <0.001* |
| Fruit | 5.5 ± 4.0 | 4.0 ± 3.2 | 0.001* |
| Dairy products | 8.1 ± 4.3 | 8.1 ± 4.3 | 0.931 |
| Tea | 12.9 ± 3.4 | 12.7 ± 3.0 | 0.682 |
| Sweetened beverage | 2.1 ± 2.3 | 3.5 ± 3.3 | <0.001* |
| Snack | 4.9 ± 2.9 | 5.3 ± 3.6 | 0.323 |
| Instant foods | 0.4 ± 0.5 | 0.5 ± 0.6 | 0.846 |
| Fast foods | 0.5 ± 0.4 | 0.7 ± 0.7 | 0.015* |
| Designated vegetables | |||
| Cabbage | 2.6 ± 1.9 | 1.7 ± 1.5 | <0.001* |
| Cucumber | 3.0 ± 2.4 | 2.2 ± 1.8 | 0.001* |
| Taro | 0.7 ± 0.7 | 0.3 ± 0.5 | <0.001* |
| Daikon radish | 1.8 ± 1.5 | 1.3 ± 1.4 | 0.002* |
| Tomato | 3.9 ± 3.3 | 2.2 ± 2.5 | <0.001* |
| Eggplant | 1.4 ± 1.4 | 0.8 ± 1.1 | <0.001* |
| Carrot | 4.4 ± 2.7 | 3.8 ± 2.6 | 0.033* |
| Green onion | 1.9 ± 1.7 | 1.1 ± 1.4 | <0.001* |
| Chinese cabbage | 1.6 ± 1.6 | 1.0 ± 1.2 | <0.0001* |
| Green pepper | 1.5 ± 1.3 | 0.9 ± 1.2 | <0.001* |
| Lettuce | 1.9 ± 2.2 | 1.0 ± 1.4 | <0.001* |
| Onion | 4.7 ± 2.7 | 3.6 ± 2.5 | 0.001* |
| Potato | 3.1 ± 2.1 | 2.2 ± 1.7 | <0.001* |
| Spinach | 2.3 ± 1.6 | 1.6 ± 1.6 | <0.001* |
| Broccoli. | 3.0 ± 2.0 | 2.1 ± 2.0 | <0.001* |
Table 2.
Comparison of machine learning algorithms for predicting selective eating in preschool children using food frequency data (5-fold cross-validation).
| Model | ROC-AUC | Accuracy | Precision | Recall | F1 Score |
|---|---|---|---|---|---|
| Random Forest | 0.522 | 0.527 | 0.581 | 0.611 | 0.592 |
| SVM | 0.543 | 0.559 | 0.599 | 0.722 | 0.645 |
| Naïve Bayes | 0.619 | 0.578 | 0.673 | 0.553 | 0.578 |
| Neural Network | 0.553 | 0.535 | 0.584 | 0.614 | 0.558 |
| k-NN | 0.519 | 0.527 | 0.583 | 0.597 | 0.585 |
| XGBoost | 0.511 | 0.520 | 0.575 | 0.604 | 0.585 |
| XGBoost (limited depth) | 0.521 | 0.523 | 0.577 | 0.612 | 0.590 |
| SGDClassifier | 0.544 | 0.537 | 0.595 | 0.612 | 0.585 |
| L1 LogisticRegression | 0.618 | 0.585 | 0.622 | 0.731 | 0.663 |
| Logistic Regression | 0.615 | 0.582 | 0.621 | 0.718 | 0.658 |
| LightGBM | 0.514 | 0.527 | 0.575 | 0.650 | 0.605 |
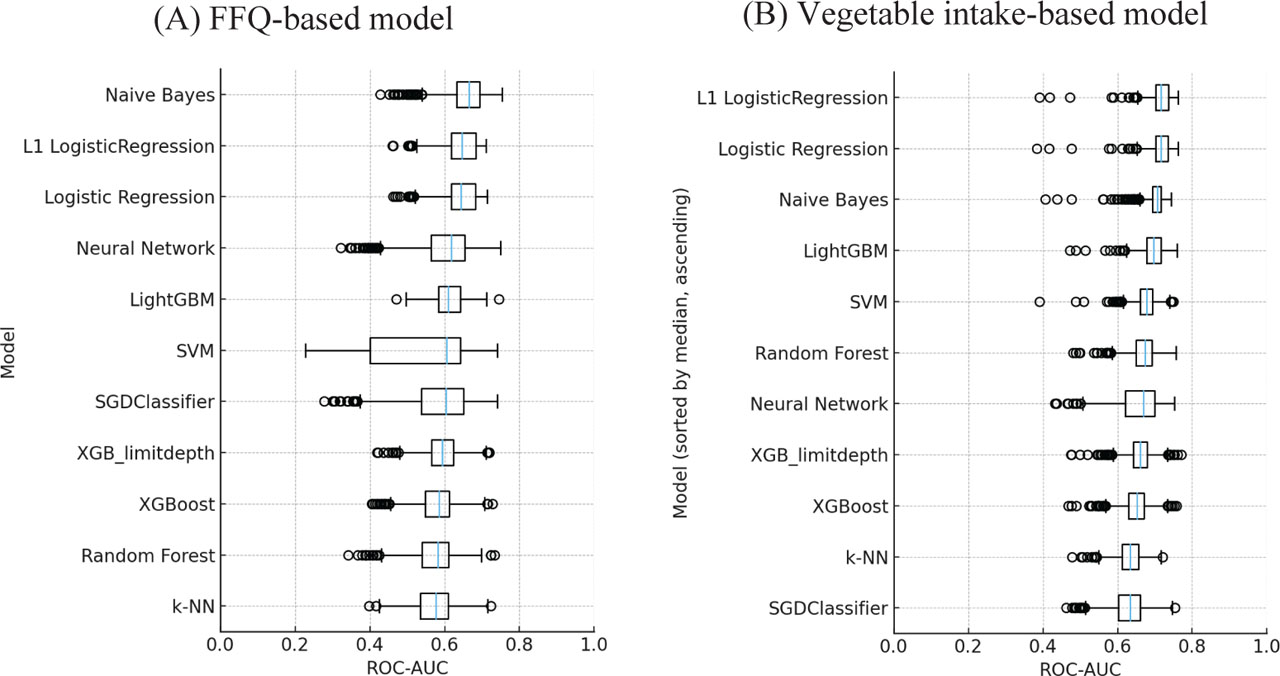
Figure 1.
Distribution of ROC–AUC values by machine-learning model.
Note: Each box represents the interquartile range (IQR) of ROC–AUC values across all configurations for each model, with horizontal lines indicating the median and whiskers extending to 1.5× IQR. The horizontal axis shows ROC–AUC (0–1), and models are arranged from lowest to highest median AUC. Naive Bayes and Neural Network achieved the highest central performance, whereas Random Forest and k-NN showed relatively lower discriminative ability.
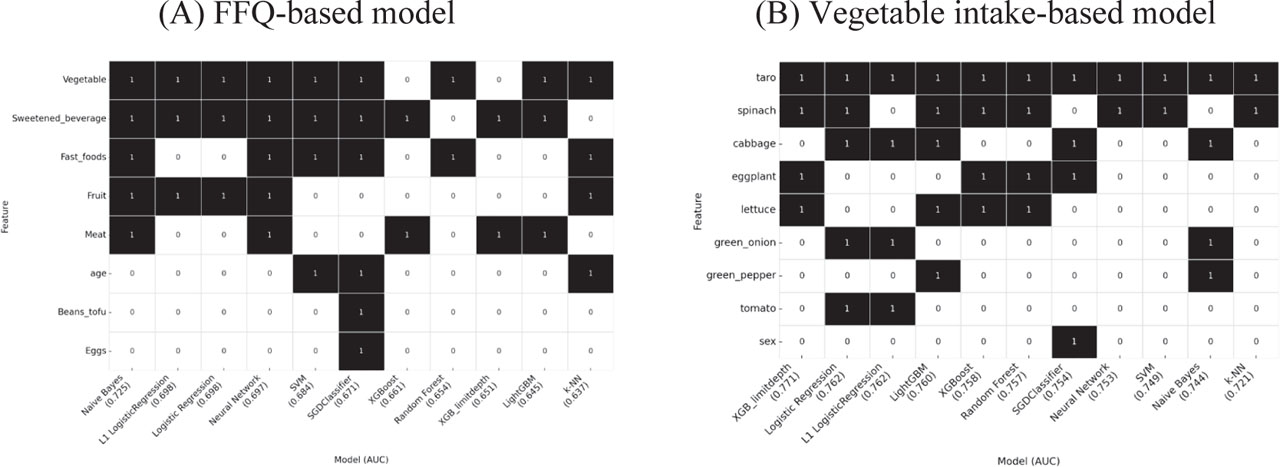
Figure 2.
Feature occurrence across best-performing models using (A) Food Frequency Questionnaire (FFQ) categories and (B) individual vegetable intake variables.
Note: Each cell indicates whether a given feature was selected as important (black = included; white = excluded) in the best-performing model for each algorithm. Vegetable and sweetened beverage intake frequently appeared among FFQ-based models, while taro, spinach, and green onion were consistently selected in vegetable-based models, indicating robust predictive value across algorithms.
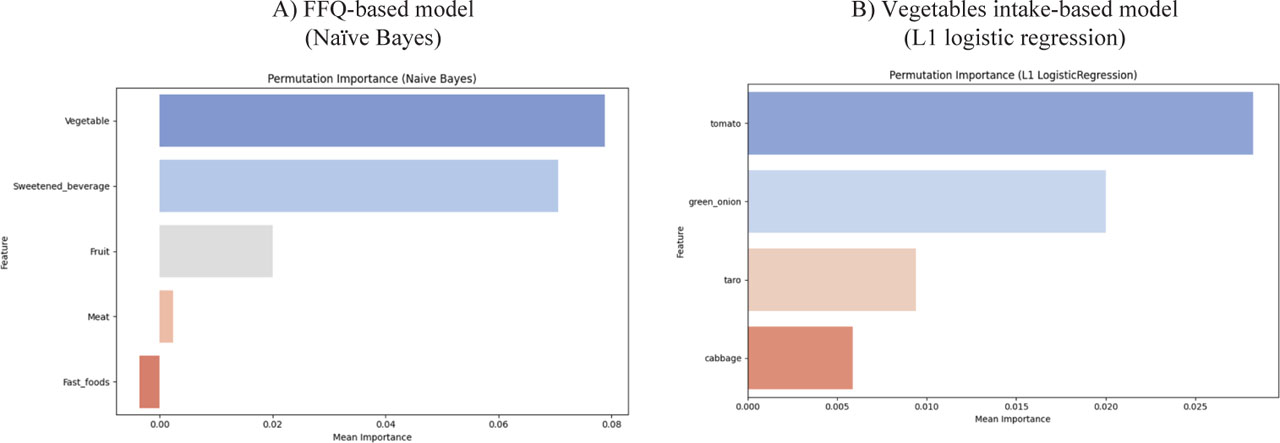
Figure 3.
Permutation importance in (A) FFQ-based model (Naïve Bayes) and (B) vegetable intake model (L1 logistic regression).
Note: Bars indicate the mean decrease in model performance when each variable was permuted, representing its relative contribution to prediction accuracy. In the FFQ-based model (A), vegetable and sweetened beverage intake were the most important, whereas in the vegetable intake-based model (B), tomato, green onion, and taro were key predictors.
Table 3.
Comparison of machine learning algorithms for predicting selective eating in preschool children using vegetable frequency data (5-fold cross-validation).
| Model | ROC-AUC | Accuracy | Precision | Recall | F1 Score |
|---|---|---|---|---|---|
| Random Forest | 0.668 | 0.624 | 0.673 | 0.674 | 0.681 |
| SVM | 0.676 | 0.623 | 0.691 | 0.653 | 0.747 |
| Naïve Bayes | 0.702 | 0.638 | 0.722 | 0.648 | 0.823 |
| Neural Network | 0.656 | 0.602 | 0.633 | 0.652 | 0.678 |
| k-NN | 0.633 | 0.603 | 0.657 | 0.653 | 0.673 |
| XGBoost | 0.649 | 0.612 | 0.659 | 0.664 | 0.663 |
| XGBoost (limited depth) | 0.660 | 0.614 | 0.662 | 0.666 | 0.667 |
| SGDClassifier | 0.630 | 0.595 | 0.638 | 0.647 | 0.661 |
| L1 LogisticRegression | 0.717 | 0.647 | 0.722 | 0.659 | 0.808 |
| Logistic Regression | 0.715 | 0.646 | 0.719 | 0.661 | 0.798 |
| LightGBM | 0.695 | 0.639 | 0.685 | 0.690 | 0.691 |