Figure 1.
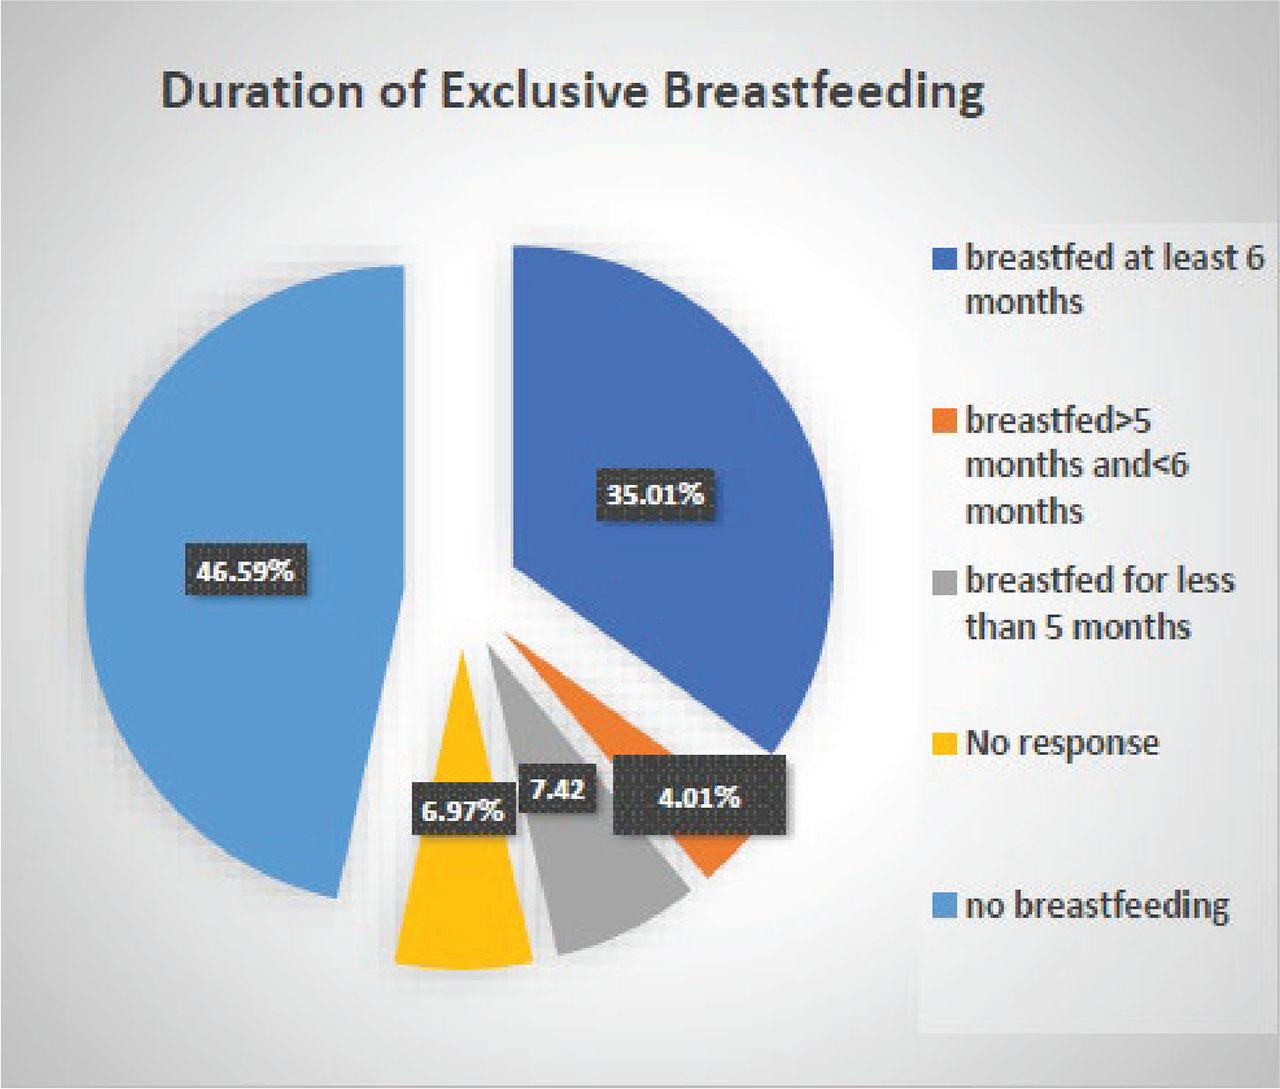
Figure 2.
Demographic and clinical characteristics of all participants_
| Data | Frequency | Percentage |
|---|---|---|
| Gestational diabetes | N | % |
| Yes | 80 | 11.9 |
| No | 591 | 87.7 |
| Missing data | 3 | 0.4 |
| Smoking during pregnancy | ||
| Yes | 71 | 10.5 |
| No | 602 | 89.4 |
| Missing data | 1 | 0.1 |
| Alcohol consumption during pregnancy | ||
| Yes | 46 | 6.8 |
| No | 627 | 93.1 |
| Missing data | 1 | 0.1 |
| BMI | ||
| Underweight | 50 | 7.4 |
| Normal weight | 486 | 72.1 |
| Overweight | 85 | 12.6 |
| Obese | 47 | 7.0 |
| Missing data | 6 | 0.9 |
| Delivery | ||
| Normal delivery | 244 | 36.2 |
| Cesarean section | 404 | 59.94 |
| Vacuum extraction delivery | 26 | 3.86 |
| Administration of epidural anaesthesia | ||
| Yes | 561 | 83.2 |
| No | 99 | 14.7 |
| Missing data | 14 | 2.1 |
| Personal choice: administration of epidural anaesthesia | ||
| Yes | 291 | 51.9 |
| No | 24 | 4.3 |
| Missing data | 246 | 43.9 |
| Breastfeeding the first hour after delivery | ||
| Yes | 629 | 93.3 |
| No | 44 | 6.5 |
| Missing data | 1 | 0.1 |
| Breastfeeding | ||
| Yes | 650 | 96.54 |
| No | 24 | 3.56 |
| Missing data | 0 | |
| Duration of exclusive breastfeeding | ||
| Exclusive breastfeeding at least 6 months | 236 | 35.01 |
| Exclusive breastfeeding > 5 months and < 6 months | 27 | 4.01 |
| Exclusive breastfeeding < 5 months | 50 | 7.42 |
| No breastfeeding | 314 | 46. 59 |
| Missing data | 47 | 6.97 |
| Exclusive breastfeeding at least 6 months: women who continued breastfeeding | ||
| for 1 year | 106 | 44.91 |
| for 2 years | 22 | 9.32 |
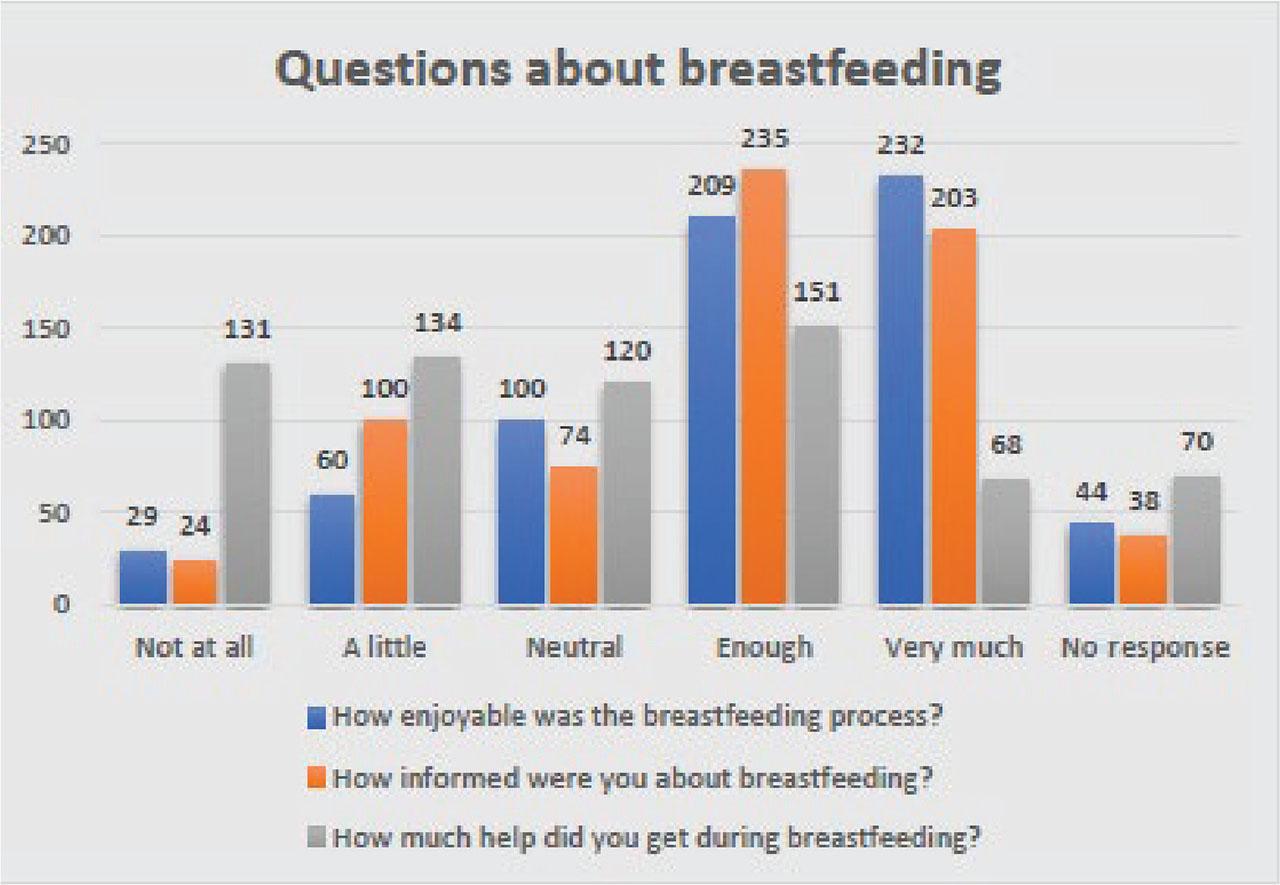
| Questions about breastfeeding and milk sufficiency Has anyone told you that you don't have enough milk? | ||
| Yes | 135 | 20.3 |
| No | 529 | 78.49 |
| No response | 10 | 1.48 |
| Did anyone tell you that your milk is too thin? | ||
| Yes | 62 | 9.20 |
| No | 600 | 89.02 |
| No response | 12 | 1.78 |
| Has anyone told you that your nipples are not good? | ||
| Yes | 91 | 13.5 |
| No | 571 | 84.72 |
| No response | 12 | 1.78 |
Multiple linear model of breastfeeding duration prediction_
| Model | Nonstandardized Coefficients | Standardized Coefficients | t | Sig. | Collinearity Statistics | ||
|---|---|---|---|---|---|---|---|
| B | Std. Error | Beta | Tolerance | VIF | |||
| (Constant) | −.774 | 4.310 | −.180 | .858 | |||
| Exclusive breastfeeding (YES = 1, 2 = NO) | −7.004 | .910 | −.363 | −7.695 | .000 | .936 | 1.068 |
| Degree of pleasure from breastfeeding | 1.898 | .407 | .223 | 4.666 | .000 | .913 | 1.095 |
| Smoking (YES = 1, 2 = NO) | 4.127 | 1.498 | .126 | 2.755 | .006 | .993 | 1.007 |
| Overweight mother now (versus underweight) | 4.355 | 1.375 | .155 | 3.166 | .002 | .873 | 1.146 |
| Normal maternal weight now vs. underweight | 1.951 | .928 | .103 | 2.103 | .036 | .868 | 1.152 |
| Gestational diabetes (YES = 1, 2 = NO) | 2.644 | 1.303 | .093 | 2.030 | .043 | .997 | 1.003 |