
Figure 1.
Figure 2.
Figure 3.
Figure 4.
Figure 5.
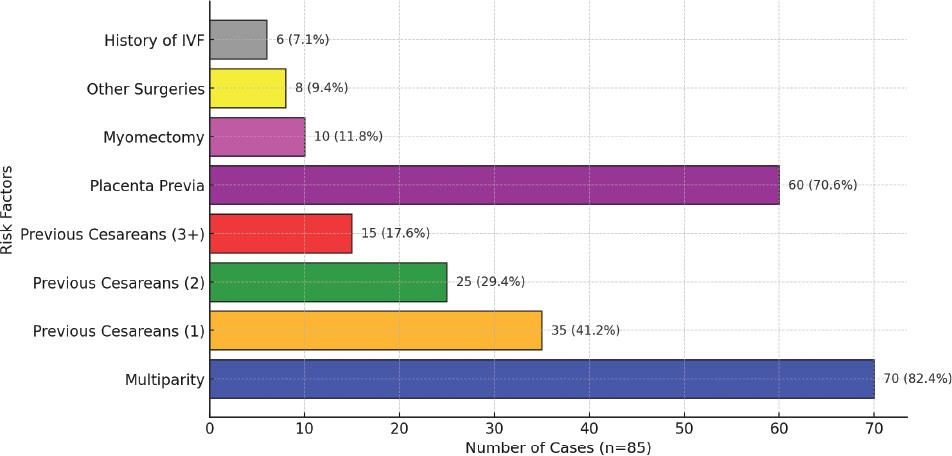
Figure 6.
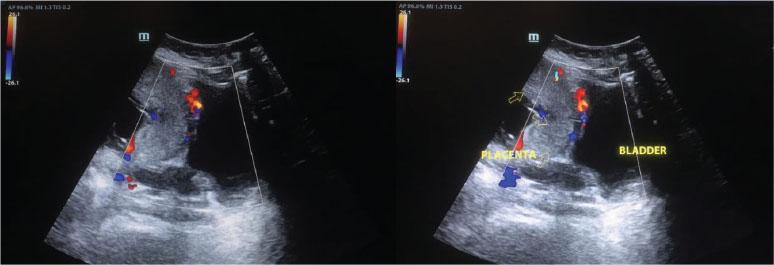
Figure 7.
The table provides a detailed comparison of incidence rates, key risk factors and clinical outcomes between PAS and non-PAS cases
| S. No. | Category | Parameter | No. of PAS Cases | No. of PAS Cases (%) | No. of Non-PAS Cases | No. of Non-PAS Cases (%) | P-Value |
|---|---|---|---|---|---|---|---|
| 1. | Total cases | 9088 | 85 | 0.93% | 9003 | 0.53 | |
| 2. | Clinical presentation | Antenatal bleeding | 35 | 41.2% | 3707 | 41.1% | 0.06 |
| Postpartum haemorrhage | 15 | 17.6% | 1482 | 16.46% | 0.1 | ||
| Hypertension | 2 | 2.4% | 211 | 2.3% | 0.3 | ||
| Preterm labor | 4 | 4.7% | 317 | 3.5% | 0.25 | ||
| 3. | Risk factors | Multiparity | 70 | 82.4% | 5000 | 55.5% | 0.0001 |
| Previous caesarean sections | |||||||
| 1 Previous | 35 | 41.2% | 3500 | 38.9% | 0.05 | ||
| 2 Previous | 25 | 29.4% | 2000 | 22.2% | 0.0001 | ||
| 3 + Previous | 15 | 17.6% | 800 | 8.9% | 0.002 | ||
| Placenta praevia | 60 | 70.6% | 2000 | 22.2% | 0.002 | ||
| 4. | History of uterine Surgeries | Myomectomy | 10 | 11.8% | 500 | 5.6% | 0.005 |
| Other surgeries | 8 | 9.4% | 400 | 4.4% | 0.03 | ||
| 5. | History of IVF | Present | 6 | 7.1% | 200 | 2.2% | 0.05 |
| 6. | Ultrasound & doppler findings | Loss of retroplacental Zone | 50 | 58.8% | 1500 | 16.7% | 0.001 |
| Placental lacunae | 40 | 47.1% | 1200 | 13.3% | 0.002 | ||
| Hypervascularity on Doppler | 55 | 64.7% | 1800 | 20.0% | 0.0005 | ||
| 7. | Maternal Outcomes | ≥ 4 Units transfused | 30 | 35.3% | 3000 | 33.3% | 0.2 |
| Hysterectomy required | 40 | 47.1% | 50 | 0.6% | 0.0001 | ||
| ICU admission | 8 | 9.4% | 741 | 8.2% | 0.3 | ||
| Mortality | 1 | 1.2% | 105 | 1.16% | 0.5 | ||
| 8. | Neonatal Outcomes | Preterm Birth (< 37 weeks) | 60 | 70.6% | 4000 | 44.4% | 0.0008 |
| NICU Admission | 50 | 58.8% | 3500 | 38.9% | 0.0015 |