
Figure 1.
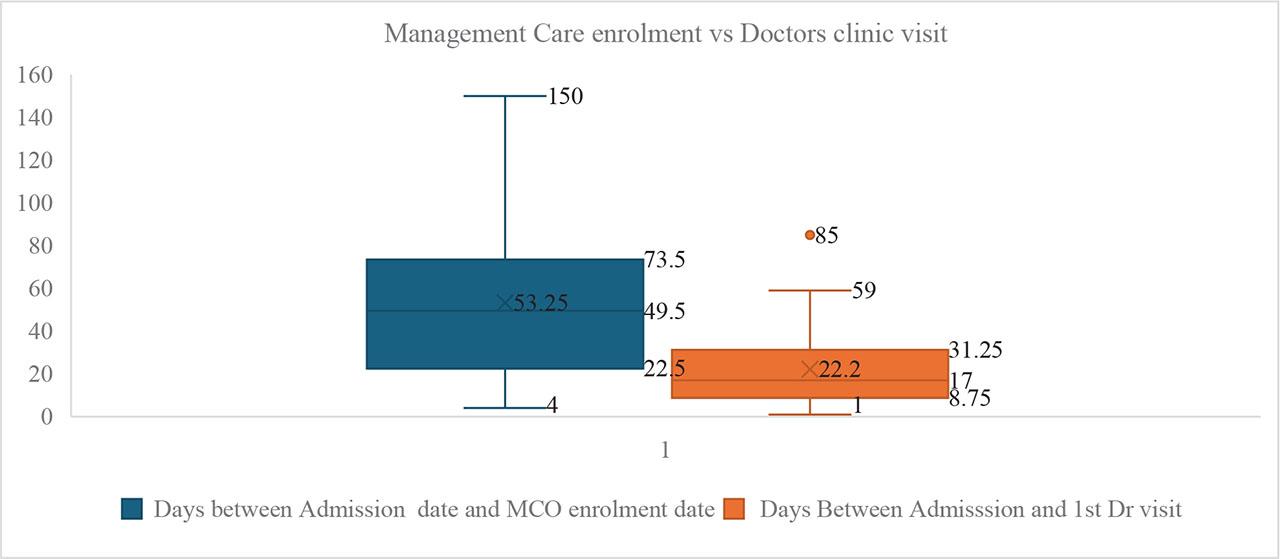
Figure 2.
Figure 3.
Race distribution of pregnant clients
| Race | Count | % Frequency |
|---|---|---|
| African-American | 30 | 50% |
| Hispanic | 23 | 38% |
| White | 7 | 12% |
| Grand Total | 60 | 100% |
Maternal age of enrolled clients
| Age Group | Count | % Frequency |
|---|---|---|
| 13–19 (Teenage) | 24 | 40% |
| 20–26 (Young adults) | 28 | 47% |
| 27–33 | 5 | 8% |
| 35–40 (Geriatric) | 3 | 5% |
| Grand Total | 60 | 100% |
Gestation weeks at admission
| Trimester | Count | % Frequency |
|---|---|---|
| First trimester (1–12 weeks) | 18 | 30% |
| Second trimester (13–26 weeks) | 29 | 48% |
| Third trimester (27–40 weeks) | 13 | 22% |
| Grand Total | 60 | 100% |
Identified pregnancy-associated risks
| Medicaid Risk | Count | % Frequency |
|---|---|---|
| No Medicaid | 32 | 53% |
| Wrong Medicaid | 27 | 45% |
| Correct Medicaid | 1 | 2% |
| Grand total | 60 | 100% |
TRisk Distribution among Races
| Race | Medicaid Risk | Medical Complication Risk | Gestational age Risk | Prenatal Registration Risk |
|---|---|---|---|---|
| African American | 30(51%) | 10(53%) | 3(30%) | 15(45%) |
| Hispanic | 22(37%) | 6(32%) | 5(50%) | 17(52%) |
| White | 7(12%) | 3(16%) | 2(20%) | 1(3%) |
| Grand Total | 59(100%) | 19(100%) | 10(100%) | 33(100%) |