
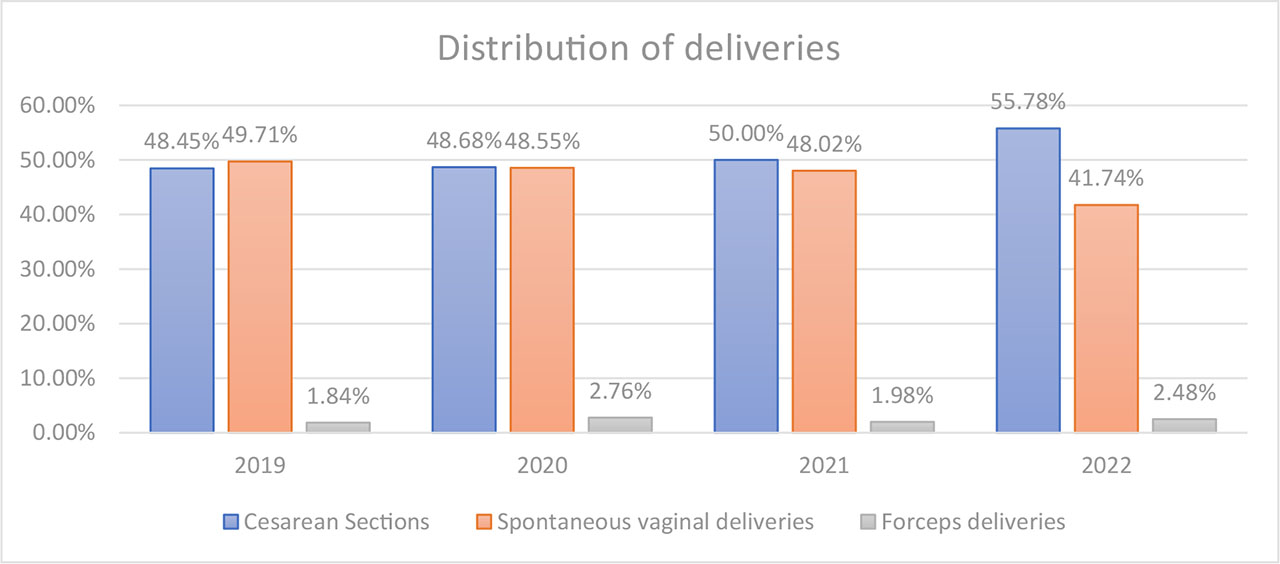
Graph 1.
Distribution of deliveries in Department of Perinatology Medical University of Lodz.

Graph 2.
Parity status of patients.
Table 1.
Comorbidities in analysed group.
| Comorbidity | Number of patients (n) | Percent (%) |
|---|---|---|
| Overweight (BMI = 25,0–29,9) | 80 | 54.4% |
| Obesity (BMI ≥ 30) | 36 | 24.5% |
| Diabetes | 21 | 14.3% |
| Hypertension | 21 | 14.3% |
Table 2.
Maternal complications after forceps delivery.
| Maternal compications | Number of patients (n) | Percentage (%) |
|---|---|---|
| Vaginal laceration | 59 | 40.1% |
| Cervical laceration | 24 | 16.3% |
| Postpartum haemorrhage | 21 | 14.3% |
| Additional perineal tear | 4 | 2.7% |
| Vulvovaginal haematoma | 2 | 1.4% |
| Pubic symphysis separation | 2 | 1.4% |