
Figure 1.
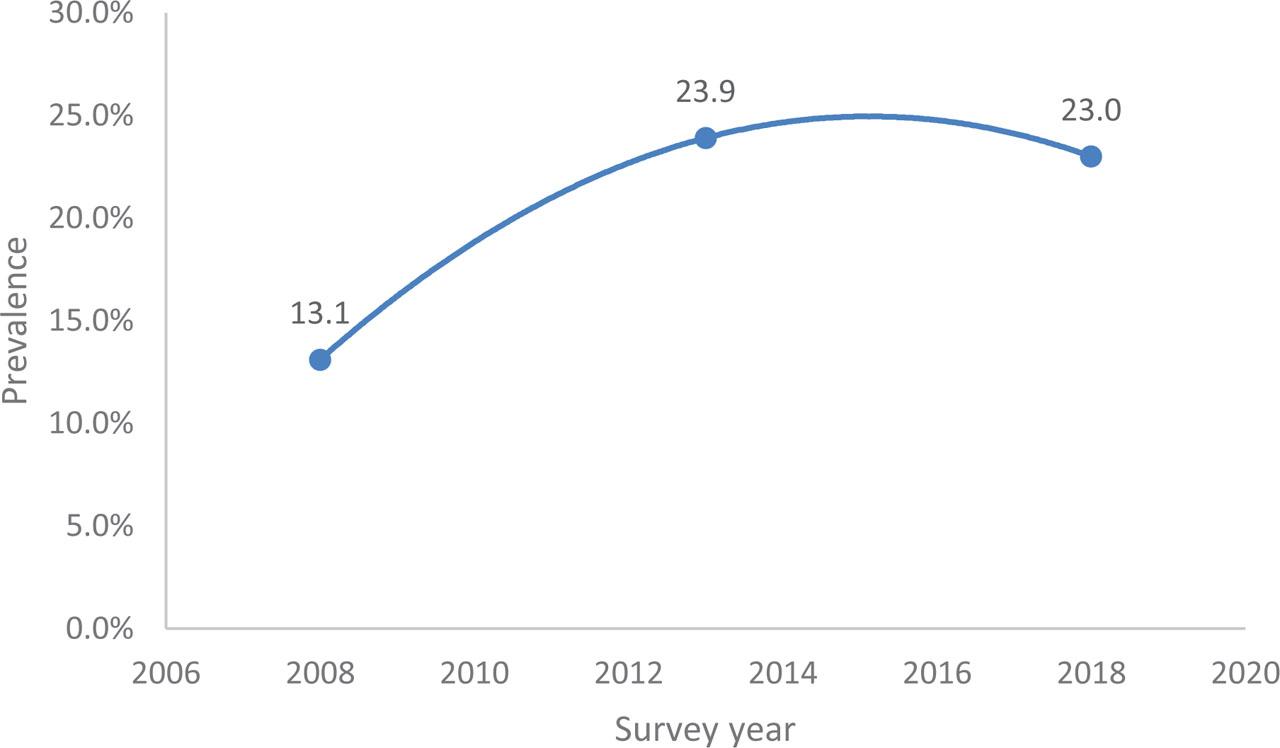
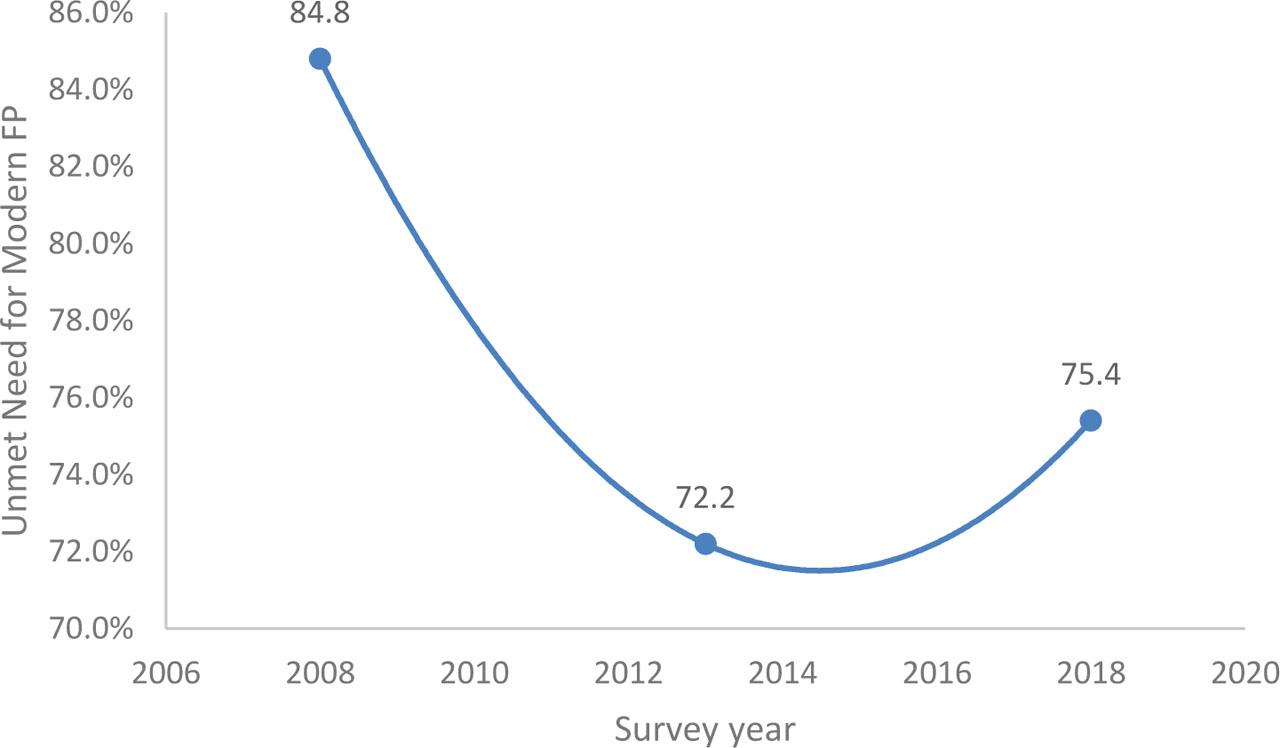
Figure 2.
Socio-demographic characteristics of weighted sample population (NDHS 2008–2018)
| 2008 | 2013 | 2018 | Pooled 2008–2018 | |
|---|---|---|---|---|
| n (%) | n (%) | n (%) | n (%) | |
| Women age | ||||
| 15–19 | 124 (22.3%) | 71 (21.7%) | 82 (17.5%) | 278 (20.5%) |
| 20–24 | 85 (15.3%) | 49 (15.0%) | 67 (14.1%) | 201 (14.8%) |
| 25–29 | 106 (19.1%) | 56 (17.1%) | 73 (15.4%) | 235 (17.3%) |
| 30–34 | 82 (14.7%) | 44 (13.5%) | 63 (13.3%) | 189 (13.9%) |
| 35–39 | 64 (11.5%) | 36 (11.0%) | 60 (12.6%) | 160 (11.8%) |
| 40–44 | 43 (7.7%) | 37 (11.3%) | 60 (12.6%) | 140 (10.3%) |
| 45–49 | 52 (9.4%) | 34 (10.4%) | 69 (14.5%) | 155 (11.4%) |
| Mean (±SD) | 28.5 ± 9.6 | 29.3 ± 10.2 | 31.1 ± 10.3 | 29.6 ± 10.1 |
| Place of residence | ||||
| Urban | 220 (39.6%) | 262 (80.1%) | 386 (81.3%) | 868 (63.9%) |
| Rural | 336 (60.4%) | 65 (19.9%) | 89 (18.7%) | 490 (36.1%) |
| Level of education | ||||
| No education | 42 (7.6%) | 7 (2.1%) | 24 (5.1%) | 73 (5.4%) |
| Primary | 96 (17.3%) | 42 (12.8%) | 70 (14.7%) | 208 (15.3%) |
| Secondary | 307 (55.2%) | 195 (59.6%) | 284 (59.8%) | 786 (57.9%) |
| Higher | 111 (20.0%) | 83 (25.4%) | 97 (20.4%) | 291 (21.4%) |
| Marital status | ||||
| Never married | 209 (37.6%) | 119 (36.5%) | 123 (25.9%) | 451 (33.3%) |
| Married/Living with partner | 333 (59.9%) | 194 (59.5%) | 326 (68.8%) | 853 (62.9%) |
| Formerly married | 14 (2.5%) | 13 (4.0%) | 25 (5.3%) | 52 (3.8%) |
| Religion | ||||
| Christianity | 459 (82.6%) | 300 (91.7%) | 365 (76.8%) | 1124 (82.8%) |
| Islam | 97 (17.4%) | 27 (8.3%) | 110 (23.2%) | 234 (17.2%) |
| Occupational status | ||||
| Working | 309 (56.0%) | 204 (62.4%) | 362 (76.45) | 875 (64.7%) |
| Not working | 243 (44.0%) | 123 (37.6%) | 112 (23.6%) | 478 (35.3%) |
| Wealth index | ||||
| Poor | 119 (21.4%) | 4 (1.2%) | 111 (23.3%) | 234 (17.2%) |
| Middle | 130 (23.4%) | 55 (16.8%) | 111 (23.3%) | 296 (21.8%) |
| Rich | 307 (55.2%) | 268 (82.0%) | 254 (53.4%) | 829 (61.0%) |
| Covered by health insurance | ||||
| Yes | 10 (1.8%) | 9 (2.8%) | 8 (1.7%) | 27 (2.0%) |
| No | 544 (98.2%) | 317 (97.2%) | 466 (98.3%) | 1327 (98.0%) |
| Distance to health facility | ||||
| Big problem | 112 (20.2%) | 35 (10.7%) | 95 (20.0%) | 242 (17.9%) |
| Not a big problem | 442 (79.8%) | 291 (89.3%) | 380 (80.0%) | 1113 (82.1%) |
| FP services available at the facility | ||||
| Yes | 91 (59.1%) | 58 (64.4%) | 134 (58.3%) | 283 (59.7%) |
| No | 63 (40.9%) | 32 (35.6%) | 96 (41.7%) | 1919 (40.3%) |
| Desire for more children | ||||
| More children | 382 (68.8%) | 213 (65.1%) | 273 (57.5%) | 868 (64.0%) |
| Undecided | 34 (6.1%) | 16 (4.9%) | 22 (4.6%) | 72 (5.3%) |
| No more children | 139 (25.0%) | 98 (30.0%) | 180 (37.9%) | 417 (30.7%) |
| Woman's autonomy in decision making for family planning | ||||
| Respondent alone | 97 (29.2%) | 55 (28.4%) | 60 (18.4%) | 212 (24.9%) |
| Respondent and husband/partner | 156 (47.0%) | 85 (43.8%) | 218 (66.9%) | 459 (53.9%) |
| Husband/partner alone | 79 (23.8%) | 54 (27.8%) | 48 (14.7%) | 181 (21.2%) |
| Contraceptives Use | ||||
| Modern method | 73 (13.1%) | 78 (23.9%) | 109 (23.0%) | 260 (19.2%) |
| Non modern method | 483 (86.9%) | 248 (76.1%) | 365 (77.0%) | 1096 (80.8%) |
Bivariate and multivariate analyses of non-modern contraceptive use among women of reproductive age (15–49) in Ekiti State (NDHS 2008–2018) (Weighted sample)
| Variables | Types of Contraceptives | Bivariate Analysis (chi-square test) | Binary Logistic Regression | |
|---|---|---|---|---|
| Non-modern (%) | Modern (%) | P value | AOR (95%CI) | |
| Women age | 0.001* | |||
| 15–19 | 254 (91.4%) | 24 (8.6%) | 1 | |
| 20–24 | 157 (78.5%) | 43 (21.5%) | 0.33 (0.19–0.59)* | |
| 25–29 | 183 (77.9%) | 52 (22.1%) | 0.34 (0.18–0.64)* | |
| 30–34 | 155 (82.0%) | 34 (18.0%) | 0.46 (0.22–0.94)* | |
| 35–39 | 116 (72.5%) | 44 (27.5%) | 0.29 (0.14–0.61)* | |
| 40–44 | 104 (73.8%) | 37 (26.2%) | 0.37 (0.17–0.80)* | |
| 45–49 | 128 (83.1%) | 26 (16.9%) | 0.62 (0.27–1.44) | |
| Place of residence | 0.003* | |||
| Urban | 681 (78.5%) | 187 (21.5%) | 0.72 (0.53–0.98)* | |
| Rural | 416 (85.1%) | 73 (14.9%) | 1 | |
| Level of education | 0.017* | |||
| No education | 63 (86.3%) | 10 (13.7%) | 1 | |
| Primary | 173 (83.6%) | 34 (16.4%) | 0.77 (0.35–1.69) | |
| Secondary | 643 (81.8%) | 143 (18.2%) | 0.55 (0.26–1.15) | |
| Higher | 217 (74.6%) | 74 (25.4%) | 0.46 (0.21–0.98)* | |
| Marital status | 0.009* | |||
| Never married | 383 (84.9%) | 68 (15.1%) | 1 | |
| Married/Living with partner | 668 (78.3%) | 185 (21.7%) | 1.23 (0.79–1.92) | |
| Formerly married | 45 (86.5%) | 7 (13.5%) | 1.95 (0.77–4.90) | |
| Religion | 0.299 | |||
| Christianity | 902 (80.3%) | 221 (19.7%) | - | |
| Islam | 194 (83.3%) | 39 (16.7%) | - | |
| Occupational status | 0.789 | |||
| Working | 705 (64.5%) | 170 (65.4%) | - | |
| Not working | 388 (35.5%) | 90 (34.65) | - | |
| Wealth index | 0.010* | |||
| Poor | 200 (85.5%) | 34 (14.5%) | 1 | |
| Middle | 249 (84.4%) | 46 (15.6%) | 0.91 (0.56–1.50) | |
| Rich | 648 (78.3%) | 180 (21.7%) | 0.75 (0.48–1.17) | |
| Covered by health insurance | 0.060 | |||
| Yes | 1076 (81.1%) | 251 (18.9%) | - | |
| No | 18 (66.7%) | 9 (33.3%) | - | |
| Distance to health facility | 0.965 | |||
| Big problem | 195 (80.9%) | 46 (19.1%) | - | |
| Not a big problem | 900 (80.8%) | 214 (19.2%) | - | |
| FP services available at the facility | 0.229 | |||
| Yes | 232 (82.0%) | 51 (18.0%) | - | |
| No | 148 (77.5%) | 43 (22.5%) | - | |
| Desire for more children | 0.001* | |||
| More children | 728 (83.9%) | 140 (16.1%) | 1 | |
| Undecided | 60 (82.2%) | 13 (17.8%) | 0.87 (0.45–1.69) | |
| No more children | 309 (74.3%) | 107 (25.7%) | 0.48 (0.32–0.73)* | |
| Woman's autonomy in decision making for family planning | 0.803 | |||
| Respondent alone | 165 (77.8%) | 47 (22.2%) | - | |
| Respondent and husband/partner | 358 (77.8%) | 102 (22.2%) | - | |
| Husband/partner alone | 145 (80.1%) | 36 (19.9%) | - | |