
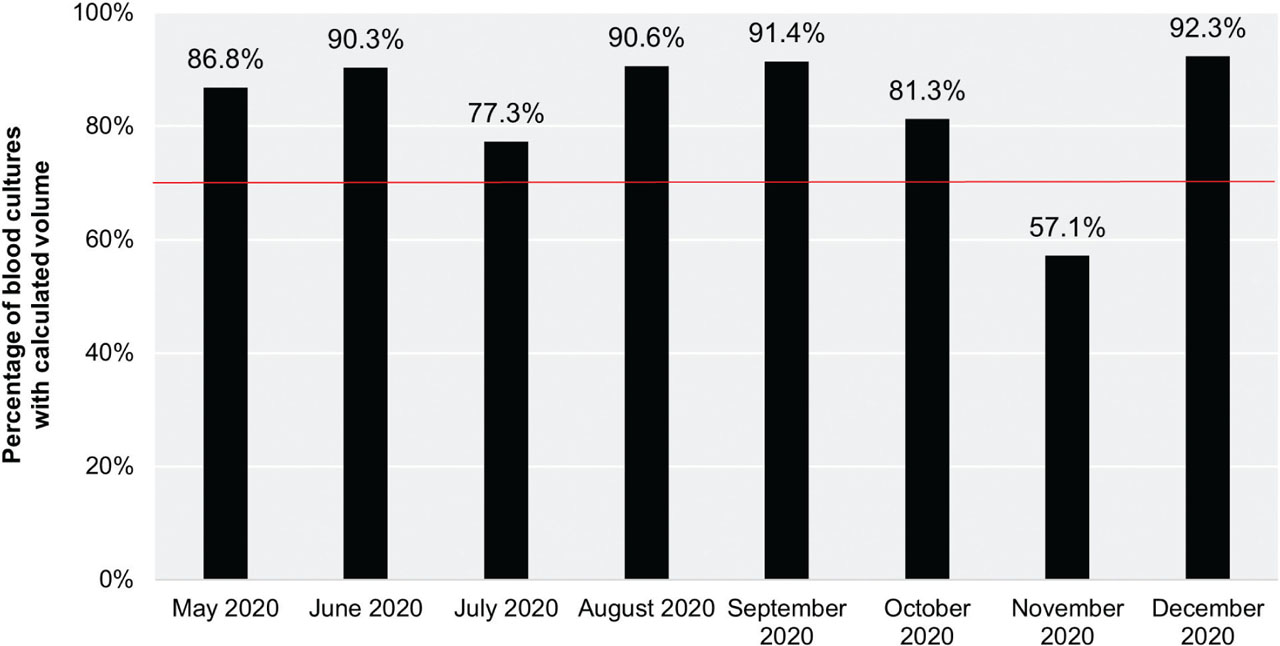
Figure 1.
Percentage of blood culture submissions with calculated volume by month. The horizontal line represents the pre-established criterion of 70% indicating the feasibility of the intervention.
Table 1.
Blood culture submissions characteristics
| n (%) | |
|---|---|
| Samples weighed | 205 (100.0) |
| Samples with volume estimation | 196 (95.6) |
| Birthweight | 205 |
| ≤ 1500 g | 53 (25.9) |
| 1501–2500 g | 90 (43.9) |
| > 2500 g | 62 (30.2) |
| Material source | 205 |
| Cord blood | 72 (35.1) |
| Umbilical catheter | 20 (9.8) |
| Peripheral vessel | 112 (54.6) |
| Not specified | 1 (0.5) |
| Positive blood cultures | 24 |
| True-positive blood cultures | 15 (62.5) |
| False-positive blood cultures | 9 (37.5) |
Table 2.
Comparison of blood volume measurement versus estimation
| Blood volume measurement [ml] | ||||
|---|---|---|---|---|
| < 1 ml | ≥ 1 ml | Total | ||
| Blood volume estimation [ml] | < 1 ml | 4 (2.0) | 1 (0.5) | 5 (2.6) |
| ≥ 1 ml | 22 (11.2) | 169 (86.2) | 191 (97.4) | |
| Total | 26 (13.3) | 170 (86.7) | 196 (100.0) | |
[i] Data presented as n (% of study group).
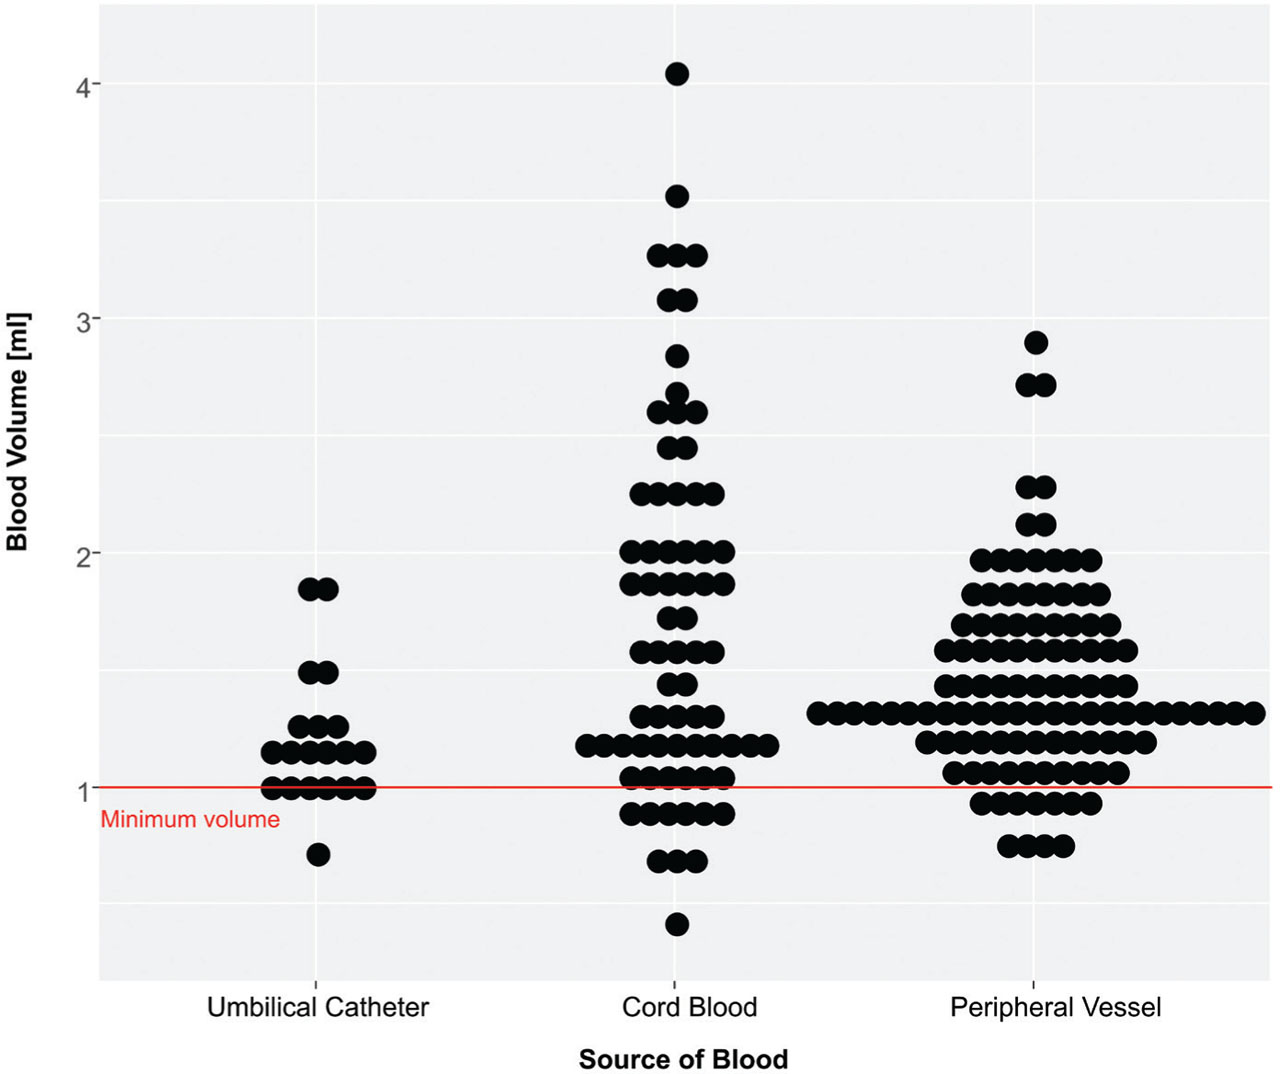
Figure 2.
Blood volume summary by source of the material. The horizontal line depicts the minimum blood volume recommended for culture.
Table 3.
Medical personnel opinion on difficulty of blood culture collection and necessity of blood sample measurement.
| Total group | Doctors | Nurses | p | |
|---|---|---|---|---|
| n | 36 | 14 | 22 | |
| Blood culture collection is: | ||||
| Easy | 11 (30.6) | 6 (42.9) | 5 (22.7) | 0.469 |
| Moderately difficult | 21 (58.3) | 7 (50.0) | 14 (63.6) | |
| Difficult | 4 (11.1) | 1 (7.1) | 3 (13.6) | |
| Don’t know | - | - | - | |
| Measurement of blood volume collected for culture is: | ||||
| Unnecessary | 2 (5.6) | - | 2 (9.1) | 0.244 |
| Necessary, but a substantial impediment | 3 (8.3) | 1 (7.1) | 2 (9.1) | |
| Necessary and not a substantial impediment | 27 (75.0) | 13 (92.9) | 14 (63.6) | |
| Don’t know | 4 (11.1) | - | 4 (18.2) | |
[i] Data presented as n (% of study group), groups compared with Fisher exact test.
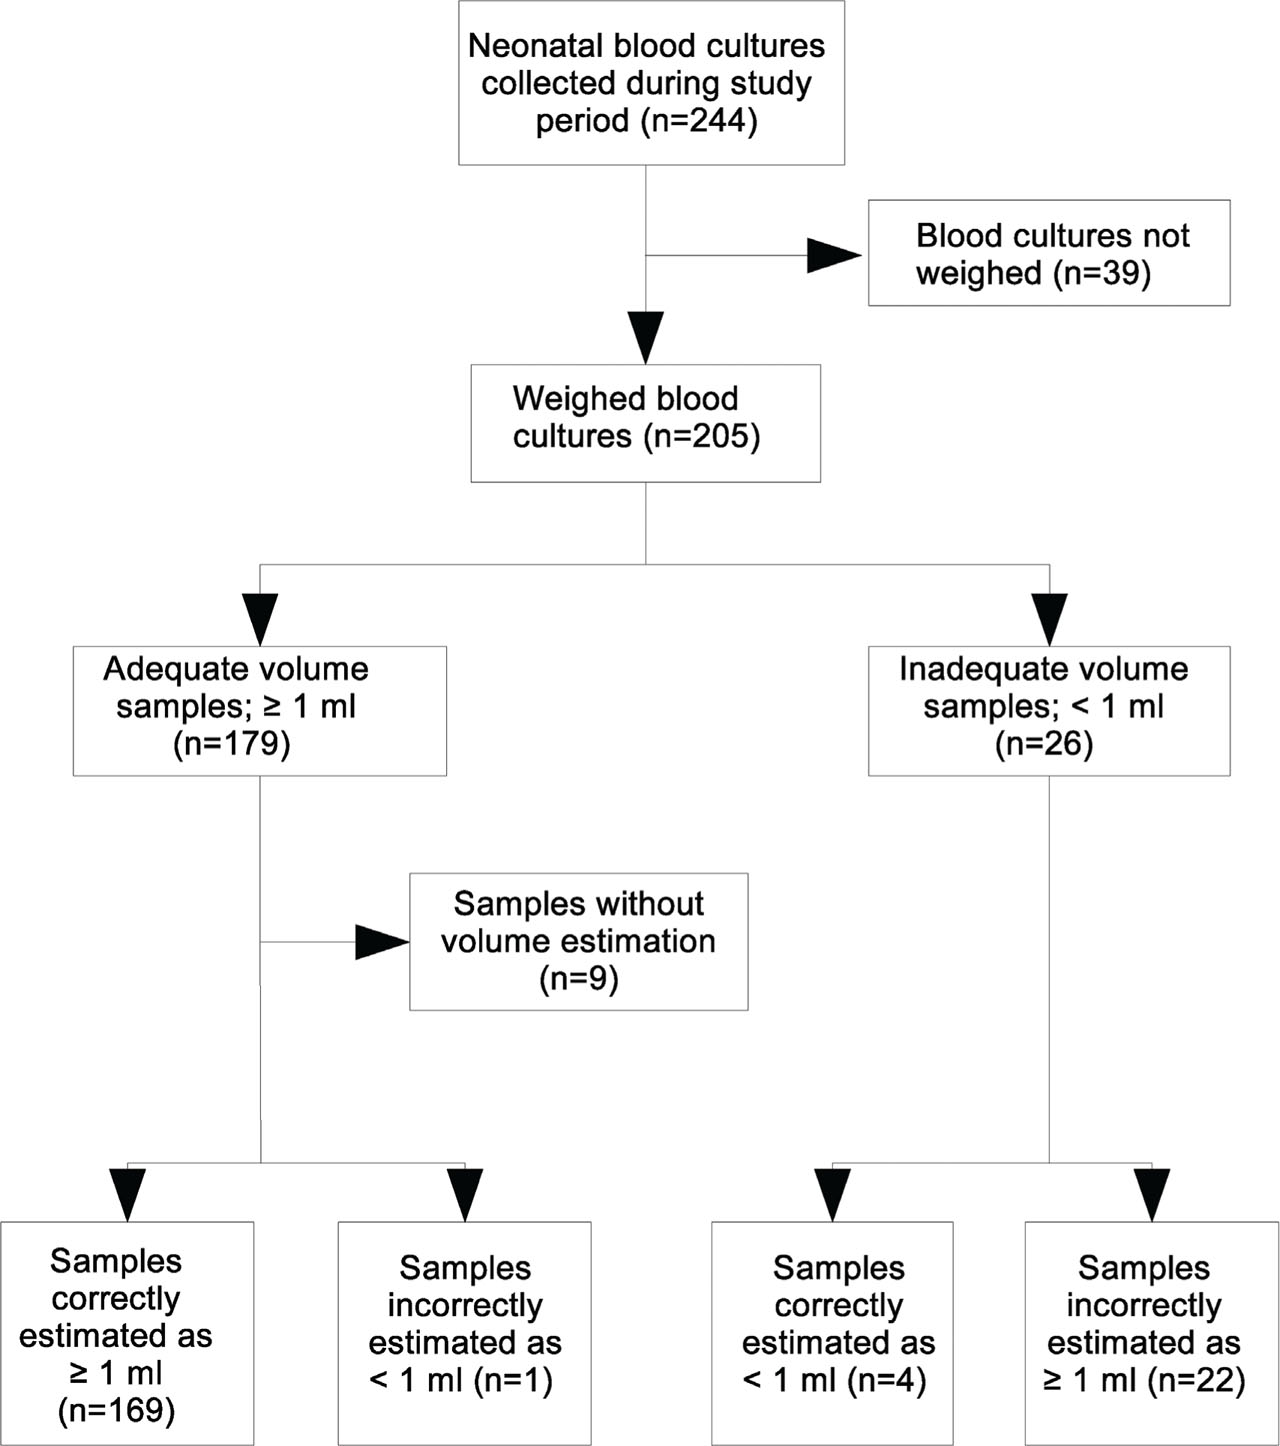
Figure S1.
Flow chart of included blood culture submissions throughout the study period.
Supplemental Table 1.
Volumes submitted for culture according to birthweight category
Supplemental Table 2.
Volumes submitted for culture according to source of the material
Supplemental Table 3.
Proportion of positivity with adequate and inadequate blood culture volume
| Positive blood cultures | Adequate volume cultures ≥ 1 ml | Inadequate volume cultures < 1 ml | p |
|---|---|---|---|
| True-positive | 13/179 = 7.26% | 2/26 = 7.69% | > 0.999 |
| False-positive | 8/179 = 4.47% | 1/26 = 3.85% | > 0.999 |
[i] Data presented as n (% of total); groups compared with Fisher exact test.