
Table 1
Comparison of anthropometric and blood pressure measurement data with division between three studied groups. DBP – diastolic blood pressure; HR – heart rate; SBP – systolic blood pressure.
| normal pregnancy | hypertensive disorders in pregnancy | p | gestational hypertension | chronic hypertension | p | |
|---|---|---|---|---|---|---|
| prepregnancy weight [kg] | 63.7 | 72.1 | <0.001 | 74 | 70 | 0.288 |
| prepregnancy body mass index [kg/m2] | 22.8 | 26.2 | <0.001 | 26.1 | 25.8 | 0.532 |
| weight change [kg] | 11.9 | 12.2 | 0.512 | 13 | 10.8 | 0.163 |
| body mass index change [kg/m2] | 4.2 | 4.4 | 0.352 | 4.8 | 3.7 | 0.280 |
| age [years] | 30.5 | 32 | 0.14 | 31.5 | 33 | 0.212 |
| pregnancy duration | 32 | 34 | 0.16 | 35 | 33 | 0.04 |
| office left arm SBP [mmHg] | 115 | 134 | <0.001 | 138 | 129 | 0.018 |
| office left arm SBP [mmHg] | 70 | 85 | <0.001 | 87.5 | 80 | 0.034 |
| office right arm SBP [mmHg] | 117 | 132 | <0.001 | 136 | 128.8 | 0.015 |
| office right arm SBP [mmHg] | 70 | 85.5 | <0.001 | 87 | 78.5 | 0.008 |
| maximal SPB [mmHg] | 130 | 160 | <0.001 | 160 | 155 | 0.247 |
| maximal DBP [mmHg] | 80 | 100 | <0.001 | 99.5 | 100 | 0.579 |
| HR [beats/minute] | 86 | 90.5 | 0.3 | 88 | 92.5 | 0.794 |
Table 2
Correlations between gestational weight gain and blood pressure control in the studied subgroups. DBP – diastolic blood pressure; HR – heart rate; SBP – systolic blood pressure.
| normal | hypertensive disorders | gestational | chronic | |
|---|---|---|---|---|
| pregnancy | in pregnancy | hypertension | hypertension | |
| r = 0.286 | r = 0.233 | r = 0.264 | r = 0.022 | |
| office left arm SBP [mmHg] and gestational weight gain | p = 0.014 | p = 0.115 | p = 0.131 | p = 0.943 |
| office left arm DBP [mmHg] and gestational weight gain | r = 0.221 | r = 0.25 | r = 0.147 | r = 0.329 |
| p = 0.06 | p = 0.09 | p = 0.407 | p = 0.272 | |
| r = 0.479 | r = 0.379 | r = 0.338 | r = 0.408 | |
| office right arm SBP [mmHg] and gestational weight gain | p < 0.001 | p = 0.008 | p = 0.05 | p = 0.147 |
| r = 0.333 | r = 0.174 | r = 0.085 | r = 0.308 | |
| office right arm DBP [mmHg] and gestational weight gain | p = 0.005 | p = 0.237 | p = 0.632 | p = 0.285 |
| maximal SPB [mmHg] and gestational weight gain | r = 0.34 | r = 0.165 | r = -0.097 | r = 0.572 |
| p = 0.004 | p = 0.253 | p = 0.584 | p = 0.021 | |
| r = 0.37 | r = 0.063 | r = -0.252 | r = 0.739 | |
| maximal DBP [mmHg] and gestational weight gain | p = 0.002 | p = 0.665 | p = 0.15 | p = 0.001 |
| r = 0.24 | r = 0.148 | r = 0.182 | r = 0.079 | |
| HR [beats/minute] and gestational weight gain | p = 0.038 | p = 0.315 | p = 0.302 | p = 0.788 |
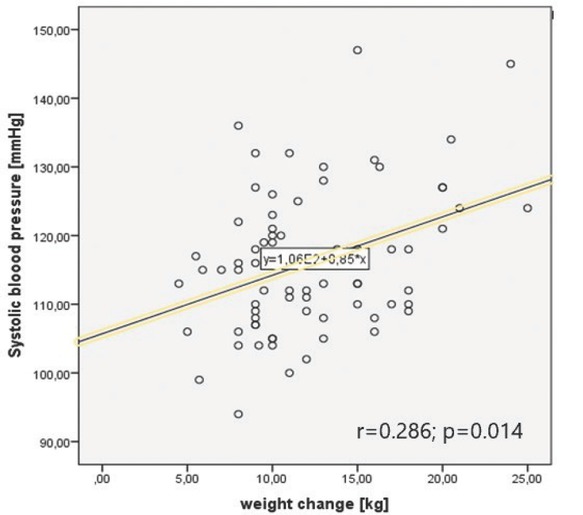
Graph 1
Correlation between systolic blood pressure and weight change in normal pregnancy group.
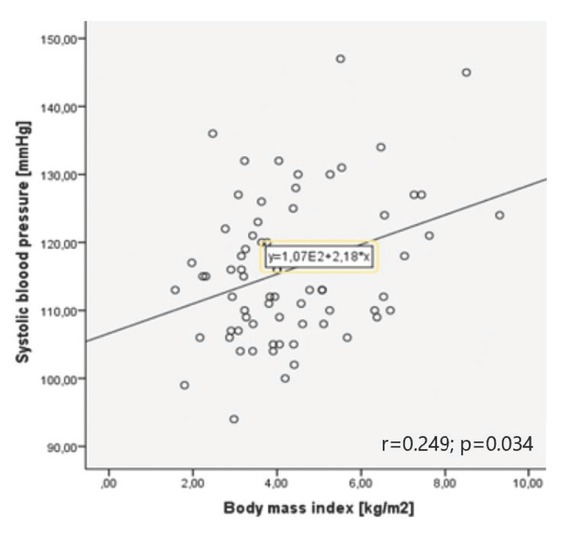
Graph 2
Correlation between systolic blood pressure and body mass index change in normal pregnancy group.
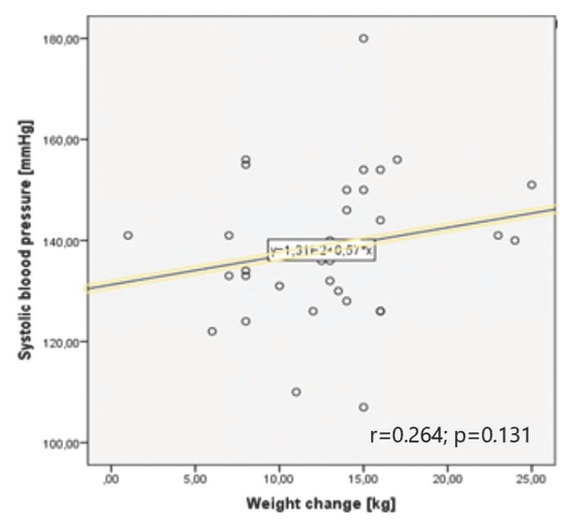
Graph 3
Correlation between maximal systolic blood pressure and weight change in gestational hypertension group.
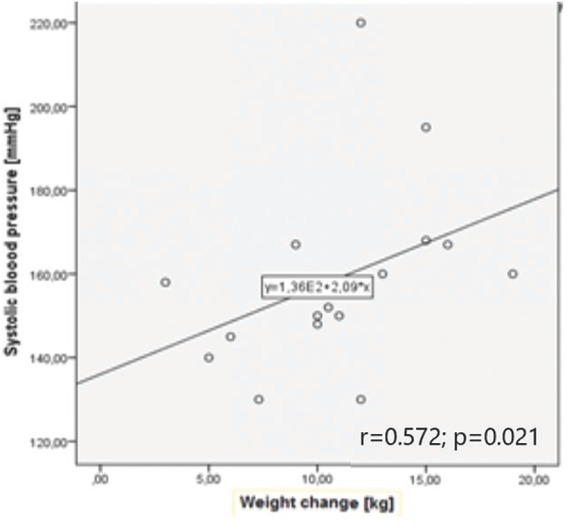
Graph 4
Correlation between maximal systolic blood pressure and weight change in chronic hypertension group.