
Figure 1
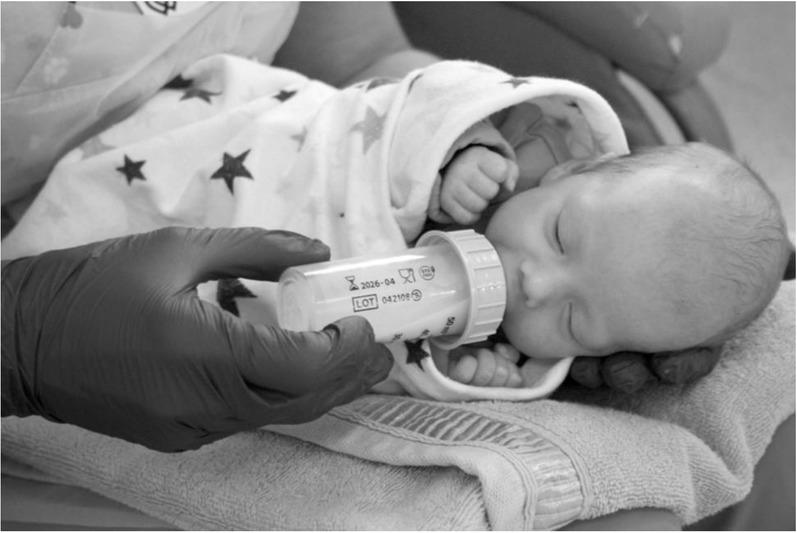
Figure 2
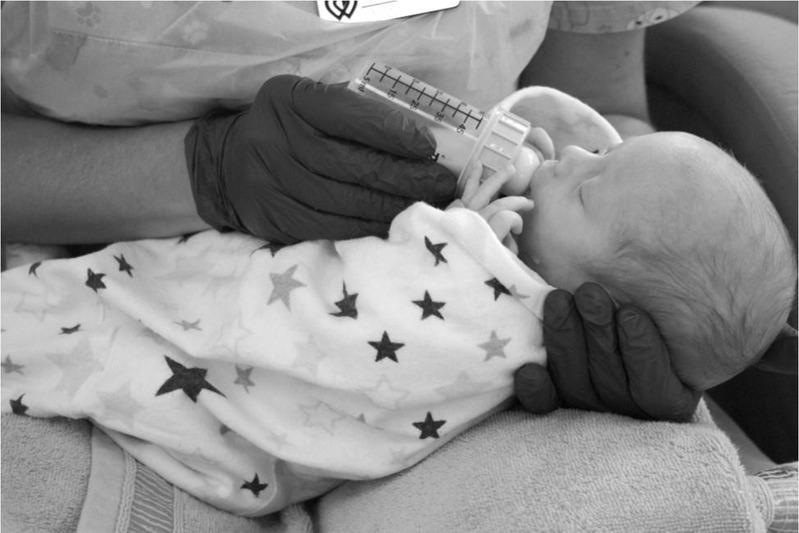
Figure 3
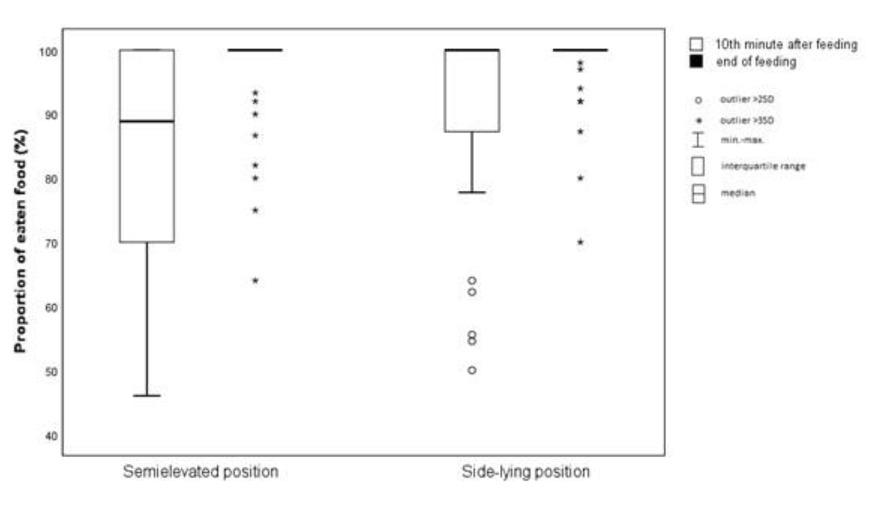
Figure 4
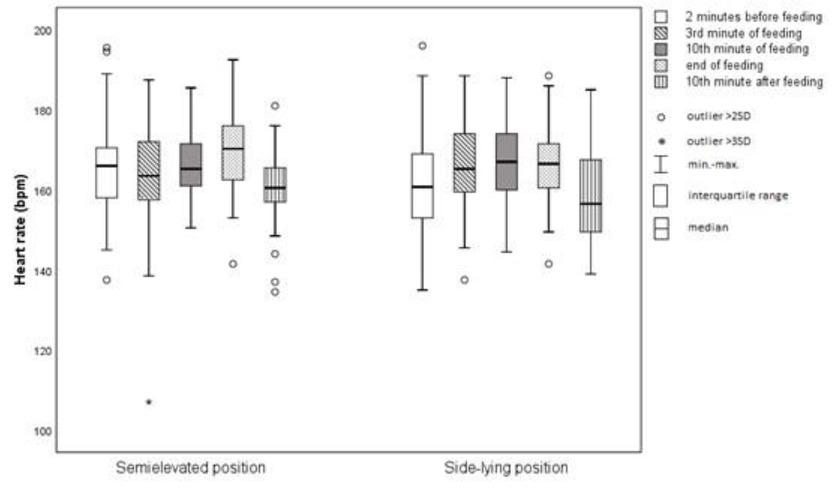
Figure 5
Figure 6
Cross table for infant position during feeding and choking episodes
| Choking episodes | Position | ||
|---|---|---|---|
| Semielevated | Side-lying | ||
| 0 | n | 12 | 29 |
| % | 29,3% | 70,7% | |
| (-3,7) | (3,7) | ||
| 1 | n | 18 | 13 |
| % | 58,1% | 41,9% | |
| (1,1) | (-1,1) | ||
| 2 | n | 12 | 0 |
| % | 100,0% | 0,0% | |
| (3,7) | (-3,7) | ||
Comparison of the periods of saturation declines to ≤85% level between the semielevated and side-lying positions
| t | df | p | |
|---|---|---|---|
| Saturation declines to ≤85% level | 1,97 | 82 | 0,052 |
Comparative table of feeding times and feeding sessions between the semielevated and side-lying positions
| t | df | p | |
|---|---|---|---|
| Duration of feeding | 0,58 | 82 | 0,562 |
| Duration of feeding session | 0,90 | 82 | 0,372 |