
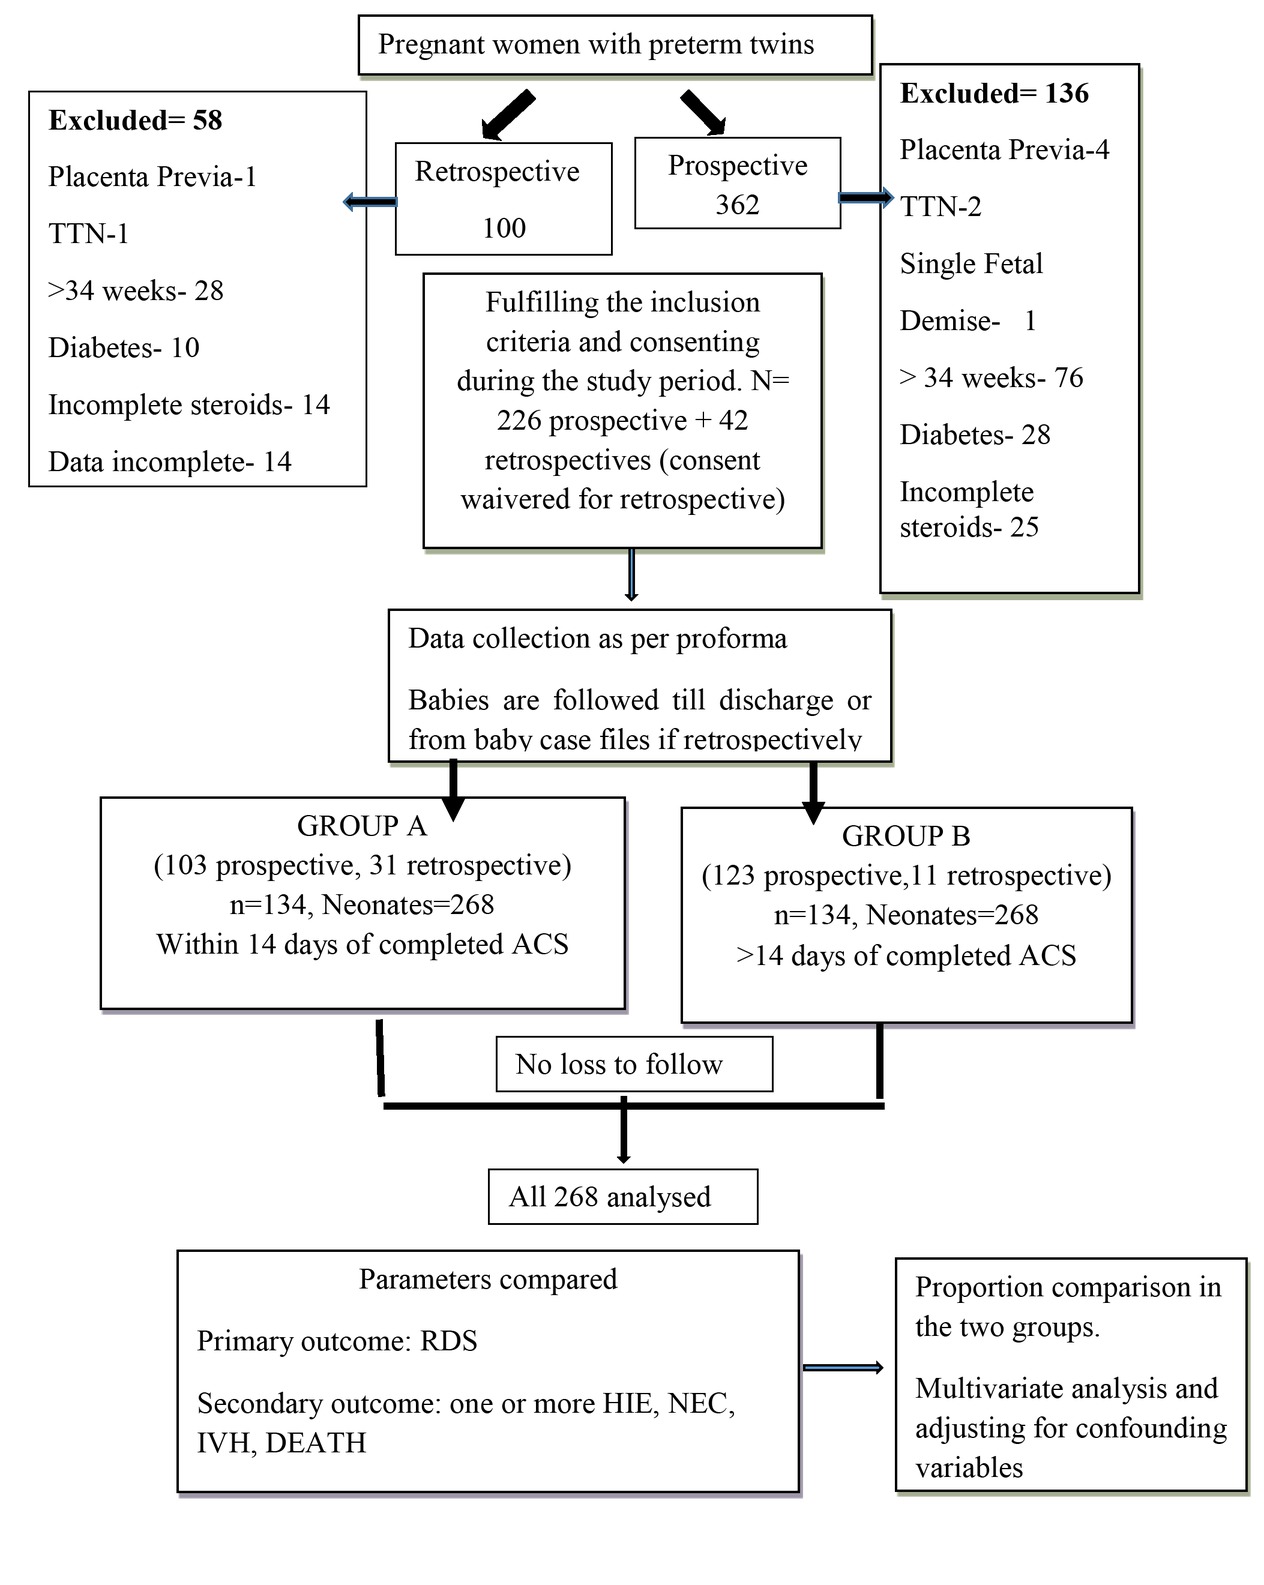
Figure 1
Flow chart of the study.
Table1
Maternal demographic and obstetrics variables in the two groups
| Baseline maternal characteristics | <14 Days Group A | >14 Days Group B | ||
|---|---|---|---|---|
| (N=134) | (N=134) | |||
| AGE years | 19-25 years | 62(46.27%) | 47(35.07%) | 0.017a |
| 26-34 years | 66(49.25%) | 69(51.49%) | (𝑥2 = 8.13) | |
| ≥35 years | 6(4.48%) | 18(13.43%) | ||
| EDUCATION | Illiterate | 2(1.4%) | 1(0.7%) | 0.531 (𝑥2 =7.05) |
| Primary | 16(11.9%) | 15(11.5%) | ||
| Middle | 53(39.5%) | 50(37.3%) | ||
| Higher | 49 (36.5%) | 49(36.6%) | ||
| Graduation | 14 (10.4%) | 19(14.2%) | ||
| PARITY | Primigravida | 101(75.67%) | 98 (73.13%) | 0.675 (𝑥2 =0.17) |
| Multigravida | 33 (24.33%) | 36 (26.87%) | ||
| TYPE OF STEROID | Betamethasone | 246 | 196 | <0.0001 a (𝑥2 = 32.25) |
| Dexamethasone | 22 | 72 | ||
| MODE OF CONCEPTION | SPONTANEOUS (n=141) | 83(61.94%) | 58(43.28%) | 0.002* (𝑥2 = 17.25) |
| ASSISTED (n=127) | 51 (40.2%) | 76 (59.8%) | ||
| CHORIONICITY | Monochorionic (n=58) | 26(19.40%) | 32(23.88%) | 0.373 (𝑥2 =0.79) |
| Dichorionic (n=210) | 108(80.60%) | 102(76.12%) | ||
| COMORBIDITY | HTDb (n=58) | 26(19.40%) | 32(23.88%) | 0.013 a 𝑥2 =(8.88) |
| Preterm premature rupture of membranes | 63(23.5%) | 17(6.3%) | <0.00001 a (𝑥2 = 31.5) | |
| GESTATIONAL AGE at DELIVERY | Mean ± SDc | 31.5(±2.09) | 32.6 (± 1.75) | <0.001 a |
| 28-29+6(n=52) | 38(28.36%) | 14(10.45%) | <.001 a (𝑥2 =40.716) | |
| 30-32+6(n=68) | 39(29.10%) | 29(21.64%) | ||
| 33-34 (n=148) | 57(42.54%) | 91(67.91%) | ||
| MODE OF DELIVERY | Caesarean (n=232) | 95(35.4%) | 137(51.1%) | <0.001 a (𝑥2 =13.40) |
| Vaginal (n=304) | 173(64.6%) | 131(48.9%) | ||
Table 2
Multivariable regression analysis of factors influencing respiratory distress syndrome and neonatal deaths
| Variable (Reference Group) | RDS (respiratory distress syndrome) | Neonatal Deaths | |||
|---|---|---|---|---|---|
| ARRa (95% CIb) | P-value | ARRa (95% CIb) | P-value | ||
| Steroid Group B (Ref-GroupA) | 1.09 (0.84-1.4) | 0.510 | 1.06 (0.620-1.8) | 0.810 | |
| Twin Order 2 (Ref-Twin order1) | 1.012 (0.790-1.2) | 0.921 | 1.20 (0.72-2.00) | 0.484 | |
| Twin Dichorionic (Ref-monochrionic) | 1.01 (0.744-1.3) | 0.920 | 1.11 (0.53- 2.30) | 0.778 | |
| Period of Gestation(weeks) (Ref-33-33+6weeks) | 28-29+6 | 1.84 (1.17-2.8) | 0.008c | 1.75 (0.48-6.3) | 0.392 |
| 30-32+6 | 1.75 (1.1-2.5) | 0.004c | 1.49 (0.405-5.52) | 0.545 | |
| Caesarean Delivery (Ref-Vaginal Delivery) - | 1.28 (0.95-1.7) | 0.102 | 0.987 (0.454-2.14) | 0.975 | |
| Birth Weight (Ref- ≥ 2kg) | <1 kg | 5.60 (2.7-11.2) | 0.0011 c | 26.06 (2.37-285.5) | 0.008 c |
| 1-1.49 kg | 5.23 (2.8-9.6) | 0.0001 c | 6.30 (0.619-64.09) | 0.120 | |
| 1.5-1.99 kg | 2.8 (1.5-5) | 0.001 c | 0.716 (0.434-11.82) | 0.816 | |
| 1 min Apgar< (Ref- I min Apgar score>7) | 2.46 (0.81-7.41) | 0.110 | |||
| Sex Male (Ref- Female) | 1.07 (0.62-1.82) | 0.802 | |||
Table 3
Propensity-matched scoring
| Outcome | Grouping | Matched Pairs | Adjusted Relative Risk (95% CIa) | P-value |
|---|---|---|---|---|
| RDSb | <14 vs >14 days | Grp A (n=180) | ref | |
| Grp B (n=180) | 1.13 (0.93-1.33) | 0.231 | ||
| NDc | <14 vs >14 days | Grp A (n=180) | ref | |
| Grp B (n=180) | 2.0 (1.03-3.88) | 0.017 | ||
| RDS | <7 vs >7 days | Grp A (n=161) | ref | |
| Grp B (n=161) | 1.04 (0.84-1.28) | 0.722 | ||
| ND | <7 vs >7 days | Grp A (n=161) | ref | |
| Grp B (n=161) | 1.85 (0.97-3.50) | 0.052 |