
Figure 1
Demographic Characteristics of the 2018 Canadian Health Behaviour in School-aged Children Study (n= 21,745)
| n | (%) | |
|---|---|---|
| Age | ||
| ≤11 | 2457 | (11.5) |
| 12 | 4207 | (19.6) |
| 13 | 4519 | (21.1) |
| 14 | 4619 | (21.6) |
| ≥15 | 5630 | (26.3) |
| Missing | 313 | |
| Grade | ||
| 6-8 | 13079 | (60.7) |
| 9-10 | 8462 | (39.3) |
| Other | 203 | |
| Missing | 1 | |
| Gender | ||
| Male | 10347 | (48.0) |
| Female | 10870 | (50.4) |
| Neither term describes me | 336 | (1.6) |
| Missing | 192 | |
| Race | ||
| White | 14075 | (66.1) |
| Black | 767 | (3.6) |
| Latin American | 205 | (1.0) |
| Indigenous (Metis, Inuit, First Nations) | 1664 | (7.8) |
| East & Southeast Asian | 699 | (3.3) |
| East Indian & South Asian | 563 | (2.6) |
| Arab & West Asian | 299 | (1.4) |
| Other (including mixed race) | 3030 | (14.2) |
| Missing | 443 | |
| Relative Family Wealth | ||
| Well off | 10028 | (53.1) |
| Average | 7174 | (38.0) |
| Not well off | 1697 | (9.0) |
| Missing | 2846 | |
| Urban/rural status of municipality | ||
| Rural area (< 1,000) | 916 | (4.2) |
| Small centre (1,000 — 29,999) | 11244 | (51.7) |
| Medium centre (30,000 – 99,999) | 3787 | (17.4) |
| Large urban centre (≥100,000) | 5798 | (26.7) |
| Adults in primary home | ||
| Mother and Father | 15080 | (71.1) |
| Mother and Partner | 1174 | (5.5) |
| Mother only | 3351 | (15.8) |
| Father and Partner | 255 | (1.2) |
| Father only | 647 | (3.1) |
| Other | 714 | (3.4) |
| Missing | 524 |
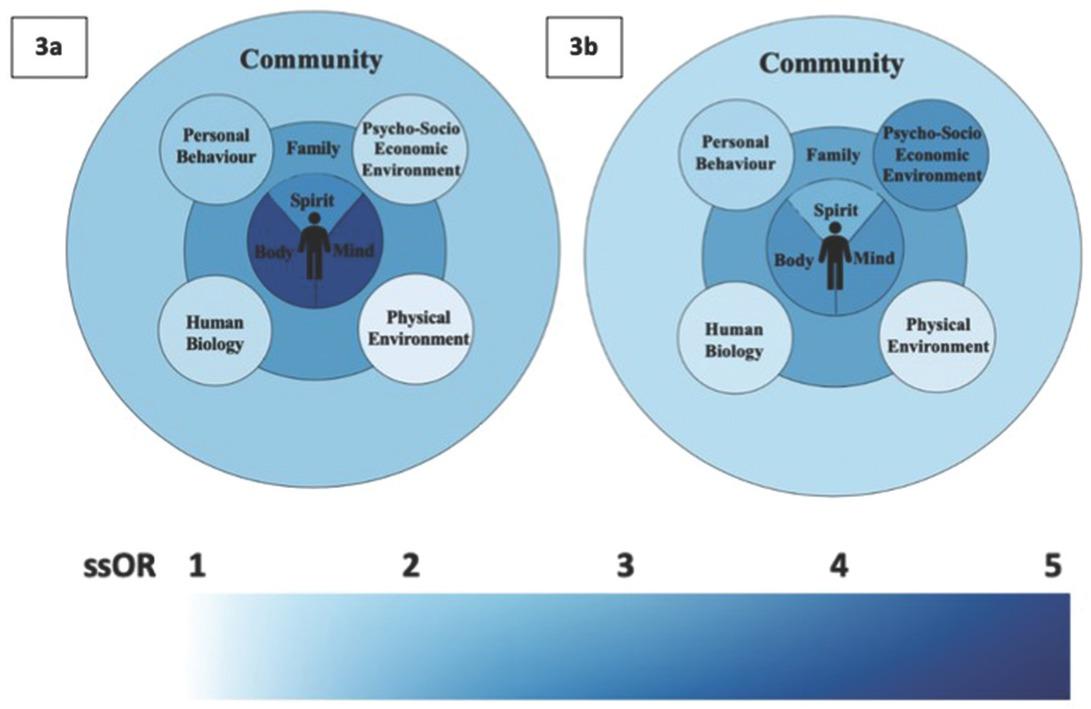
Unadjusted, adjusted and stratum-specific odds of self-reporting a happy home life for the 26 health-related factors that map onto the Mandala of Health
| Happy Home Life | |||||||||
|---|---|---|---|---|---|---|---|---|---|
| Bivariate | Adjusted† | Stratum Specific† | |||||||
| Lower Family Wealth* | Avg/Higher Family Wealth** | ||||||||
| Individual Factors | n | OR | (95% CI) | OR | (95% CI) | ssOR | (95% CI) | ssOR | (95% CI) |
| Subjective Health Complaints | 21 745 | - | - | ||||||
| Often (daily/weekly) | 4091 | 1.00 | 1.00 | 1.00 | - | 1.00 | - | ||
| Rarely (monthly) | 16 781 | 2.50 | (2.33-2.70) | 2.92 | (2.70-3.16) | 4.80 | (3.83-6.06) | 2.72 | (2.49-2.96) |
| Perception of Own Health | 21 745 | - | - | ||||||
| Poor/Fair | 3 588 | 1.00 | 1.00 | 1.00 | - | 1.00 | - | ||
| Good/Excellent | 17 388 | 4.28 | (3.99-4.59) | 3.13 | (2.89-3.40) | 3.64 | (2.90-4.57) | 3.06 | (2.81-3.34) |
| Depression | 20 561 | - | - | ||||||
| Experiences symptoms | 6 289 | 1.00 | 1.00 | 1.00 | - | 1.00 | - | ||
| Does not experience | 14 272 | 3.19 | (3.00-3.41) | 4.15 | (3.86-4.46) | 6.13 | (4.93-7.63) | 3.94 | (3.65-4.26) |
| symptoms | - | - | |||||||
| Perception of Body Image | 21 745 | ||||||||
| Too thin or too fat | 8 654 | 1.00 | 1.00 | 1.00 | - | 1.00 | - | ||
| About the right size | 13 091 | 1.81 | (1.70-1.92) | 1.92 | (1.79-2.06) | 2.73 | (2.22-3.35) | 1.84 | (1.71-1.98) |
| Spirituality | 19 361 | - | |||||||
| Not or somewhat important | 9 926 | 1.00 | 1.00 | 1.00 | - | 1.00 | - | ||
| Important | 9 435 | 1.33 | (1.25-1.41) | 2.08 | (1.94-2.24) | 2.97 | (2.41-3.66) | 1.99 | (1.85-2.15) |
Health-related items selected to map onto the seven parts of the Mandala of Health
| Individual health factors | |
| Body | Subjective health complaints |
| Perception of own health | |
| Mind | Depression |
| Body image | |
| Spirit | Spirituality scale |
| Family health factors | |
| Number of adults in the home | |
| Presence of siblings in the home | |
| Living in a foster home | |
| Eating meals as a family | |
| Family support scale | |
| Health factors at individual-family intersections | |
| Personal behavior | Bullying others |
| Age of onset of risky behavior | |
| Physical fights | |
| Dating violence | |
| Use of electronic devices | |
| Psychosocio-economic environment | Family affluence |
| Food insecurity | |
| Peer support | |
| Human biology | Gender |
| Age | |
| Physical environment | Bedroom to oneself |
| Size of home | |
| How free time is spent | |
| Community health factors | |
| Social capital scale | |
| Urban/rural comparison | |
| Participation in organised activities | |