
Figure 1
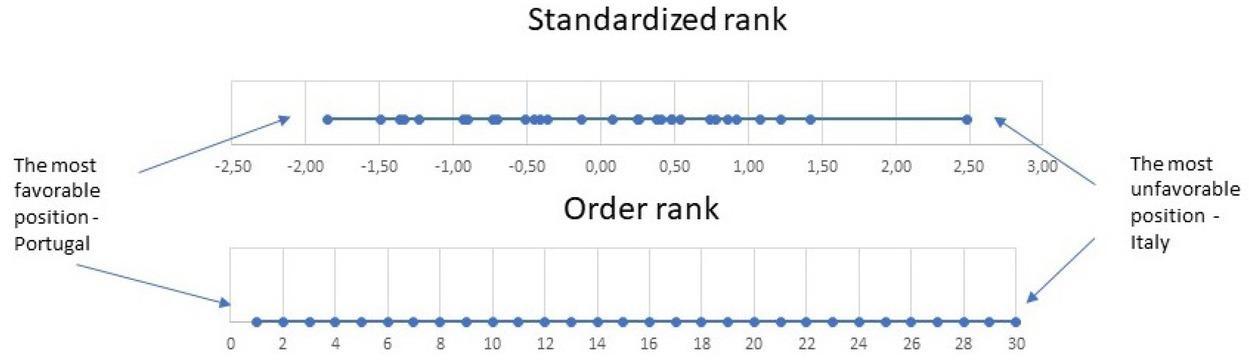
Comparison of 30 countries according psychosomatic complaints based on combined data 2002–2018_
| Country | Mean HBSC-SCL index based on weight data | Mean standardized country rank | ||||
|---|---|---|---|---|---|---|
| Total | Somatic | Psycholo-gical | Total | Somatic | Psycholo-gical | |
| Austria | 6.34±6.02 | 2.68±3.13 | 3.64±3.57 | -1.49 | -0.93 | -1.70 |
| Belgium (Flemish) | 6.91±5.94 | 2.81±3.12 | 4.07±3.60 | -0.93 | -0.64 | -1.02 |
| Belgium (French) | 8.76±6.73 | 3.63±3.47 | 5.10±4.13 | 0.86 | 1.13 | 0.57 |
| Canada | 8.39±6.62 | 3.45±3.43 | 4.91±3.94 | 0.48 | 0.75 | 0.25 |
| Croatia | 7.39±6.18 | 2.78±3.08 | 4.58±3.93 | -0.51 | -0.74 | -0.29 |
| Czechia | 8.62±5.98 | 3.08±2.95 | 5.52±3.80 | 0.74 | -0.06 | 1.25 |
| Denmark | 7.17±5.64 | 2.74±2.92 | 4.40±3.54 | -0.70 | -0.80 | -0.51 |
| Estonia | 8.15±6.67 | 3.22±3.30 | 4.91±4.18 | 0.26 | 0.26 | 0.25 |
| France | 9.15±6.28 | 3.73±3.23 | 5.38±3.95 | 1.22 | 1.33 | 1.00 |
| Germany | 7.13±5.77 | 3.19±3.13 | 3.92±3.38 | -0.73 | 0.16 | -1.27 |
| Greece | 8.32±6.43 | 2.71±3.14 | 5.58±4.24 | 0.41 | -0.88 | 1.25 |
| Greenland | 6.70±6.66 | 2.62±3.37 | 3.99±4.13 | -1.23 | -1.09 | -1.31 |
| Hungary | 8.98±6.58 | 3.75±3.43 | 5.20±3.96 | 1.08 | 1.39 | 0.73 |
| Ireland | 7.43±6.24 | 2.88±3.14 | 4.49±3.82 | -0.45 | -0.45 | -0.42 |
| Italy | 10.43±6.46 | 4.16±3.47 | 6.24±4.03 | 2.48 | 2.24 | 2.35 |
| Latvia | 8.30±6.56 | 3.15±3.35 | 5.12±4.01 | 0.38 | 0.06 | 0.57 |
| Lithuania | 8.00±6.93 | 3.00±3. 51 | 4.98±4.25 | 0.08 | -0.24 | 0.30 |
| Netherlands | 6.52±5.87 | 2.55±3.14 | 3.94±3.53 | -1.33 | -1.21 | -1.22 |
| Norway | 7.52±5.96 | 2.94±3.09 | 4.55±3.61 | -0.36 | -0.38 | -0.30 |
| Poland | 8.44±6.77 | 3.10±3.43 | 5.31±4.12 | 0.54 | -0.05 | 0.89 |
| Portugal | 6.03±6.01 | 2.22±2.93 | 3.79±3.86 | -1.85 | -1.96 | -1.55 |
| Russia | 7.46±6.90 | 3.20±3.57 | 4.24±4.10 | -0.41 | 0.20 | -0.81 |
| Slovenia | 6.51±5.97 | 2.26±2.85 | 4.21±3.83 | -1.36 | -1.81 | -0.88 |
| Spain | 6.98±6.51 | 2.84±3.38 | 4.10±3.94 | -0.90 | -0.60 | -1.04 |
| Sweden | 9.38±6.39 | 3.69±3.33 | 5.65±3.77 | 1.42 | 1.26 | 1.39 |
| Switzerland | 8.36±5.86 | 3.31±3.07 | 5.04±3.60 | 0.48 | 0.44 | 0.51 |
| Ukraine | 8.85±6.28 | 3.70±3.26 | 5.12±3.83 | 0.92 | 1.23 | 0.57 |
| England | 8.68±6.61 | 3.53±3.34 | 5.12±4.03 | 0.78 | 0.92 | 0.60 |
| Scotland | 7.76±6.45 | 3.05±3.20 | 4.69±3.98 | -0.13 | -0.13 | -0.10 |
| Wales | 8.16±6.57 | 3.39±3.30 | 4.73±4.00 | 0.25 | 0.59 | -0.04 |
| Total | 7.90±6.42 | 3.11±3.27 | 4.75±3.95 | 0.00 | 0.00 | 0.00 |
Standardized rank for Poland based on year specific ranking_
| Complaints | 2002 | 2006 | 2010 | 2014 | 2018 |
|---|---|---|---|---|---|
| Total HBSC-SCL | 0.166 | 0.314 | 0.643 | 0.917 | 0.477 |
| Somatic | -0.671 | -0.286 | 0.302 | 0.993 | -0.432 |
| Psychological | 0.745 | 0.716 | 0.846 | 0.754 | 1.022 |
Mean level of a general HBSC-SCL index with trend analysis (weighted data)_
| Sample | Mean HBSC-SCL indices ± SD | Linear trend | |||||
|---|---|---|---|---|---|---|---|
| 2002 | 2006 | 2010 | 2014 | 2018 | p | R-sq | |
| Total 30 countries Poland | 7.69±6.11 | 7.59±6.20 | 7.64±6.34 | 7.97±6.69 | 8.62±6.63 | 0.078 | 0.698 |
| Boys 30 countries Poland | 6.62±5.70 | 6.52±5.74 | 6.54±5.90 | 6.59±6.04 | 7.24±5.93 | 0.210 | 0.457 |
| Girls 30 countries Poland | 8.74±6.32 | 8.64±6.45 | 8.72±6.56 | 9.33±7.01 | 9.97±6.99 | 0.047 | 0.780 |
| 11 yrs 30 countries Poland | 6.85±6.04 | 6.54±5.97 | 6.57±6.06 | 6.56±6.16 | 7.21±6.06 | 0.613 | 0.095 |
| 13 yrs 30 countries Poland | 7.69±6.04 | 7.63±6.15 | 7.69±6.34 | 8.02±6.68 | 8.71±6.60 | 0.061 | 0.742 |
| 15 yrs 30 countries Poland | 8.50±6.14 | 8.57±6.31 | 8.63±6.43 | 9.28±6.90 | 9.89±6.91 | 0.023 | 0.863 |
Mean level of partial HBSC-SCL indices with trend analysis (weighted data)_
| Complaints/ country | 2002 | 2006 | 2010 | 2014 | 2018 | p-trend | R-sq |
|---|---|---|---|---|---|---|---|
| Somatic 30 countries Poland | 3.01±3.16 | 3.00±3.19 | 3.13±3.17 | 3.20±3.20 | 3.24±3.18 | 0.009 | 0.924 |
| Psychological 30 countries Poland | 4.67±3.79 | 4.56±3.82 | 4.50±3.85 | 4.75±4.07 | 5.30±4.13 | 0.166 | 0.526 |