
Figure 1
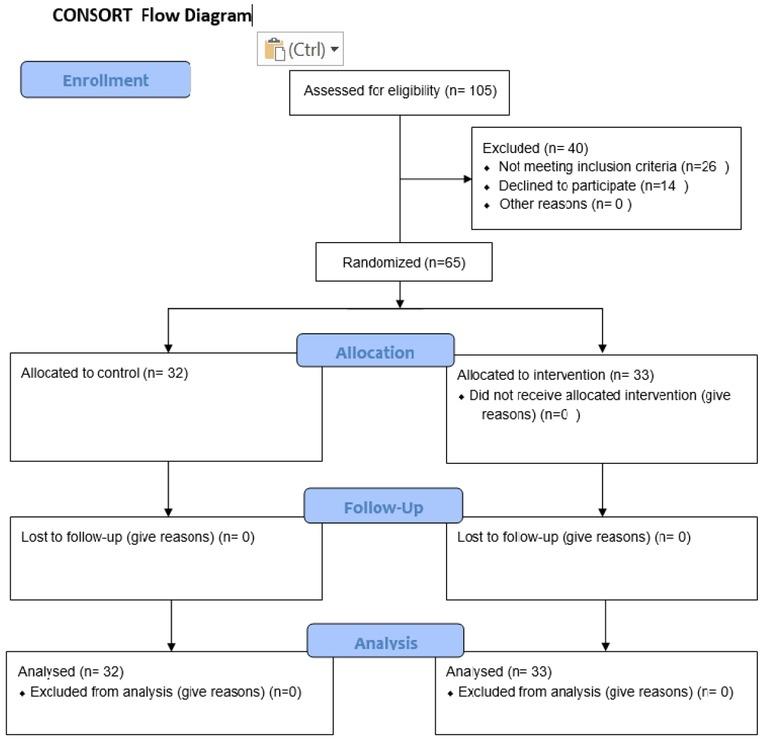
Figure 2
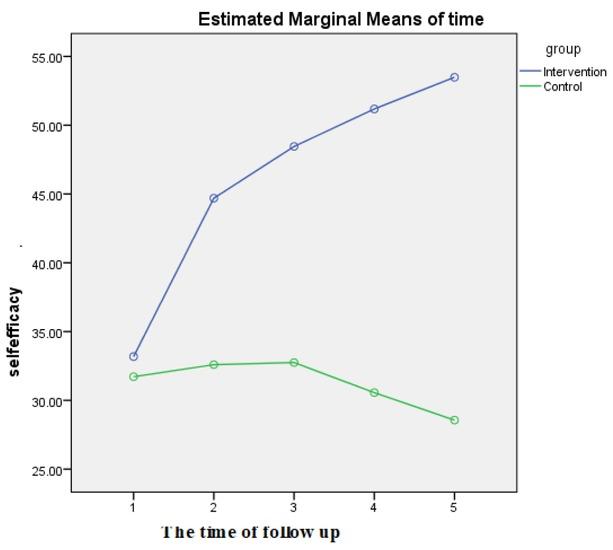
Comparison of breastfeeding self-efficacy scores between intervention and control groups in five time periods (before intervention and monthly up to 4 months after delivery
| Variable | Time | Control | Intervention | P-value* |
|---|---|---|---|---|
| Mean±SD | Mean±SD | |||
| Breastfeeding self-efficacy | Before | 31.71±4.28 | 33.18±4.63 | 0.479 |
| The first month | 32.59±7.36 | 44.69±9.51 | 0.001 | |
| The second month | 32.75±8.86 | 48.45±9.26 | 0.001 | |
| Third month | 30.56±9.86 | 51.18±10.8 | 0.001 | |
| The fourth month | 28.56 ±10.71 | 53.48±10.13 | 0.001 | |
| Paired t-test (P-value) | 0.129** | 0.001** | - |
The content of the counselling in terms of each session
| The first session was conducted face to face at discharge time, and the rest of the sessions were conducted by telephone daily for 14 days. | |
|---|---|
| First session (face to face) | Welcome |
| The second session | Discussing the baby’s general condition, jaundice, and respiratory, urinary, and faecal pattern. |
| Third session | Repeating the content of the second session |
| Fourth session | Discussing the women’s beliefs and attitudes about breastfeeding, the importance of breast milk in the growth, and development of premature babies |
| Fifth session | Strengthening mothers’ self-confidence, encouraging them to increase their individual skills in baby care, and receiving help from others |
| Sixth session | Repeating the content of the second to fifth sessions. |
| Seventh up to Fourteenth sessions | Encouraging mothers to express their feelings, needs, and desires to counsellors and others |
Comparison of the frequency distribution of individual-social characteristics of participants between the two groups Intervention and control
| Variable | Intervention | Control | P-value* | |||
|---|---|---|---|---|---|---|
| Percentage | Frequency | Percentage | Frequency | |||
| Education | Illiterate bondage | 15.2 | 5 | 21.9 | 7 | 0.244* |
| Middle–high school | 21.2 | 7 | 31.3 | 10 | ||
| Diploma | 30.3 | 10 | 34.4 | 11 | ||
| University | 33.3 | 11 | 12.5 | 4 | ||
| Female occupation | Housewife | 97 | 32 | 93.8 | 30 | 0.613** |
| Employed | 3 | 1 | 6.3 | 2 | ||
| Spouse job | Free | 66.7 | 22 | 71.9 | 23 | 0.649* |
| Employee | 33.3 | 11 | 28.1 | 9 | ||
| Residence | City | 81.8 | 27 | 96.9 | 31 | 0.050* |
| Village | 18.2 | 6 | 3.1 | 1 | ||
| Gender of the baby | Girl | 60.6 | 20 | 43.8 | 14 | 0.174* |
| Boy | 39.4 | 13 | 56.3 | 18 | ||
| Type of delivery | Normal | 27.3 | 9 | 12.5 | 4 | 0.137* |
| Cesarean section | 72.7 | 24 | 87.5 | 28 | ||
| Monthly income | Less than enough | 39.4 | 13 | 40.6 | 13 | 0. 919* |
| It is enough | 60.6 | 20 | 59.4 | 19 | ||
| Parity | Primiparous | 34.4 | 12 | 50 | 16 | |
| Multiparous | 63.6 | 21 | 50 | 16 | ||
| Sex of baby | Female | 60.6 | 20 | 43.8 | 14 | 0.174* |
| Male | 39.4 | 13 | 56.3 | 18 | ||