
Figure 1
Maternal and neonatal demographic data and general characteristics of cCMV-infected infants, with subgroups of symptomatic and asymptomatic infants_
| Characteristics | cCMV-infected infants (n = 92) | Symptomatic infants (n = 73) | Asymptomatic infants (n = 19) | p-value p-value for comparison between symptomatic and asymptomatic infants. |
|---|---|---|---|---|
| Maternal age at delivery, (years) | 28 (25–31) | 29 (25–31) | 28 (25–31) | NS |
| Primipara, n (%) | 42 (45.65) | 33 (45.21) | 9 (47.37) | NS |
| Preterm delivery (<37Hbd), n (%) | 23 (25.00) | 19 (26.03) | 4 (21.05) | NS |
| Caesarean section, n (%) | 49 (54.44) | 45 (61.64) | 4 (21.05) | 0.006 |
| Prenatal HCMV screening, n (%) | 37 (40.22) | 27 (36.99) | 10 (52.63) | NS |
| Birth weight, (g) | (21702755 –3200) | (21502685 –3140) | (26803050 –3630) | 0.028 |
| Gestational age, (weeks) | 38 (37–39) | 38 (37–39) | 39 (37–40) | NS |
| Male, n (%) | 46 (50.00) | 36 (49.32) | 10 (52.63) | NS |
| Age at admission to NICU, Median (IQR), (days) | 16 (9–23) | 14 (9–21) | 22 (20–35) | <0.001 |
| Weight at admission to NICU, (g) | 3040 (2440–3450) | 2980 (2340–3320) | 3600 (2930–4310) | <0.001 |
| Age at first HCMV DNA detection in urine, (days) | 9 (4–15) | 8 (3–14) | 17 (8–20) | 0.002 |
Allele frequencies of examined SNPs in the study population of cCMV-infected neonates and subgroups of symptomatic and asymptomatic neonates
| SNP,rs number SNP database (dbSNP) reference number (ID number). | Allele | cCMV-infected infants (n = 92) | Symptomatic infants (n = 73) | Asymptomatic infants (n = 19) | p-value p-value for comparison between frequencies of alleles and subgroups of symptomatic and asymptomatic CMV-infected newborn infants. |
|---|---|---|---|---|---|
| Allele frequencies, n (%) | |||||
| IL1B | G | 121 (65.76) | 97 (66.44) | 24 (63.16) | |
| rs16944 | NS | ||||
| G/A | A | 63 (34.24) | 49 (33.56) | 14 (36.84) | |
| IL12B | T | 142 (77.17) | 110 (75.34) | 32 (84.21) | |
| rs3212227 | NS | ||||
| G/T | G | 42 (22.83) | 36 (24.66) | 6 (15.79) | |
| IL28B | C | 120 (65.22) | 92 (63.01) | 28 (73.68) | |
| rs12979860 | NS | ||||
| C/T | T | 64 (34.78) | 54 (36.99) | 10 (26.32) | |
| CCL2 | A | 139 (75.54) | 110 (75.34) | 29 (76.32) | |
| rs1024611 | NS | ||||
| A/G | G | 45 (24.46) | 36 (24.66) | 9 (23.68) | |
| DC-SIGN | G | 107 (58.15) | 87 (59.59) | 20 (52.63) | |
| rs735240 | NS | ||||
| A/G | A | 77 (41.85) | 59 (40.41) | 18 (47.37) | |
| TLR2 | G | 174 (94.57) | 138 (94.52) | 36 (94.74) | |
| rs5743708 | NS | ||||
| A/G | A | 10 (5.43) | 8 (5.48) | 2 (5.26) | |
| TLR4 | C | 175 (95.11) | 139 (95.21) | 36 (94.74) | |
| rs4986791 | NS | ||||
| C/T | T | 9 (4.89) | 7 (4.79) | 2 (5.26) | |
| TLR9 | T | 107 (58.15) | 84 (57.53) | 23 (60.53) | |
| rs352140 | NS | ||||
| C/T | C | 77 (41.85) | 62 (42.47) | 15 (39.47) | |
Allele frequencies of examined SNPs in the study population in comparison to known European and Global reference populations from the Reference SNP (rs) Report
| SNP,rs number SNP database (dbSNP) reference number (ID number). | Allele | All study population (n = 233) | Uninfected control infants (n = 141) | cCMV-infected infants (n = 92) | p-value p-value for comparison between frequencies of alleles and subgroups of uninfected controls and CMV-infected newborn infants. | Reference population Reference allele frequency based on 1000Genomes study from the Reference SNP (rs) Report. | |
|---|---|---|---|---|---|---|---|
| European | Global | ||||||
| Allele frequencies, n (%) | Allele frequencies, % | ||||||
| IL1B | G | 320 (68.67) | 199 (70.57) | 121 (65.76) | 65.01 | 49.06 | |
| rs16944 | NS | ||||||
| G/A | A | 146 (31.33) | 83 (29.43) | 63 (34.24) | 34.99 | 50.94 | |
| IL12B | T | 352(75.54) | 210 (74.47) | 142 (77.17) | 77.73 | 64.10 | |
| rs3212227 | NS | ||||||
| G/T | G | 114 (24.46) | 72 (25.53) | 42 (22.83) | 22.27 | 35.90 | |
| IL28B | C | 309 (66.31) | 189 (67.02) | 120 (65.22) | 69.09 | 64.42 | |
| rs12979860 | NS | ||||||
| C/T | T | 157 (33.69) | 93 (32.98) | 64 (34.78) | 30.91 | 35.58 | |
| CCL2 | A | 344 (73.82) | 205 (72.70) | 139 (75.54) | 68.39 | 63.64 | |
| rs1024611 | NS | ||||||
| A/G | G | 122 (26.18) | 77(27.30) | 45 (24.46) | 31.61 | 36.36 | |
| DC-SIGN | G | 278 (59.66) | 171 (60.64) | 107 (58.15) | 56.76 | 64.70 | |
| rs735240 | NS | ||||||
| A/G | A | 188 (40.34) | 111 (39.36) | 77 (41.85) | 43.24 | 35.30 | |
| TLR2 | G | 441 (94.64) | 267 (94.68) | 174 (94.57) | 97.61 | 99.32 | |
| rs5743708 | NS | ||||||
| A/G | A | 25 (5.36) | 15 (5.32) | 10 (5.43) | 2.39 | 0.68 | |
| TLR4 | C | 440 (94.42) | 265 (93.97) | 175 (95.11) | 94.23 | 95.93 | |
| rs4986791 | NS | ||||||
| C/T | T | 26 (5.58) | 17 (6.03) | 9 (4.89) | 5.77 | 4.07 | |
| TLR9 | T | 269 (57.73) | 162 (57.45) | 107 (58.15) | 54.57 | 41.55 | |
| rs352140 | NS | ||||||
| C/T | C | 197 (42.27) | 120 (42.55) | 77 (41.85) | 45.43 | 58.45 | |
Association between alleles of examined polymorphisms (SNPs) and viremia and viruria in asymptomatic newborn infants with cCMV infection
| Asymptomatic newborn infants with cCMV infection (N = 19) | ||||||
|---|---|---|---|---|---|---|
| SNP, rs number SNP database (dbSNP) reference number (ID number). | Allele | n, (%) | HCMV DNA (copies/mL) in blood | p-value p-value – for comparison between alleles and viremia. | HCMV DNA (copies/mL) in urine | p-value p-value – for comparison between alleles and viruria. |
| IL1B | G | 24 (63.16) | 2.0 × 10³ (7.5 × 10²–3.3 × 10³) (n = 20) | 4.9 ×10⁵ (1.4 × 10⁵–5.3 × 10⁶) | ||
| rs16944 | NS | NS | ||||
| G/A | A | 14 (36.84) | 1.8 × 10³ (9.9 × 10²–2.7 × 10⁴) | 2.4 ×10⁶ (1.7 × 10⁵–6.1 × 10⁶) | ||
| IL12B | T | 32 (84.21) | 1.8 × 10³ (9.9 × 10²–1.5 × 10⁴) (n = 28) | 6.9 ×10⁵ (1.4 × 10⁵–5.3 × 10⁶) | ||
| rs3212227 | NS | NS | ||||
| G/T | G | 6 (15.79) | 2.1 × 10³ (0.0–4.0 × 10³) | 1.0 ×10⁶ (1.7 × 10⁵–2.0 × 10⁷) | ||
| IL28B | C | 28 (73.68) | 2.1 × 10³ (6.5 × 10²–2.7 × 10⁴) (n = 24) | 1.3 ×10⁶ (9.1 × 10⁴–6.1 × 10⁶) | ||
| rs12979860 | NS | NS | ||||
| C/T | T | 10 (26.32) | 1.2 × 10³ (9.9 × 10²–2.7 × 10³) | 2.9 ×10⁵ (2.5 × 10⁵–2.8 × 10⁶) | ||
| CCL2 | A | 29 (76.32) | 1.8 × 10³ (9.9 × 10²–4.0 × 10³) (n = 26) | 6.9 ×10⁵ (1.7 × 10⁵–6.1 × 10⁶) | ||
| rs1024611 | NS | NS | ||||
| A/G | G | 9 (23.68) | 2.4 × 10³ (9.5 × 10²–1.5 × 10⁴) (n = 8) | 2.5 ×10⁵ (1.4 × 10⁵–3.2 × 10⁶) | ||
| DC-SIGN | G | 20 (52.63) | 1.2 × 10³ (1.5 × 10²–3.0 × 10³) (n = 16) | 4.9 ×10⁵ (1.4 × 10⁵–7.5 × 10⁶) | ||
| rs735240 | NS | NS | ||||
| A/G | A | 18 (47.37) | 2.1 × 10³ (1.2 × 10³–3.2 × 10⁴) | 1.3 ×10⁶ (1.7 × 10⁵–4.6 × 10⁶) | ||
| TLR2 | G | 36 (94.74) | 2.0 × 10³ (6.5 × 10²–1.5 × 10⁴) (n = 32) | 1.3 ×10⁶ (1.4 × 10⁵–6.1 × 10⁶) | ||
| rs5743708 | NS | NS | ||||
| A/G | A | 2 (5.26) | 1.4 × 10³ (1.2 × 10³–1.6 × 10³) | 2.3 ×10⁵ (1.7 × 10⁵–2.9 × 10⁵) | ||
| TLR4 | C | 36 (94.74) | 2.0 × 10³ (9.9 × 10²–1.5 × 10⁴) (n = 32) | 6.9 ×10⁵ (1.5 × 10⁵–5.3 × 10⁶) | ||
| rs4986791 | NS | NS | ||||
| C/T | T | 2 (5.26) | 2.0 × 10³ (0–4.0 × 10³) | 1.0 ×10⁷ (0–2.0 × 10⁷) | ||
| TLR9 | T | 23 (60.53) | 1.8 × 10³ (1.0 × 10³–4.0 × 10³) (n = 20) | 2.9 ×10⁵ (1.4 × 10⁵–6.1 × 10⁶) | ||
| rs352140 | NS | NS | ||||
| C/T | C | 15 (39.47) | 2.0 × 10³ (3.1 × 10²–2.7 × 10⁴) (n = 14) | 2.8 ×10⁶ (4.0 × 10⁴–6.1 × 10⁶) | ||
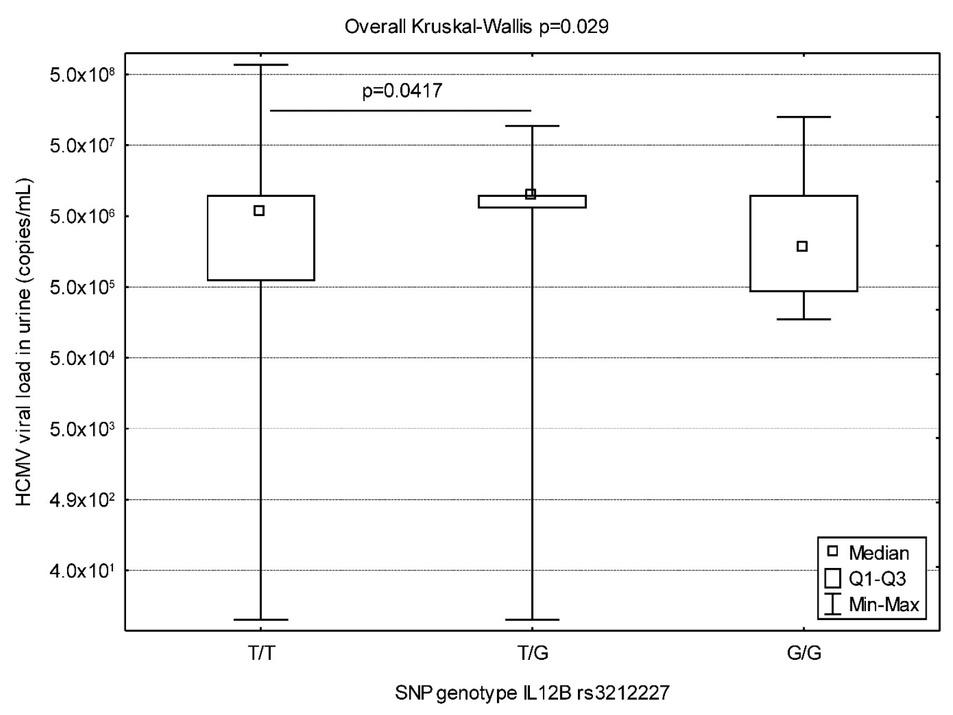
Association between genotypes of examined polymorphisms (SNPs) and viremia and viruria in newborn infants with cCMV infection_
| SNP, rs number SNP database (dbSNP) reference number (ID number). | Genotype | n = 92, n (%) | HCMV DNA (copies/mL) in blood | p-value p-value – for comparison between genotypes and viremia. | HCMV DNA (copies/mL) in urine | p-value p-value – for comparison between genotypes and viruria. |
|---|---|---|---|---|---|---|
| IL1B | A/A | 7 (7.6) | 6.3 × 10³ (3.8 × 10³–2.7 × 10⁴) | 6.5 × 10⁶ (2.8 × 10⁶–1.0 × 10⁷) | ||
| rs16944 | A/G | 49 (53.3) | 8.6 × 10³ (1.9 × 10³–5.8 × 10⁴) (n = 48) | NS | 7.8 × 10⁶ (5.1 × 10⁵–1.0 × 10⁷) (n = 48) | NS |
| G/A | G/G | 36 (39.1) | 1.5 × 10⁴ (2.0 × 10³–2.0 × 10⁵) (n = 34) | 1.0 × 10⁷ (1.7 × 10⁶–1.0 × 10⁷) (n = 35) | ||
| IL12B | T/T | 57 (62.0) | 2.2 × 10⁴ (2.1 × 10³–1.5 × 10⁵) (n = 54) | 5.8 × 10⁶ (6.0 × 10⁵–1.0 × 10⁷) (n = 56) | ||
| rs3212227 | T/G | 28 (30.4) | 7.4 × 10³ (1.8 × 10³–4.7 × 10⁴) | NS | 1.0 × 10⁷ (6.4 × 10⁶–1.0 × 10⁷) (n = 27) | 0.029 |
| G/T | G/G | 7 (7.6) | 4.3 × 10³ (2.1 × 10³–3.0 × 10⁴) | 1.7 × 10⁶ (4.2 × 10⁵–1.0 × 10⁷) | ||
| IL28B | T/T | 13 (14.1) | 5.8 × 10³ (1.9 × 10³–1.3 × 10⁵) (n = 12) | 2.8 × 10⁶ (4.0 × 10⁵–1.0 × 10⁷) (n = 12) | ||
| rs12979860 | T/C | 38 (41.3) | 1.0 × 10⁴ (1.6 × 10³–1.3 × 10⁵) | NS | 1.0 × 10⁷ (2.8 × 10⁶–1.0 × 10⁷) (n = 37) | NS |
| C/T | C/C | 41 (44.6) | 1.2 × 10⁴ (2.1 × 10³–8.2 × 10⁴) (n = 39) | 8.6 × 10⁶ (8.4 × 10⁵–1.0 × 10⁷) | ||
| CCL2 | G/G | 3 (3.3) | 2.4 × 10³ (0–9.4 × 10³) | 1.0 × 10⁷ (9.2 × 10⁶–1.0 × 10⁷) | ||
| rs1024611 | G/A | 39 (42.4) | 1.7 × 10⁴ (1.7 × 10³–5.8 × 10⁴) (n = 38) | NS | 5.5 × 10⁶ (5.2 × 10⁵–1.0 × 10⁷) (n = 37) | NS |
| A/G | A/A | 50 (54.3) | 8.9 × 10³ (2.4 × 10³–1.4 × 10⁵) (n = 48) | 8.5 × 10⁶ (1.6 × 10⁶–1.0 × 10⁷) | ||
| DC-SIGN | G/G | 35 (38.0) | 1.2 × 10⁴ (1.4 × 10³–1.2 × 10⁵) (n = 32) | 1.0 × 10⁷ (1.3 × 10⁶–1.0 × 10⁷) | ||
| rs735240 | G/A | 37 (40.2) | 1.1 × 10⁴ (2.4 × 10³–1.7 × 10⁵) | NS | 7.6 × 10⁶ (1.1 × 10⁶–1.0 × 10⁷) (n = 36) | NS |
| A/G | A/A | 20 (21.7) | 7.4 × 10³ (1.7 × 10³–3.5 × 10⁴) | 5.5 × 10⁶ (5.0 × 10⁵–1.0 × 10⁷) (n = 19) | ||
| TLR2 | G/G | 82 (89.1) | 1.2 × 10⁴ (2.1 × 10³–1.1 × 10⁵) (n = 79) | 7.8 × 10⁶ (1.2 × 10⁶–1.0 × 10⁷) (n = 80) | ||
| rs5743708 | G/A | 10 (10.9) | 4.3 × 10³ (1.6 × 10³–3.8 × 10⁴) | NS | 1.0 × 10⁷ (1.0 × 10⁶–1.0 × 10⁷) | NS |
| A/G | A/A | 0 (0) | NA | NA | ||
| TLR4 | T/T | 0 (0) | NA | NA | ||
| rs4986791 | T/C | 9 (9.8) | 2.0 × 10⁴ (2.8 × 10³–9.8 × 10⁴) | NS | 1.0 × 10⁷ (1.7 × 10⁶–1.0 × 10⁷) | NS |
| C/T | C/C | 83 (90.2) | 1.0 × 10⁴ (2.0 × 10³–1.0 × 10⁵) (n = 80) | 8.6 × 10⁶ (1.1 × 10⁶–1.0 × 10⁷) (n = 81) | ||
| TLR9 | T/T | 30 (32.6) | 2.4 × 10⁴ (3.6 × 10³–2.6 × 10⁵) (n = 29) | 1.0 × 10⁷ (1.7 × 10⁶–1.0 × 10⁷) (n = 29) | ||
| rs352140 | T/C | 47 (51.1) | 8.4 × 10³ (2.1 × 10³–5.7 × 10⁴) (n = 45) | NS | 5.7 × 10⁶ (8.4 × 10⁵–1.0 × 10⁷) (n = 46) | NS |
| C/T | C/C | 15 (16.3) | 7.9 × 10³ (1.1 × 10³–3.7 × 10⁴) | 1.0 × 10⁷ (1.6 × 10⁶–1.0 × 10⁷) |
Association between genotypes of examined polymorphisms and viremia and viruriain asymptomaticneonates with cCMV infection
| Asymptomatic infants with cCMV infection(n = 19) | ||||||
|---|---|---|---|---|---|---|
| SNP, rs number SNP database (dbSNP) reference number (ID number). | Genotype | n = 19 n (%) | HCMV DNA (copies/mL) in blood | p-value p-value – for comparison between genotypes and viremia. | HCMV DNA (copies/mL) in urine | p-value p-value – for comparison between genotypes and viruria. |
| IL1B | A/A | 2 (10.53) | 1.4 × 10⁴ (9.9 × 10²–2.7 × 10⁴) | 5.8 ×10⁶ (2.8 × 10⁶–8.8 × 10⁶) | ||
| rs16944 | A/G | 10 (52.63) | 1.8 × 10³ (3.1 × 10²–4.0 × 10³) | NS | 2.7 ×10⁵ (4.0 × 10⁴–3.2 × 10⁶) | NS |
| G/A | G/G | 7 (36.84) | 2.0 × 10³ (1.2 × 10³–2.1 × 10³) (n = 5) | 6.9 ×10⁵ (1.4 × 10⁵–6.2 × 10⁶) | ||
| IL12B | T/T | 14 (73.68) | 1.8 × 10³ (1.0 × 10³–1.4 × 10⁴) (n = 12) | 4.9 × 10⁵ (1.4 × 10⁵–4.6 × 10⁶) | ||
| rs3212227 | T/G | 4 (21.05) | 2.0 × 10³ (0–3.8 × 10⁵) | NS | 1.1 × 10⁷ (1.0 × 10⁶–4.0 × 10⁷) | NS |
| G/T | G/G | 1 (5.26) | 2.1 × 10³ (2.1 × 10³–2.1 × 10³) | 1.7 × 10⁵ (1.7 × 10⁵–1.7 × 10⁵) | ||
| IL28B | T/T | 2 (10.53) | 1.9 × 10³ (1.2 × 10³–2.7 × 10³) | 2.7 × 10⁵ (2.5 × 10⁵–2.9 × 10⁵) | ||
| rs12979860 | T/C | 6 (31.58) | 1.1 × 10³ (0–1.6 × 10³) | NS | 2.4× 10⁶ (1.7 × 10⁵–6.2 × 10⁶) | NS |
| C/T | C/C | 11 (57.89) | 2.1 × 10³ (2.0 × 10³–2.7 × 10⁴) (n = 9) | 6.9× 10⁵ (4.0 × 10⁴–6.1 × 10⁶) | ||
| CCL2 | G/G | 0 (0.00) | NA | NA | ||
| rs1024611 | G/A | 9 (47.37) | 2.4 × 10³ (9.5 × 10²–1.5 × 10⁴) (n = 8) | NS | 2.5× 10⁵ (1.4 × 10⁵–3.2 × 10⁶) | NS |
| A/G | A/A | 10 (52.63) | 1.2 × 10³ (9.9 × 10²–2.1 × 10³) (n = 9) | 1.7× 10⁶ (1.7 × 10⁵–6.1 × 10⁶) | ||
| DC-SIGN | G/G | 7 (36.84) | 3.1 × 10² (0–1.2 × 10³) (n = 5) | 2.9× 10⁵ (3.3 × 10³–2.0 × 10⁷) | ||
| rs735240 | G/A | 6 (31.58) | 2.0 × 10³ (1.6 × 10³–2.7 × 10⁴) | NS | 2.6× 10⁶ (1.7 × 10⁵–6.2 × 10⁶) | NS |
| A/G | A/A | 6 (31.58) | 2.4 × 10³ (9.9 × 10²–3.2 × 10⁴) | 1.1× 10⁶ (4.0 × 10⁴–2.8 × 10⁶) | ||
| TLR2 | G/G | 17 (89.47) | 2.1 × 10³ (3.1 × 10²–2.7 × 10⁴)(n = 15) | 2.0× 10⁶ (1.4 × 10⁵–6.1 × 10⁶) | ||
| rs5743708 | G/A | 2 (10.53) | 1.4 × 10³ (1.2 × 10³–1.6 × 10³) | NS | 2.3× 10⁵ (1.7 × 10⁵–2.9 × 10⁵) | NS |
| A/G | A/A | 0 (0.00) | NA | NA | ||
| TLR4 | T/T | 0 (0.00) | NA | NA | ||
| rs4986791 | T/C | 2 (10.53) | 2.0 × 10³ (0–4.0 × 10³) | NS | 1.0 × 10⁷ (0–2.0 × 10⁷) | NS |
| C/T | C/C | 17 (89.47) | 2.0 × 10³ (9.9 × 10²–2.7 × 10⁴)(n = 15) | 6.9× 10⁵ (1.7 × 10⁵–4.6 × 10⁶) | ||
| TLR9 | T/T | 7 (36.84) | 1.4 × 10³ (0–4.0 × 10³) (n = 6) | 2.9× 10⁵ (1.4 × 10⁵–2.0 × 10⁷) | ||
| rs352140 | T/C | 9 (47.37) | 2.1 × 10³ (1.6 × 10³–1.7 × 10⁴)(n = 8) | NS | 6.9× 10⁵ (1.7 × 10⁵–4.6 × 10⁶) | NS |
| C/T | C/C | 3 (15.79) | 3.1× 10² (0–2.7 × 10⁴) | 3.2× 10⁶ (0–8.8 × 10⁶) | ||
Association between alleles of examined polymorphisms (SNPs) and viremia and viruria in newborn infants with cCMV infection
| Newborn infants with cCMV infection (N = 92) | ||||||
|---|---|---|---|---|---|---|
| SNP, rs number SNP database (dbSNP) reference number (ID number). | Allele | n, (%) | HCMV DNA (copies/mL) in blood | p-value p-value – for comparison between alleles and viremia. | HCMV DNA (copies/mL) in urine | p-value p-value – for comparison between alleles and viruria. |
| IL1B | G | 121 (65.76) | 1.2 × 10⁴ (2.0 × 10³–1.7 × 10⁵) (n = 116) | 1.0 ×10⁷ (1.1 × 10⁶–1.0 × 10⁷) (n = 118) | ||
| rs16944 | NS | NS | ||||
| G/A | A | 63 (34.24) | 7.6 × 10³ (2.4 × 10³–3.8 × 10⁴) (n = 62) | 6.8 ×10⁶ (1.1 × 10⁶–1.0 × 10⁷) (n = 62) | ||
| IL12B | T | 142 (77.17) | 1.6 × 10⁴ (2.0 × 10³–1.3 × 10⁵) (n = 136) | 7.0 ×10⁶ (1.0 × 10⁶–1.0 × 10⁷) (n = 139) | ||
| rs3212227 | NS | |||||
| G/T | G | 42 (22.83) | 4.8 × 10³ (2.1 × 10³–3.0 × 10⁴) | 1.0 ×10⁷ (1.7 × 10⁶–1.0 × 10⁷) (n = 41) | NS | |
| IL28B | C | 120 (65.22) | 1.1 × 10⁴ (2.1 × 10³–9.0 × 10⁴) (n = 116) | 8.8 ×10⁶ (1.0 × 10⁶–1.0 × 10⁷) (n = 119) | ||
| rs12979860 | NS | NS | ||||
| C/T | T | 64 (34.78) | 8.1 × 10³ (1.6 × 10³–1.3 × 10⁵) (n = 62) | 7.0 ×10⁶ (1.3 × 10⁶–1.0 × 10⁷) (n = 61) | ||
| CCL2 | A | 139 (75.54) | 1.1 × 10⁴ (2.1 × 10³–1.3 × 10⁵) (n = 134) | 7.0 ×10⁶ (1.1 × 10⁶–1.0 × 10⁷) (n = 137) | ||
| rs1024611 | NS | NS | ||||
| A/G | G | 45 (24.46) | 1.0 × 10⁴ (1.6 × 10³–4.9 × 10⁴) (n = 44) | 9.2 ×10⁶ (8.4 × 10⁵–1.0 × 10⁷) (n = 43) | ||
| DC-SIGN | G | 107 (58.15) | 1.1 × 10⁴ (2.0 × 10³–1.3 × 10⁵) (n = 101) | 9.6 ×10⁶ (1.3 × 10⁶–1.0 × 10⁷) (n = 106) | ||
| rs735240 | NS | NS | ||||
| A/G | A | 77 (41.85) | 9.4 × 10³ (2.1 × 10³–5.7 × 10⁴) | 6.1 ×10⁶ (1.0 × 10⁶–1.0 × 10⁷) (n = 74) | ||
| TLR2 | G | 174 (94.57) | 1.1 × 10⁴ (2.1 × 10³–1.0 × 10⁵) (n = 168) | 8.6 ×10⁶ (1.1 × 10⁶–1.0 × 10⁷) (n = 170) | ||
| rs5743708 | NS | NS | ||||
| A/G | A | 10 (5.43) | 4.3 × 10³ (1.6 × 10³–3.8 × 10⁴) | 1.0 ×10⁷ (1.0 × 10⁶–1.0 × 10⁷) | ||
| TLR4 | C | 175 (95.11) | 1.0 × 10⁴ (2.1 × 10³–9.8 × 10⁴) (n = 169) | 8.6 ×10⁶ (1.1 × 10⁶–1.0 × 10⁷) (n = 171) | ||
| rs4986791 | NS | NS | ||||
| C/T | T | 9 (4.89) | 2.0 × 10⁴ (2.8 × 10³–9.8 × 10⁴) | 1.0 ×10⁷ (1.7 × 10⁶–1.0 × 10⁷) | ||
| TLR9 | T | 107 (58.15) | 1.7 × 10³ (2.1 × 10³–1.5 × 10⁵) (n = 103) | 9.2 ×10⁶ (1.1 × 10⁶–1.0 × 10⁷) (n = 104) | ||
| rs352140 | NS | NS | ||||
| C/T | C | 77 (41.85) | 7.9 × 10³ (1.7 × 10³–5.1 × 10⁴) (n = 75) | 7.8 ×10⁶ (1.0 × 10⁶–1.0 × 10⁷) (n = 76) | ||
Distribution of genotypes of examined SNPs in the study population of cCMV-infected infants and subgroups of symptomatic and asymptomatic newborn infants
| SNP, rs number SNP database (dbSNP) reference number (ID number). | Genotype | cCMV-infected neonates(n = 92) | Symptomatic neonates (n = 73) | Asymptomatic neonates (n = 19) | p-value p-value for comparison between frequencies of genotypes and subgroups of symptomatic and asymptomatic newborn infants. |
|---|---|---|---|---|---|
| Genotype frequencies, n (%) | |||||
| IL1B | A/A | 7 (7.61) | 5 (6.85) | 2 (10.53) | |
| rs16944 | A/G | 49 (53.26) | 39 (53.42) | 10 (52.63) | NS |
| G/A | G/G | 36 (39.13) | 29 (39.73) | 7 (36.84) | |
| IL12B | T/T | 57 (61.96) | 43 (58.90) | 14 (73.68) | |
| rs3212227 | T/G | 28 (30.43) | 24 (32.88) | 4 (21.05) | NS |
| G/T | G/G | 7 (7.61) | 6 (8.22) | 1 (5.26) | |
| IL28B | T/T | 13 (14.13) | 11 (15.07) | 2 (10.53) | |
| rs12979860 | T/C | 38 (41.30) | 32 (43.84) | 6 (31.58) | NS |
| C/T | C/C | 41 (44.57) | 30 (41.09) | 11 (57.89) | |
| CCL2 | G/G | 3 (3.26) | 3 (4.11) | 0 (0.00) | |
| rs1024611 | G/A | 39 (42.39) | 30 (41.10) | 9 (47.37) | NS |
| A/G | A/A | 50 (54.35) | 40 (54.79) | 10 (52.63) | |
| DC-SIGN | G/G | 35 (38.04) | 28 (38.36) | 7 (36.84) | |
| rs735240 | G/A | 37 (40.22) | 31 (42.47) | 6 (31.58) | NS |
| A/G | A/A | 20 (21.74) | 14 (19.17) | 6 (31.58) | |
| TLR2 | G/G | 82 (89.13) | 65 (89.04) | 17 (89.47) | |
| rs5743708 | G/A | 10 (10.87) | 8 (10.96) | 2 (10.53) | NS |
| A/G | A/A | 0 (0.00) | 0 (0.00) | 0 (0.00) | |
| TLR4 | T/T | 0 (0.00) | 0 (0.00) | 0 (0.00) | |
| rs4986791 | T/C | 9 (9.78) | 7 (9.59) | 2 (10.53) | NS |
| C/T | C/C | 83 (90.22) | 66 (90.41) | 17 (89.47) | |
| TLR9 | T/T | 30 (32.61) | 23 (31.51) | 7 (36.84) | |
| rs352140 | T/C | 47 (51.09) | 38 (52.05) | 9 (47.37) | NS |
| C/T | C/C | 15 (16.30) | 12 (16.44) | 3 (15.79) | |
Association between genotypes of examined polymorphisms and viremia and viruria in symptomatic infants with cCMV infection
| Symptomatic infants with cCMV infection (n = 73) | ||||||
|---|---|---|---|---|---|---|
| SNP rs number SNP database (dbSNP) reference number (ID number). | Genotype | n = 73 n (%) | HCMV DNA (copies/mL) in blood | p-value p-value – for comparison between genotypes and viremia. | HCMV DNA (copies/mL) in urine | p-value p-value – for comparison between genotypes and viruria. |
| A/A | 5 (6.85) | 6.3 × 10³ (5.4 × 10³–1.1 × 10⁴) | 6.5 × 10⁶ (5.4 × 10⁶–1.0 × 10⁷) | |||
| IL1B | ||||||
| rs16944 | A/G | 39 (53.42) | 1.9 × 10⁴ (3.6 × 10³–1.1 × 10⁵) (n = 38) | NS | 1.0 × 10⁷ (1.1 × 10⁶–1.0 × 10⁷) (n = 38) | NS |
| G/A | ||||||
| G/G | 29 (39.73) | 3.0 × 10⁴ (2.8 × 10³–2.1 × 10⁵) | 1.0 × 10⁷ (3.7 × 10⁶–1.0 × 10⁷) (n = 28) | |||
| T/T | 43 (58.90) | 3.9 × 10⁴ (5.4 × 10³–1.9 × 10⁵) (n = 42) | 1.0 × 10⁷ (1.3 × 10⁶–1.0 × 10⁷) (n = 42) | |||
| IL12B | ||||||
| rs3212227 | T/G | 24 (32.88) | 9.4 × 10³ (2.4 × 10³–4.7 × 10⁴) | NS | 1.0 × 10⁷ (9.2 × 10⁶–1.0 × 10⁷) (n = 23) | NS |
| G/T | ||||||
| G/G | 6 (8.22) | 7.9 × 10³ (2.4 × 10³–3.0 × 10⁴) | 2.3 × 10⁶ (1.6 × 10⁶–1.0 × 10⁷) | |||
| T/T | 11 (15.07) | 2.2 × 10⁴ (3.3 × 10³–2.1 × 10⁵) (n = 10) | 7.0 × 10⁶ (1.3 × 10⁶–1.0 × 10⁷) (n = 10) | |||
| IL28B | ||||||
| rs12979860 | T/C | 32 (43.84) | 1.9 × 10⁴ (3.2 × 10³–1.4 × 10⁵) | NS | 1.0 × 10⁷ (3.5 × 10⁶–1.0 × 10⁷) (n = 31) | NS |
| C/T | ||||||
| C/C | 30 (41.09) | 1.6 × 10⁴ (3.9 × 10³–1.1 × 10⁵) | 1.0 × 10⁷ (1.4 × 10⁶–1.0 × 10⁷) | |||
| G/G | 3 (4.11) | 2.4 × 10³ (0–9.4 × 10³) | 1.0 × 10⁷ (9.2 × 10⁶–1.0 × 10⁷) | |||
| CCL2 | ||||||
| rs1024611 | G/A | 30 (41.10) | 2.9 × 10⁴ (3.6 × 10³–1.1 × 10⁵) | NS | 1.0 × 10⁷ (1.0 × 10⁶–1.0 × 10⁷) (n = 28) | NS |
| A/G | ||||||
| A/A | 40 (54.79) | 1.2 × 10⁴ (3.9 × 10³–2.0 × 10⁵) (n = 39) | 1.0 × 10⁷ (3.7 × 10⁶–1.0 × 10⁷) | |||
| G/G | 28 (38.36) | 2.9 × 10⁴ (4.3 × 10³–1.5 × 10⁵) (n = 27) | 1.0 × 10⁷ (4.2 × 10⁶–1.0 × 10⁷) | |||
| DC-SIGN | ||||||
| rs735240 | G/A | 31 (42.47) | 1.2 × 10⁴ (3.6 × 10³–1.9 × 10⁵) | NS | 1.0 × 10⁷ (1.4 × 10⁶–1.0 × 10⁷) (n = 30) | NS |
| A/G | ||||||
| A/A | 14(19.17) | 1.3 × 10⁴ (2.8 × 10³–3.8 × 10⁴) | 1.0 × 10⁷ (1.7 × 10⁶–1.0 × 10⁷) (n = 13) | |||
| G/G | 65 (89.04) | 1.9 × 10⁴ (3.7 × 10³–1.7 × 10⁵) (n = 64) | 1.0 × 10⁷ (1.7 × 10⁶–1.0 × 10⁷) (n = 63) | |||
| TLR2 | ||||||
| rs5743708 | G/A | 8 (10.96) | 5.0 × 10³ (2.8 × 10³–8.4 × 10⁴) | NS | 1.0 × 10⁷ (5.5 × 10⁶–1.0 × 10⁷) | NS |
| A/G | ||||||
| A/A | 0 (0.00) | NA | NA | |||
| T/T | 0 (0.00) | NA | NA | |||
| TLR4 | ||||||
| rs4986791 | T/C | 7 (9.59) | 3.8 × 10⁴ (2.8 × 10³–1.1 × 10⁵) | NS | 1.0 × 10⁷ (1.7 × 10⁶–1.0 × 10⁷) | NS |
| C/T | ||||||
| C/C | 66 (9×0.41) | 1.4 × 10⁴ (3.8 × 10³–1.5 × 10⁵) (n = 65) | 1.0 × 10⁷ (1.7 × 10⁶–1.0 × 10⁷) (n = 64) | |||
| TLR9 | T/T | 23 (31.51) | 2.9 × 10⁴ (5.3 × 10³–2.6 × 10⁵) | 1.0 × 10⁷ (5.5 × 10⁶–1.0 × 10⁷) (n = 22) | ||
| rs352140 | T/C | 38 (52.05) | 1.4 × 10⁴ (2.8 × 10³–8.2 × 10⁴) (n = 37) | NS | 1.0 × 10⁷ (1.1 × 10⁶–1.0 × 10⁷) (n = 37) | NS |
| C/T | C/C | 12 (16.44) | 8.6 × 10³ (3.0 × 10³–4.7 × 10⁴) | 1.0 × 10⁷ (4.3 × 10⁶–1.0 × 10⁷) | ||
Association between alleles of examined polymorphisms (SNPs) and viremia and viruria in symptomatic newborn infants with cCMV infection_
| Symptomatic newborn infants with cCMV infection (N = 73) | ||||||
|---|---|---|---|---|---|---|
| SNP, rs number SNP database (dbSNP) reference number (ID number). | Allele | Alleles, n (%) | HCMV (copies/DNA mL) in blood | p-value p-value – for comparison between alleles and viremia. | HCMV DNA (copies/mL) in urine | p-value p-value – for comparison between alleles and viruria. |
| IL1B | G | 97 (66.44) | 2.2 × 10⁴ (3.0 × 10³–1.9 × 10⁵) (n = 96) | 1.0 × 10⁷ (2.9 × 10⁶–1.0 × 10⁷) (n = 94) | ||
| rs16944 | NS | NS | ||||
| G/A | A | 49 (33.56) | 1.1 × 10⁴ (3.8 × 10³–5.4 × 10⁴) (n = 48) | 1.0 × 10⁷ (1.5 × 10⁶–1.0 × 10⁷) (n = 48) | ||
| IL12B | T | 110 (75.34) | 2.6 × 10⁴ (4.7 × 10³–1.8 × 10⁵) | 1.0 × 10⁷ (1.4 × 10⁶–1.0 × 10⁷) | ||
| rs3212227 | (n = 108) | 0.037 | (n = 107) | NS | ||
| G/T | G | 36 (24.66) | 9.4 × 10³ (2.4 × 10³–3.4 × 10⁴) | 1.0 × 10⁷ (1.7 × 10⁶–1.0 × 10⁷) (n = 35) | ||
| IL28B | C | 92 (63.01) | 1.7 × 10⁴ (3.8 × 10³–1.2 × 10⁵) | 1.0 × 10⁷ (1.7 × 10⁶–1.0 × 10⁷) (n = 91) | ||
| rs12979860 | NS | NS | ||||
| C/T | T | 54 (36.99) | 1.9 × 10⁴ (3.3 × 10³–1.8 × 10⁵) (n = 52) | 1.0 × 10⁷ (1.6 × 10⁶–1.0 × 10⁷) (n = 51) | ||
| CCL2 | A | 110 (75.34) | 1.9 × 10⁴ (3.9 × 10³–1.7 × 10⁵) | 1.0 × 10⁷ (1.7 × 10⁶–1.0 × 10⁷) | ||
| rs1024611 | (n = 108) | NS | (n = 108) | NS | ||
| A/G | G | 36 (24.66) | 1.6 × 10⁴ (2.0 × 10³–5.4 × 10⁴) | 1.0 × 10⁷ (1.4 × 10⁶–1.0 × 10⁷) (n = 34) | ||
| DC-SIGN | G | 87 (59.59) | 2.8 × 10⁴ (3.9 × 10³–1.5 × 10⁵) (n = 85) | 1.0 × 10⁷ (2.9 × 10⁶–1.0 × 10⁷) (n = 86) | ||
| rs735240 | NS | NS | ||||
| A/G | A | 59 (40.41) | 1.2 × 10⁴ (3.3 × 10³–8.2 × 10⁴) | 1.0 × 10⁷ (1.5 × 10⁶–1.0 × 10⁷) (n = 56) | ||
| TLR2 | G | 138 (94.52) | 1.7 × 10⁴ (3.7 × 10³–1.5 × 10⁵) | 1.0 × 10⁷ (1.7 × 10⁶–1.0 × 10⁷) | ||
| rs5743708 | (n = 136) | NS | (n = 134) | NS | ||
| A/G | A | 8 (5.48) | 5.0 × 10³ (2.8 × 10³–8.4 × 10⁴) | 1.0 × 10⁷ (5.5 × 10⁶–1.0 × 10⁷) | ||
| TLR4 rs4986791 | C | 139 (95.21) | 1.7 × 10⁴ (3.8 × 10³–1.5 × 10⁵) (n = 137) | NS | 1.0 × 10⁷ (1.7 × 10⁶–1.0 × 10⁷) (n = 135) | NS |
| C/T | T | 7 (4.79) | 3.8 × 10⁴ (2.8 × 10³–1.1 × 10⁵) | 1.0 × 10⁷ (1.7 × 10⁶–1.0 × 10⁷) | ||
| TLR9 | T | 84 (57.53) | 2.8 × 10⁴ (3.8 × 10³–1.9 × 10⁵) (n = 83) | 1.0 × 10⁷ (2.9 × 10⁶–1.0 × 10⁷) (n = 81) | ||
| rs352140 | NS | NS | ||||
| C/T | C | 62 (42.47) | 9.4 × 10³ (2.8 × 10³–5.8 × 10⁴) (n = 61) | 1.0 × 10⁷ (1.6 × 10⁶–1.0 × 10⁷) (n = 61) | ||