
Figure 1
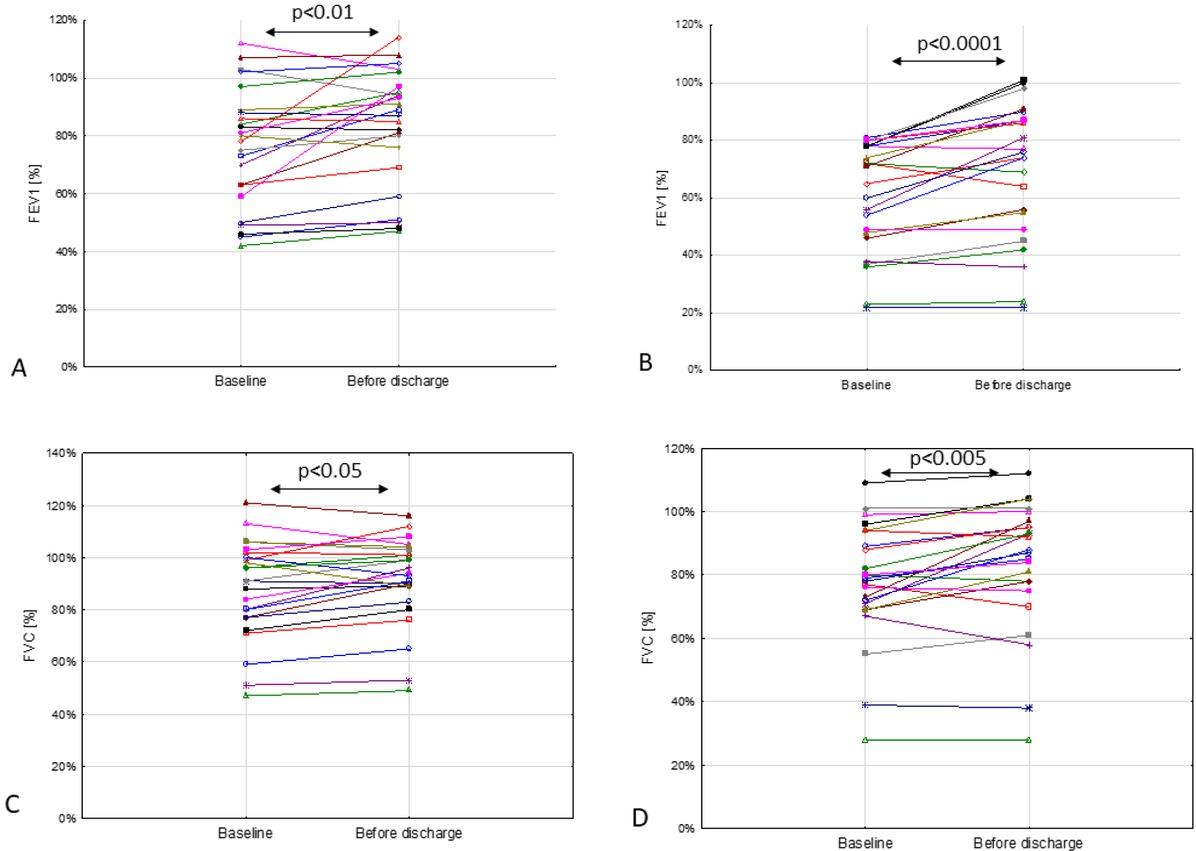
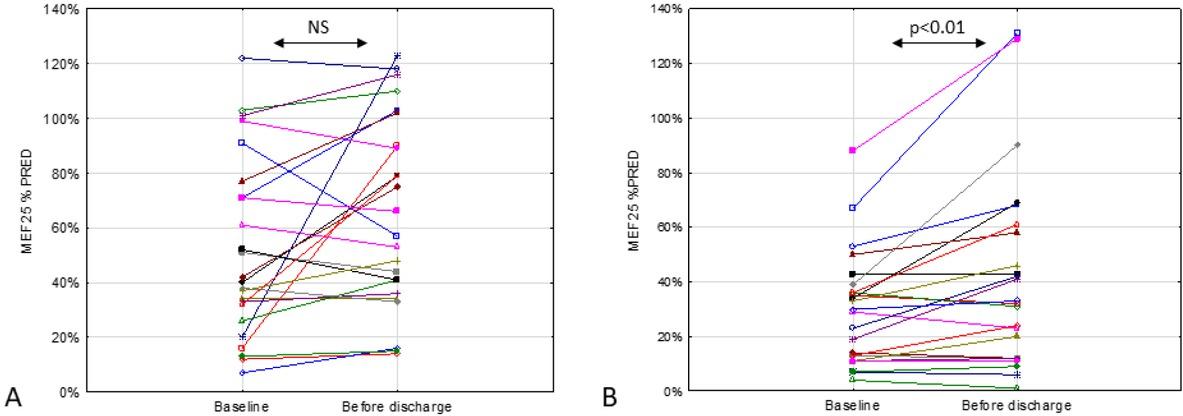
Figure 2
Pulmonary function tests_
| CP | CP + device | |||||||
|---|---|---|---|---|---|---|---|---|
| Baseline | Before discharge | Mean change from baseline to discharge | p-value | Baseline/ | Before discharge | Mean change from baseline to discharge | p-value | |
| LCI: | ||||||||
| Mean ± SD | 12.3±4.0 | 11.5±3.8 | –0.8±2.0 | 0.030 | 14.4±3.8 n=18 in the CP + device group. | 13.7±4.1 n=18 in the CP + device group. | –0.7±2.4 n=18 in the CP + device group. | NS |
| % change | –5.0±16.3 | -4.4±13.5 n=18 in the CP + device group. | ||||||
| LCI z-score | ||||||||
| Mean ± SD | 19.2±22.1 | 18.1±24.6 | -1.1±7.9 | NS | 29.0±27.5 n=18 in the CP + device group. | 23.9±27.5 n=18 in the CP + device group. | –5.1±14.8 n=18 in the CP + device group. | NS |
| % change | –5.3±49.5 | –10.1±21.8 n=18 in the CP + device group. | ||||||
| FEV1, % predicted: | ||||||||
| Mean ± SD | 76.0±20.6 | 83.3±19.9 | 7.3±12.0 | 0.007 | 66.7±19.2 | 69.6±23.5 | 9.0±9.1 | <0.001 |
| % change | 11.5±17.5 | 14.3±14.2 | ||||||
| FVC, % predicted | ||||||||
| Mean ± SD | 87.8±18.8 | 91.1±16.9 | 3.3±6.9 | 0.030 | 77.7±18.6 | 83.2±20.4 | 5.5±8.1 | 0.003 |
| % change | 4.4±7.7 | 7.1±11.2 | ||||||
| FEV1/FVC, % | ||||||||
| Mean ± SD | 86.8±10.2 | 91.6±8.2 | 4.8±9.0 | 0.003 | 77.0±14.1 | 82.2±16.5 | 5.0±6.0 | <0.001 |
| % change | 6.6±14.1 | 7.7±7.8 | ||||||
| FEV1/FVC z-score | ||||||||
| Mean ± SD | -1.58±1.07 | -1.06±0.97 | 0.52±0.95 | 0.007 | -2.42±1.142 | -1.93±1.28 | 0.49±0.64 | 0.001 |
| % change | -18.0±68.3 | - 47.4±120.4 | ||||||
| MEF25, % | 52.0±32.9 | 65.9±34.7 | 13.9±29.6 | NS | 29.4±20.7 | 41.8± 35.5 | 12.4±18.8 | 0.006 |
| MEF50, % | 73.5±34.9 | 87.6±35.5 | 14.1±29.5 | 0.022 | 48.3±32.2 | 59.0±33.1 | 10.7±18.0 | 0.008 |
| MEF75, % | 75.7±25.1 | 90.7±29.1 | 15.0±23.1 | 0.004 | 66.0±27.9 | 78.3±31.2 | 12.3±18.2 | 0.003 |
| MEF25-75, % | 58.7±28.2 | 73.0±28.8 | 14.3±27.1 | 0.006 | 38.0±24.9 | 48.0±31.2 | 10.0±14.1 | <0.002 |
Characteristics of the study population_
| Characteristic | CP (n=24) | CP + device (n=24) | p-value |
|---|---|---|---|
| Age, years | 13 (12–16) | 14 (13–17) | NS |
| Male, n (%) | 16 (66.7) | 7 (29.2) | <0.01 |
| Height, cm | 161.0±12.3 | 159.3±14.7 | NS |
| BMI, kg/m2 | 18.9±2.5 | 18.2±5.9 | NS |
| BMI z-score | –0.2±0.8 | –0.9±0.9 | <0.05 |
| LCI | 12.3±4.0 | 14.4±3.8 n=18 in the CP + device group. | <0.05 |
| LCI z-score | (7.312.9 –19.5) | (10.915.0 –50.0) n=18 in the CP + device group. | NS |
| FEV1, % predicted | 76.0±20.6 | 66.7±19.2 | <0.05 |
| FEV1, L | 2.4±0.9 | 1.9±0.8 | <0.05 |
| FVC, % predicted | 87.8±18.8 | 77.7±18.6 | <0.05 |
| FVC, L | 3.2±1.1 | 3.0±1.2 | <0.05 |
| FEV1/FVC, % | 86.8±10.2 | 77.0±14.1 | <0.01 |
| FEV1/FVC z-score | -1.58±1.07 | -2.42±1.14 | <0.02 |
| MEF25-75, % predicted | 58.7±28.2 | 38.0±24.9 | <0.01 NS |
| Pseudomonas aeruginosa, n (%) | 8 (33) | 13 (54) | |
| F508del homozygous, n (%) | 11 (46) | 14 (58) | NS |
| Pancreatic insufficiency, n (%) | 23 (96) | 23 (96) | NS |