
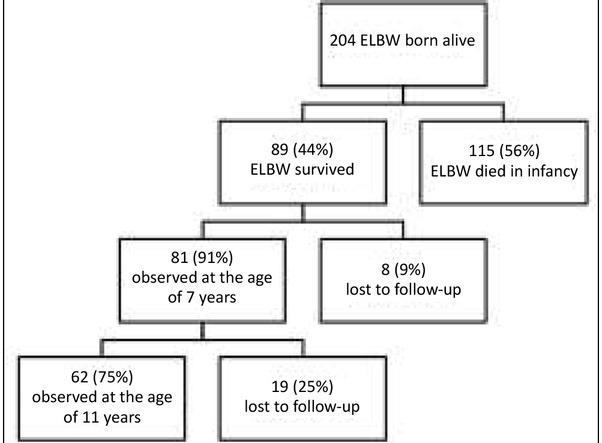
Fig. 1
Baseline characteristics of the study and control population (mean values and standard deviation)_ Tabela I_ Wyjściowa charakterystyka grupy badanej i grupy kontrolnej (dane wyrażone jako średnia i odchylenie standardowe)_
| Study group | Control group | p-value | |
|---|---|---|---|
| Gestational age (wk.) | 27.3 (2.3) | 39.8 (1.4) | <0.0001* (1) |
| Birth weight (g) | 843.4(132.4) | 3589.4(538.8) | <0.0001* (1) |
| Gender(boys/girls) | 21/41 | 19/17 | n.s. |
| Cesarean section | 43 | 5 | <0.0001* (2) |
| Infant Small for Gestational Age | 19 | 2 | 0.0045* (2) |
| Newborn – from 1st pregnancy | 23 | 23 | 0,048* (2) |
| Age at 1st assessment (year) | 6.61 (0.36) | 6.98 (0.83) | 0.03* (1) |
| Age at 2nd assessment (year) | 11.06 (0.38) | 10.62 (0.82) | 0.0004* (1) |
Analysis of anthropometric parameters and their comparison between the study group and control group at 11 years old_ (mean values and standard deviation)_ Tabela III_ Analiza parametrów antropometrycznych ocenianych w wieku 11 lat w grupie badanej i kontrolnej (dane wyrażone jako średnia i odchylenie standardowe)_
| Study group | Control group | p-value | |
|---|---|---|---|
| Height (cm) | 141.7 (7.83) | 146.26 (8.81) | 0.0118* (1) |
| Height z-score | -0.368 (1.135) | 0.65 (1.081) | <0.0001* (1) |
| Weight (kg) | 33.88 (8.315) | 40.45 (9.96) | 0.0013* (1) |
| Weight z-score | -0.592 (1.4) | 0.6634 (1.2) | <0.0001* (1) |
| Head circumference (cm) | 51.37 (2.24) | 54.02 (1.42) | <0.0001* (1) |
| Head circumference z-score | -2.05 (1.63) | -0.33 (0.86) | <0.0001* (1) |
| MUAC (cm) | 20.95 (2.96) | 22.85 (3.66) | 0.0097* (1) |
| Skinfold thickness at triceps (cm) | 1.172 (0.52) | 1.683 (0.7) | 0.0003* (1) |
| Skinfold thickness at triceps z-score | -0.253 (1.15) | 0.786 (1.123) | <0.0001* (1) |
| Waist circumference (cm) | 61.7 (8.95) | 67.,84 (11.14) | 0.0063* (1) |
| Waist circumference z-score | 0.264 (1.5) | 1.064 (1.41) | 0.0126* (1) |
| BMI (kg/m2) | 16.74 (3.26) | 18.72 (3.4) | 0.0058* (1) |
| BMI z-score | -0.628 (1.6) | 0.364 (1.37) | 0.0023* (1) |
Comparison of changes in values of anthropometric parameters taken at first at 7, and then at 11 years old in the study and control groups (mean values and standard deviation)_ Tabela IV_ Porównanie zmian parametrów antropometrycznych w okresie między 7 a 11 rokiem życia w grupie badanej i kontrolnej (dane wyrażone jako średnia i odchylenie standardowe)_
| Difference between 1st and 2nd examination - study group Różnica pomiaru pomiędzy pierwszym a drugim badaniem - grupa badana | Difference between 1st and 2nd examination - control group Różnica pomiaru pomiędzy pierwszym a drugim badaniem - grupa kontrolna | p-value Wartość p | |
|---|---|---|---|
| Height (cm) | 27.95 (15.35) | 21.74 (3.52) | 0.0026 *(1) |
| Height z-score | 0.35 (0.68) | 0.12 (0.33) | 0.0265*(1) |
| Weight (kg) | 14.2 (6.26) | 15.2 (5.74) | 0.4195 (1) |
| Weight z-score | 0.5 (1.02) | 0.24 (0.58) | 0.1118(1) |
| Head circumference (cm) | 1.54 (1.38) | 1.51 (0.71) | 0.9 (1) |
| Head circumference z-score | 0.117 (1.09) | 0.158 (0.44) | 0.7934 (1) |
| MUAC (cm) | 3.39 (2.16) | 3.56 (2.73) | 0.7466 (1) |
| Skinfold thickness at triceps (cm) | 0.41 (0.05) | 0.77 (0.57) | 0.0017 *(1) |
| Skinfold thickness at triceps z-score | 0.56 (0.97) | 1.01 (1.03) | 0.0393* (1) |
| Waist circumference (cm) | 10.23 (5.84) | 12.39 (7.35) | 0.1748 (1) |
| Waist circumference z-score | 1.03 (1.13) | 0.91 (0.165) | 0.6421 (1) |
| BMI (kg/m2) | 2.14 (2.19) | 2.64 (1.71) | 0.215 (1) |
| BMI z-score | 0.34 (1.07) | 0.42 (0.77) | 0.71 (1) |
Analysis of the anthropometric parameters and their comparison between the study group and the control group at 7 years old (mean values and standard deviation)_ Tabela II_ Analiza parametrów antropometrycznych ocenianych w wieku 7 lat w grupie badanej i kontrolnej (dane wyrażone jako średnia i odchylenie standardowe)_
| Study group | Control group | p-value | |
|---|---|---|---|
| Height (cm) | 113.749 (15.66) | 124.52 (7.39) | <0.0001* (1) |
| Height z-score | -0.722 (1.215) | 0.532 (0.934) | <0.0001* (1) |
| Weight (kg) | 19.47 (3.85) | 25.23 (5.35) | <0.0001* (1) |
| Weight z-score | -1.123 (1.38) | 0.39 (1. 186) | <0.0001* (1) |
| Head circumference (cm) | 49.81 (1.72) | 52.5 (1.33) | <0.0001* (1) |
| Head circumference z-score | -2.19 (1.33) | -0.377 (0.912) | <0.0001* (1) |
| MUAC (cm) | 17.51 (1.97) | 19.29 (2.675) | 0.0009* (1) |
| Skinfold thickness at triceps (cm) | 0.76 (0.29) | 0.92 (0.3) | 0.0144* (1) |
| Skinfold thickness at triceps z-score | -0.817 (0.98) | -0.191 (1.08) | 0.0065* (1) |
| Waist circumference (cm) | 50.14 (4.75) | 55.45 (6.56) | 0.0002* (1) |
| Waist circumference z-score | -0.836 (1.314) | 0.34 (1.38) | 0.0006* (1) |
| BMI (kg/m2) | 14.5 (1.98) | 16.16 (2.34) | 0.0007* (1) |
| BMI z-score | -0.999 (1.465) | 0.12 (1.334) | 0.0002* (1) |
Analysis of changes in lipid profile in period of time between 7 and 11 years old_ Tabela V_ Analiza zmian profilu lipidowego w okresie między 7 a 11 rokiem życia w grupie badanej i kontrolnej_
| Difference between 1st and 2nd examination - study group Różnica pomiaru pomiędzy pierwszym a drugim badaniem - grupa badana | Difference between 1st and 2nd examination - control group Różnica pomiaru pomiędzy pierwszym a drugim badaniem - grupa kontrolna | p-value | |
|---|---|---|---|
| LDL (mmol/l) | -0.25 | -0.24 | 0.9140 (1) |
| HDL (mmol/l) | 0.016 | 0.08 | 0.5500 (1) |
| TG (mmol/l) | -0.004 | 0.16 | 0.3000 (1) |
| Total Cholesterol (mmol/l) | -0.4 | -0.13 | 0.0530 (1) |