
1. Introduction
Permafrost areas cover approximately 24 % of the Northern Hemisphere's terrestrial surface (Zhang et al., 2003). In arctic and boreal regions, permafrost is a vital physical component with profound impact on natural ecosystems and human activity. Its occurrence is dependent on multiple parameters such as climate, topography, substrate, snow cover and availability of water and vegetation cover (Cheng, 2004). On top of the permafrost body is the active layer that is exposed to annual freeze and thaw cycles governed by surface warming or cooling. These annual processes influence thermal and hydraulic characteristics of the soil with consequent impact on the surface energy balance, moisture exchange, and ecosystem diversity and productivity.
During the 20th century, surface temperatures increased by 0.09 °C per decade in regions north of 60°N (McBean et al., 2005). Since the 1950s warming has accelerated and almost doubled compared to the rest of the globe (Stocker et al., 2013). Consequently, permafrost has warmed, active layer thickness has increased and land areas underlain by permafrost have started to decrease (Åkerman and Johansson, 2008; Romanovsky et al., 2010; Lawrence et al., 2012). Models based on the Representative Concentration Pathways (RCP) 4.5 scenario predict an average warming of 3.9 °C over Arctic land areas by the end of the century (Stocker et al., 2013) and the mean loss of permafrost area by the year 2100 is estimated to be 52±23 %, depending on greenhouse gas emission scenarios (Schaefer et al., 2014).
In northern Fennoscandia, lowland permafrost is mainly present in peat plateaus and palsas. Palsas are elevated hummocks with a core of permanently frozen peat and mineral soil, formed by frost upheaval. They mainly occur at the outer limit of the permafrost zone where the mean annual air temperature (MAAT) is just below 0 °C and precipitation is low (Seppälä, 1988). Embedded in multiple and interacting physical and biological processes, palsas and peat plateaus are highly sensitive to changes and serve as a distinct climate indicator (Callaghan et al., 2011). Already in mid-21st century, regional climate scenarios indicate substantial decrease by 97 % compared to the late-20th century distribution of peat plateaus (Bosiö et al., 2012). By the end of the century, palsas and peat plateaus are likely to disappear entirely over Fennoscandia (Fronzek et al., 2006), being replaced by wet fen ecosystems.
With respect to the stored carbon in frozen peat soils, much attention has been paid to the release of greenhouse gases to the atmosphere (Christensen et al., 2004; Bäckstrand et al., 2010; Lund et al., 2010; Schuur et al., 2015) and on the mobilisation of organic carbon into circumpolar freshwater systems (Guo et al., 2007; Frey and McClelland, 2009; Olefeldt and Roulet, 2012). However, there is very limited understanding of how permafrost degradation in subarctic peat plateaus and possible transformation into wet fen ecosystems affect the exchange of water and energy with the atmosphere since the basic contributors of the surface energy balance, that is, short- and long-wave radiation, sensible heat flux, latent heat flux and ground heat flux lack of direct measurements. Ongoing permafrost degradation also raises the question of how changes in the surface energy balance and evapotranspiration affect boundary layer structures, cloud formation, rainfall and, ultimately, land–atmosphere coupling. Consequently, this finite knowledge results in underrepresentation of the surface energy balance components in regional and global climate modelling.
Meteorological measurements and the eddy covariance method, a common tool to determine turbulent fluxes of sensible and latent heat over a specific ecosystem (Foken et al., 2012), were applied in 2013 at three peatland complexes (Stordalen, Storflaket and Torneträsk) in the lake Torneträsk region in northern subarctic Sweden to assess the impact of permafrost degradation on the partitioning of surface energy fluxes. The sites were chosen to represent three distinct characteristics of subarctic peatlands: (a) well-developed and extensive peat plateau (Storflaket), (b) rapid and substantial palsa decay and permafrost degradation (Torneträsk), and (c) wet fen with no permafrost left (Stordalen). All study sites have a comprehensive history of long-term ecosystem (Christensen et al., 2004; Bäckstrand et al., 2010; Olefeldt and Roulet, 2012) and permafrost monitoring (Åkerman and Johansson, 2008).
2. Methods
2.1. Study sites
We conducted our measurements during the year 2013 on three peatland complexes (Stordalen, Storflaket and Torneträsk) near Abisko (68°20′58″N, 18°49′49″E; elevation ~380 m) in northern subarctic Sweden. MAAT in Abisko for the period 1913–2003 is −0.7 °C, for the last decade (2002–2011) MAAT is +0.49 °C (Callaghan et al., 2013). A pronounced rain shadow effect causes low mean annual precipitation of only 304 mm for the period 1913–2003 (Johansson et al., 2006). In 2013, MAAT is 1.0 °C and annual precipitation reaches 369 mm. Storflaket peatland complex is located ~6 km, Stordalen ~10 km and Torneträsk ~40 km east of Abisko. The nearby large lake Torneträsk and the surrounding the Scandes create similar climatic conditions at all of our study sites; therefore, we consider the spatial distance between the peatland complexes to be negligible.
Three major habitats form our study sites (Johansson et al., 2006; Åkerman and Johansson, 2008): (a) dry ombrotrophic peat plateaus covered with low-growing dwarf shrubs, short sedges, lichens and barren soil; (b) tussock-forming sedges and Sphagnum mosses in wet hollows and depressions; and (c) wet Eriophorum angustifolium fen with stable water level near the ground surface. Tall shrubs, birch forests and heath vegetation are found in the surrounding areas of the peatland complexes. Stordalen and Storflaket are characterised by a well-developed and extensive peat plateau with polygonal cracks and sporadic ponds, while Torneträsk is dominated by small peat plateaus, several isolated dome-shaped palsas and earth hummocks (pounus). Palsas and peat plateaus at all study sites show varying stages of permafrost degradation but the decay is most pronounced in Torneträsk where the palsas have collapsed in large parts of the peatland complex within recent years.
2.2. Data collection
An eddy covariance system measured sensible heat fluxes (H) with a 3D wind anemometer uSonic-3 Scientific (Metek GmbH, Germany) at 2.0 m height during the year 2013 in a wet Eriophorum angustifolium fen in the Stordalen peatland complex. During the period 12 June 2013 to 31 August 2013, we installed a mobile tower at the peat complexes of Storflaket and Torneträsk, collecting fluxes of sensible heat (H) and latent heat (LE) with a 3D wind anemometer uSonic-3 Scientific (Metek GmbH, Germany) at 2.7 m height and an open-path infrared gas analyser LI-7500 (LI-COR Inc., USA) at 2.6 m height. Outputs from all high-frequency sensors were sampled at a rate of 10 Hz.
The balance between incoming and outgoing radiation at each location was obtained with a 4-component net radiometer CNR 4 (Kipp & Zonen B.V., The Netherlands). In Stordalen, the sensor was installed at a height of 4.0 m and on the mobile tower the sensor was mounted at a height of 2 m. At each location, ground heat flux (G) was measured with two soil heat flux plates HFP01 (Hukseflux Thermal Sensors B.V., The Netherlands) buried at 5 cm depth. According to the manufacturer, the typical accuracy (12-hour totals) of the heat flux plates ranges within −15 % to +5 %. Volumetric soil moisture was monitored with two soil moisture sensors SM 300 (Delta-T Devices Ltd., UK) buried at 5 and 25 cm depth and the sensors were calibrated for organic soil. Soil temperatures were measured by two thermistors Model 107 (Campbell Scientific Inc., USA) buried at 2 and 20 cm below the surface. The manufacturer-stated accuracy for the soil moisture sensors was ±2.5 % and ±0.1 °C for the soil temperature sensors. The soil sensors were installed approx. 5–10 m south-east of the mobile tower by cutting a section of peat out of the ground and inserting the sensors in the side of the exposed pit. Radiative components, ground heat fluxes, soil temperature and soil moisture were sampled every 10-second and averaged to 30-minute intervals. Raw data from all sensors was stored on a CR1000 data logger (Campbell Scientific Inc., USA).
Measurements at Storflaket and Torneträsk were divided into three sequences (12–26 June, 10–24 July and 7–31 August). Within each sequence we performed ~7 d of measurements at the well-developed peat plateau in Storflaket, afterwards we moved the installation to the collapsed peat plateau in Torneträsk were measurements continued for another ~7 d. In August, data collection lasted for 15 d at the latter site. Due to practical reasons the soil sensors were removed from the sites after each sequence and reinstalled at each study site in similar soil layers. However, for both collapsed peat plateau and peat plateau the relocation of the soil sensors within the respective study site had no distinct impact on the behaviour and magnitude of G, soil moisture and soil temperature.
2.3. Data analysis
Turbulent fluxes of H and LE were calculated with the EddyPro 4.2 software package (LI-COR Inc., USA) and averaged for 30-minute intervals. The following state-of-the-art corrections and processing steps were applied: spike removal, double rotation for anemometer tilt correction, covariance maximisation to compensate for time lag between the anemometer and the gas analyser, humidity correction of sonic temperature, block average detrending, high- and low-frequency spectral correction (Moncrieff et al., 1997, 2005) and WPL correction (Webb et al., 1980). Flux quality was assessed with quality flags (Foken et al., 2005) and only best quality fluxes with friction velocity (u * ) >0.1 m s−1 were used for the analysis. Ground heat flux (G) was corrected for heat storage between the soil surface and the heat flux plate. No gap-filling was applied for all parameters and thus only measured and quality checked data are shown. Flux differences between the peatland complexes were calculated by subtracting mean values of the peat plateau (Storflaket) from the mean values of the collapsed peat plateau (Torneträsk) or wet fen (Stordalen) in the corresponding global radiation (R G ) class. Midday data and derived parameters represent the time between 10:00 and 14:00 CET. Statistical tests were performed using RStudio 0.98 (RStudio Inc., USA).
2.4. Surface energy balance and derived parameters
The surface energy balance of the peatland complexes is composed of net radiation (R net ), H, LE and G, where positive R net and G are directed downward and positive H and LE are directed upward:
Bowen ratio (H/LE) and ratios of H/R net , LE/R net and G/R net assess the type and relative magnitude of the heat transfer from the surface.
The net radiation balance (R net ) was defined as the balance between incoming (RS↓) and reflected (RS↑) shortwave radiation and incoming (RL↓) and upwelling (RL↑) longwave radiation:
Ground heat flux at the surface was calculated by adding the stored energy in the layer above the heat flux plate (S) to the measured flux:
where ΔT s /Δt is the change in soil temperature (K) over time t (s), d is the heat flux plate installation depth (m) and C s is the soil heat capacity (J m−3 K−1) defined as:
where ρ b is the bulk density of 88 kg m−3 for the wet fen (Petrescu et al., 2008) and 118 kg m−3 for the peat plateau and collapsed peat plateau (Rydén et al., 1980), C d is the dry soil heat capacity of 840 J kg−1 K−1 (Hanks and Ashcroft, 1980), θ v is the volumetric soil water content (m3 m−3), ρ w is the water density (1000 kg m−3) and C w is the water heat capacity (4186 J kg−1 K−1).
The aerodynamic resistance (Re s. a , s m−1) determines the turbulent heat transfer from the surface and was defined as (Monteith and Unsworth, 2013):
where u is the wind speed (m s−1) and u * is the friction velocity (m s−1).
Surface resistance (Res. s , s m−1), as a measure to quantify the stomatal control in the canopy on the turbulent fluxes, was calculated as (Shuttleworth, 2007):
where Δ is the slope of the saturated vapour pressure curve (Pa K−1), γ is the psychrometric constant (Pa K−1), β is the Bowen ratio, ρ is the air density (kg m−3) c p is the specific heat capacity of air at constant pressure (J kg−1 K−1), D is the atmospheric vapour pressure deficit (Pa) and A is the available energy for evaporation (R net – G, W m−2).
The decoupling coefficient (Ω) (Jarvis and McNaughton, 1986) expresses the degree of interaction between Res. a and Res. s :
The decoupling coefficient varies from 0 to 1, where Ω close to zero indicates a strong coupling between the vegetation and the atmosphere, with vapour pressure deficit (VPD) being the main driver of LE, whereas Ω close to 1 suggest a decoupling of LE and VPD, with R net being the main driver for LE.
Priestley–Taylor coefficient (α) (Priestley and Taylor, 1972) was calculated as:
Over ocean and saturated land surfaces the dimensionless α equals to 1.26 but fluctuates depending on surface structure and meteorological conditions.
Radiative forcing (RF) (Schwaab et al., 2015) from differences in albedo (Δalbedo) was calculated as:
3. Results and discussion
3.1. Surface energy exchange and controlling parameters
Figure 1 shows the diurnal trend of the surface energy fluxes during the period June to August 2013 and Fig. 2 shows the mean heat fluxes in relation to global solar radiation (R G ). Overall, the peat plateau partitioned 42 % (59.2 W m−2) of net radiation (R net ) (141.0 W m−2) into latent heat, 32 % (45.1 W m−2) into sensible heat and 5 % (7.2 W m−2) into ground heat (Table 1). During low R G , H was lower than LE but increased more rapidly with increasing R G and exceeded LE for R G >~400 W m−2 (Fig. 2). This behaviour was also reflected in the Bowen ratio which increased monotonically, from 0.2 for the lowest R G class to 1.23 for the highest R G class (Fig. 3). The ground heat flux (G) was practically constant at a rate of ~5–10 W m−2 for all R G classes (Fig. 2).
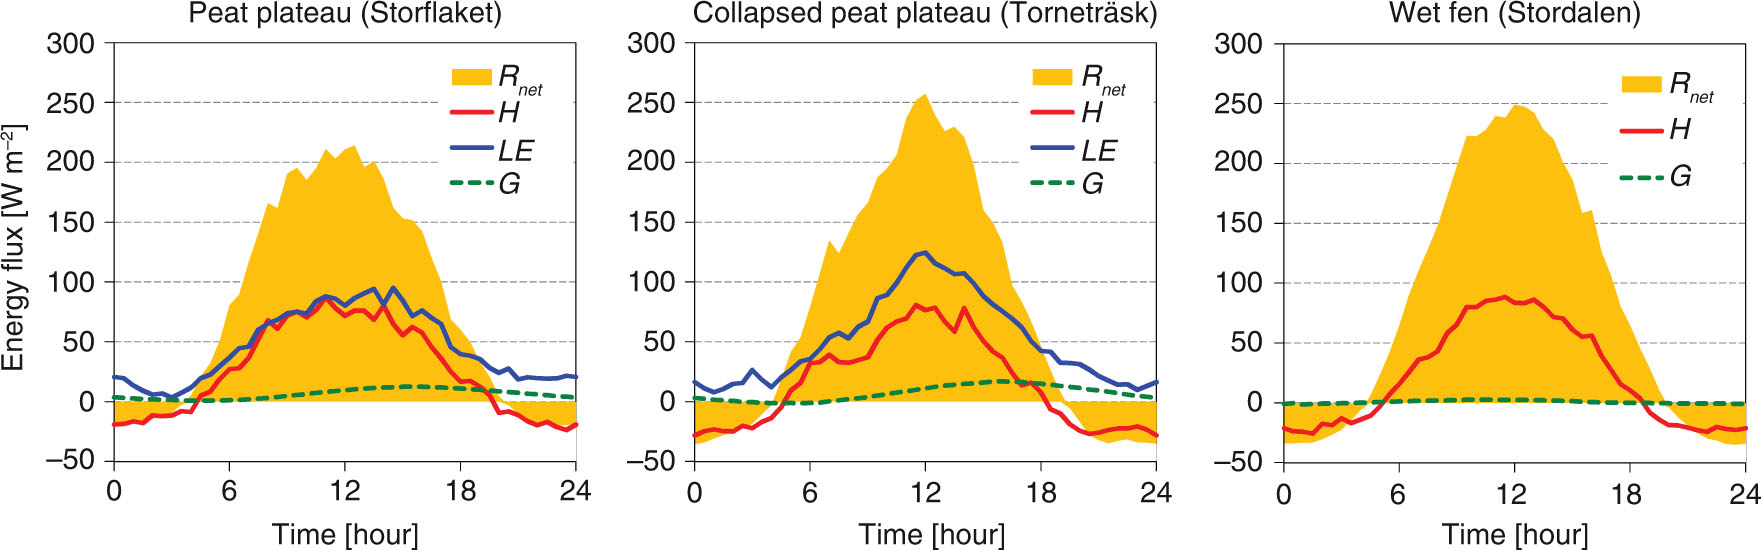
Fig. 1
Diurnal trend of surface energy fluxes. Measured mean net radiation (R net ), sensible heat flux (H), latent heat flux (LE) and ground heat flux (G) at the peat plateau (left), at the collapsed peat plateau (middle) and at the wet fen (right) during the period June–August 2013.
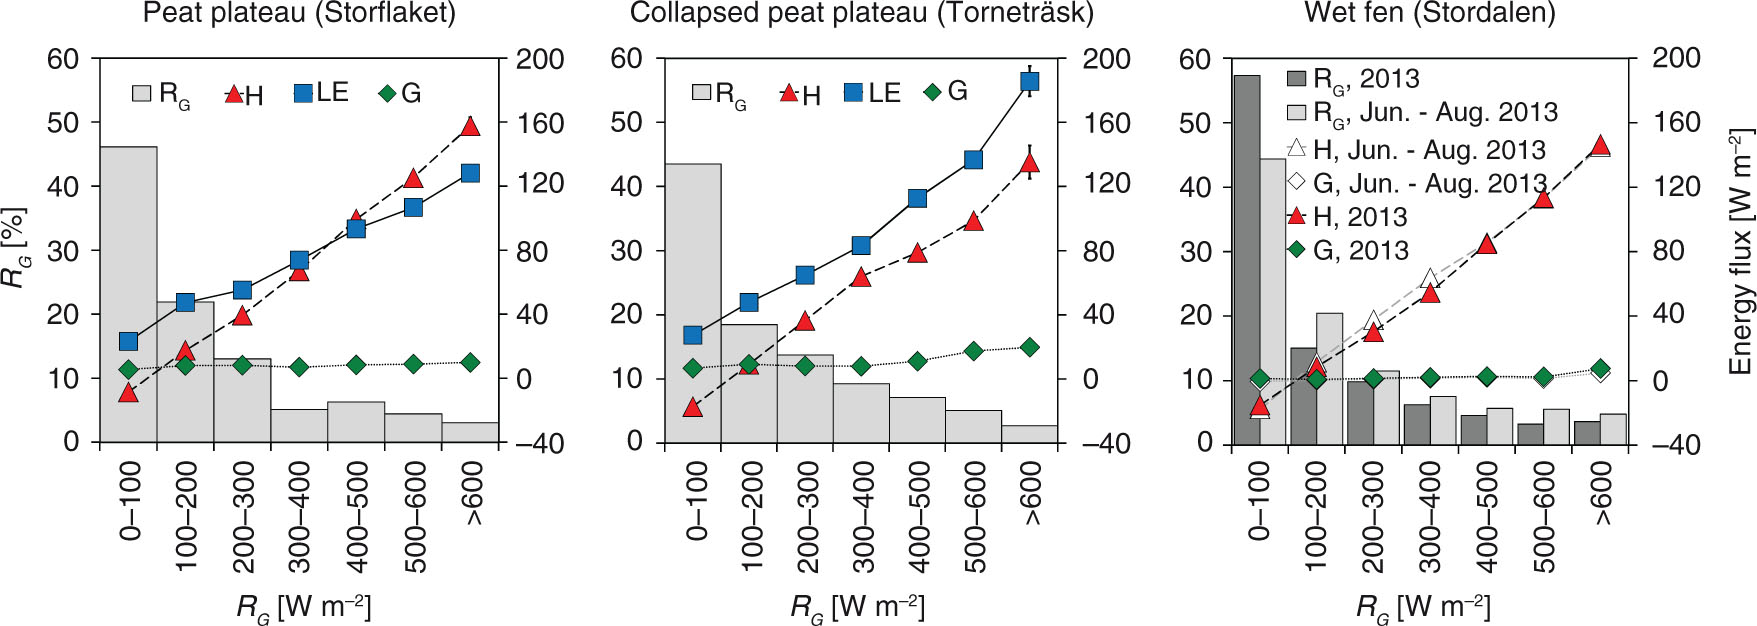
Fig. 2
Mean heat fluxes. Mean sensible heat flux (H), latent heat flux (LE) and ground heat flux (G) at the well-developed peat plateau (left), at the collapsed peat plateau (middle) and at the wet fen (right) in relation to the global solar radiation (R G ). Mean values represent the period June to August 2013 (Storflaket, Torneträsk, Stordalen) and the period January to December 2013 (Stordalen). The error bars represent the standard error. The histogram shows the distribution of the global solar radiation (R G ) in classes of 100 W m−2.
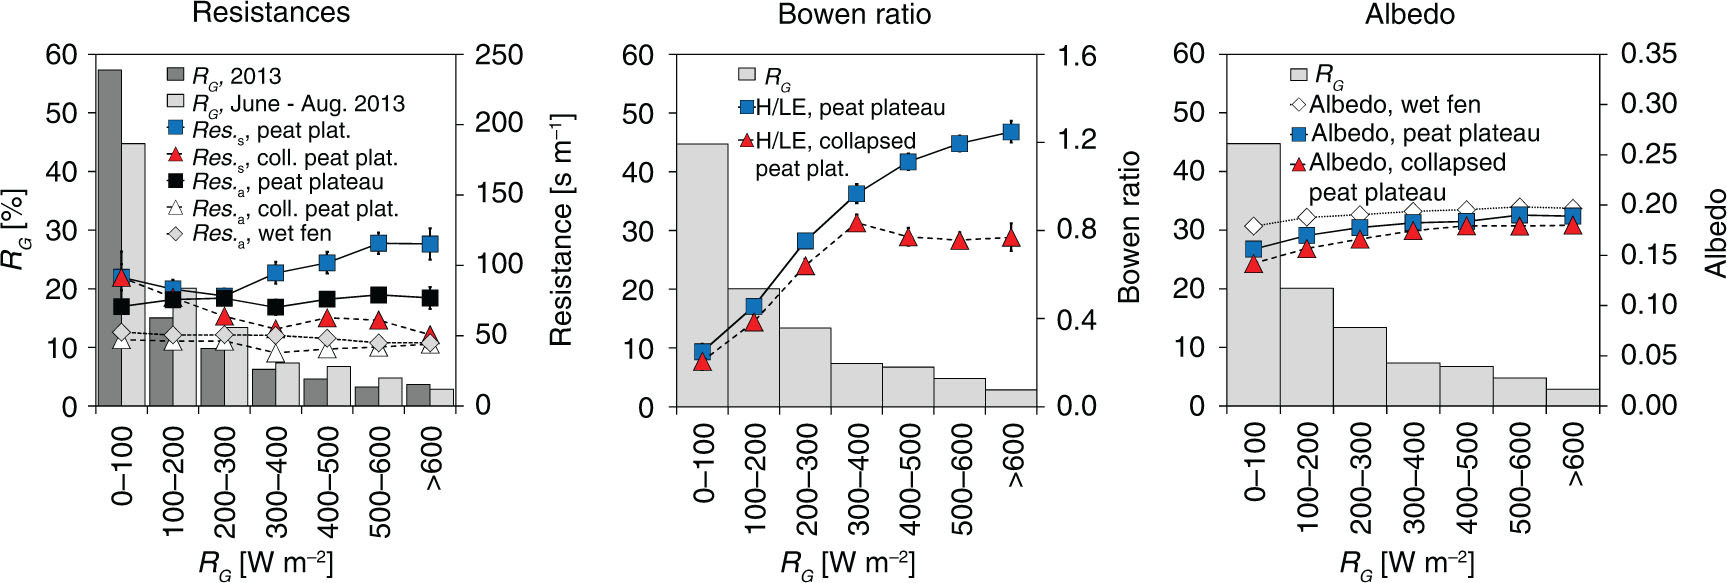
Fig. 3
Mean resistances, Bowen ratio and albedo. Mean surface resistance (Res. s ), atmospheric resistance (Res. a ), Bowen ratio (H/LE) and albedo at the three peatland complexes in relation to the global solar radiation (R G ). The error bars represent the standard error. The histogram shows the distribution of the global solar radiation (R G ) in classes of 100 W m−2.
Table 1. Energy balance and environmental characteristics
The collapsed peat plateau consumed 52 % (64.3 W m−2) of R net (124.2 W m−2) for latent heat, 22 % (27.8 W m−2) for sensible heat and 7 % (8.6 W m−2) for ground heat (Table 1). For all classes of R G , LE was consistently higher than H and both increased at about the same rates with increasing R G (Fig. 2). Bowen ratio changed from 0.2 for the lowest R G class to a peak of 0.8 when R G was in the range of 300–400 W m−2 (Fig. 3). The Bowen ratio was then relatively constant also for higher R G classes. Compared to the peat plateau, G at the collapsed peat plateau showed similar behaviour and magnitudes for R G <400 W m−2 but started to increase for R G >400–500 W m−2 and peaked at ~20 W m−2 for the highest R G class (Fig. 2).
At the wet fen, 25 % (29.5 W m−2) of mean June–August R net (116.4 W m−2) were partitioned into sensible heat and 1 % (1.3 W m−2) into ground heat (Table 1). No clear difference in H was observed between the period June to August and the entire year 2013 for R G >~400 W m−2 while intermediate values of R G (~100–400 W m−2) resulted in higher H during the summer compared to the entire year 2013 (Fig. 2). During June to August 2013, H at the wet fen showed similar magnitude compared to the collapsed peat plateau for R G <~400 W m−2 but exceeded H by ~18 W m−2 for R G >~400 W m−2. The ground heat flux (G) at the wet fen showed a constant increase with increasing R G but the magnitude of the flux remained low compared to the other peatland complexes (Fig. 2).
During the period June to August 2013 mean Bowen ratio was lower at the collapsed peat plateau (0.43) compared to the peat plateau (0.76). On both locations low R G (0–100 W m−2) induced negative H and heat transfer from the atmosphere to the surface whereas LE remained positive and an evaporative heat loss from the surface (Figs. 1 and 2). However, mean H and LE at the peat plateau were significantly different from mean H and LE at the collapsed peat plateau (p<0.05) while mean H at the collapsed peat plateau and wet fen did not significantly differ (p=0.48). For conditions of similar global radiative forcing LE was consistently higher at the collapsed peat plateau as compared to the peat plateau (Fig. 4). Sensible heat fluxes show a converse trend, with lowest H at the collapsed peat plateau as compared to the wet fen and peat plateau. The difference in the overall flux partitioning between the sites was most pronounced during strong energy forcing (R G >600 W m−2) when the mean evaporative flux at the collapsed peat plateau exceeded average LE at the peat plateau by 45 % (~57 W m−2). The opposite occurred for H, with mean fluxes being reduced by 7 % (~10 W m−2) compared to the wet fen and by 14 % (~22.5 W m−2) compared to the peat plateau (Fig. 4).
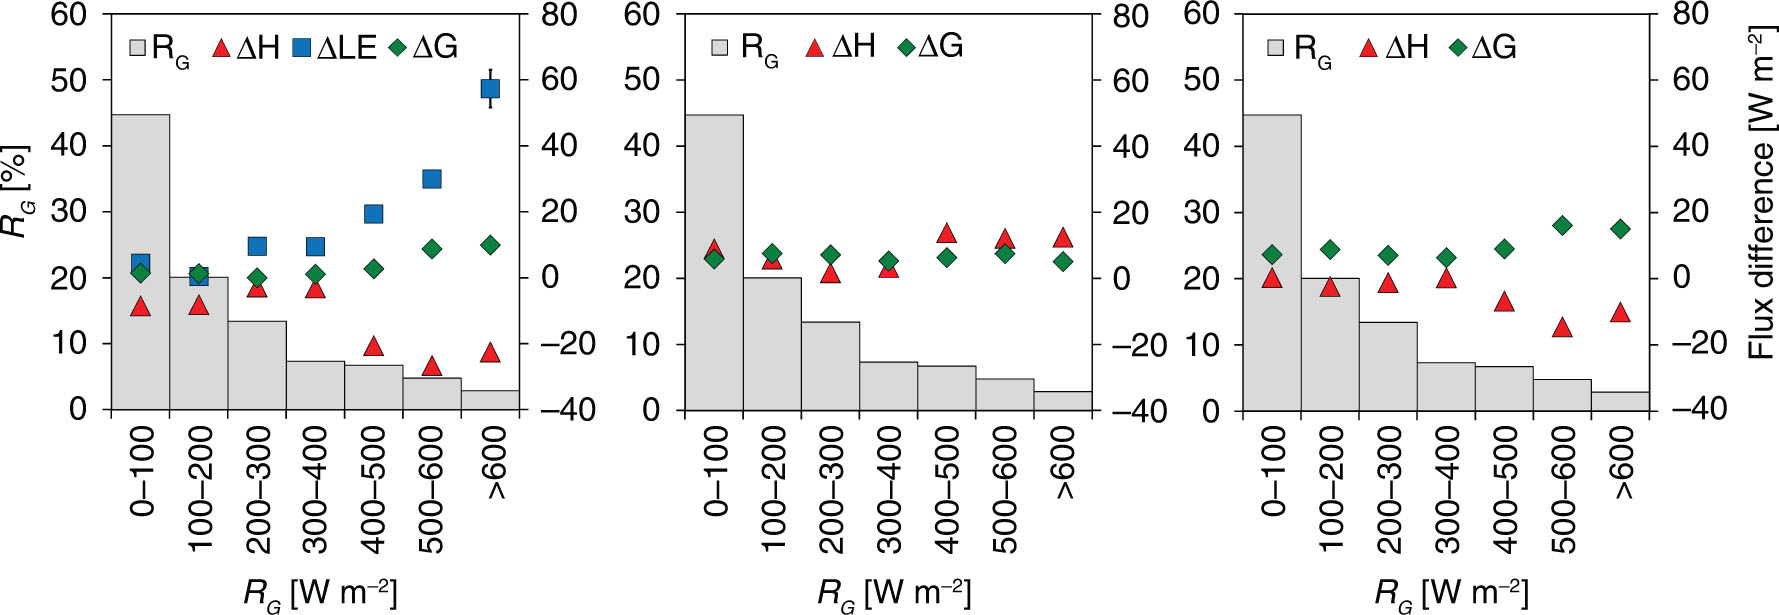
Fig. 4
Differences in heat fluxes. Differences of mean sensible heat fluxes (ΔH), latent heat fluxes (ΔLE) and ground heat fluxes (ΔG) between the collapsed peat plateau (Torneträsk) and the well-developed peat plateau (Storflaket) (left), between the well-developed peat plateau (Storflaket) and the wet fen (Stordalen) (middle), and between the collapsed peat plateau (Torneträsk) and the wet fen (Stordalen) (right) in relation to the global solar radiation (R G ). The error bars represent the standard error. The histogram shows the distribution of the global solar radiation (R G ) in classes of 100 W m−2.
Except for the lowest R G class, flux ratios of H to R net at the collapsed peat plateau and at the wet fen were consistently lower compared to the peat plateau while for R G >~100 W m−2 LE/R net showed a reverse trend with higher LE/R net at the collapsed peat plateau compared to the peat plateau (Fig. 5). The increase of H/R net with increased R G was more pronounced at the latter site and peaked at 0.41 compared to 0.31 at the collapsed peat plateau and 0.33 at the wet fen for the highest R G class. LE/R net decreased with increased R G but the decrease was more pronounced at the peat plateau where LE/R net ranged from 0.60 for the lowest R G class to 0.36 for the highest R G class compared to 0.53 and 0.45 at the collapsed peat plateau (Fig. 4). For all corresponding classes of R G flux ratios of G to R net were highest at the collapsed peat plateau and lowest at the wet fen (Fig. 4).
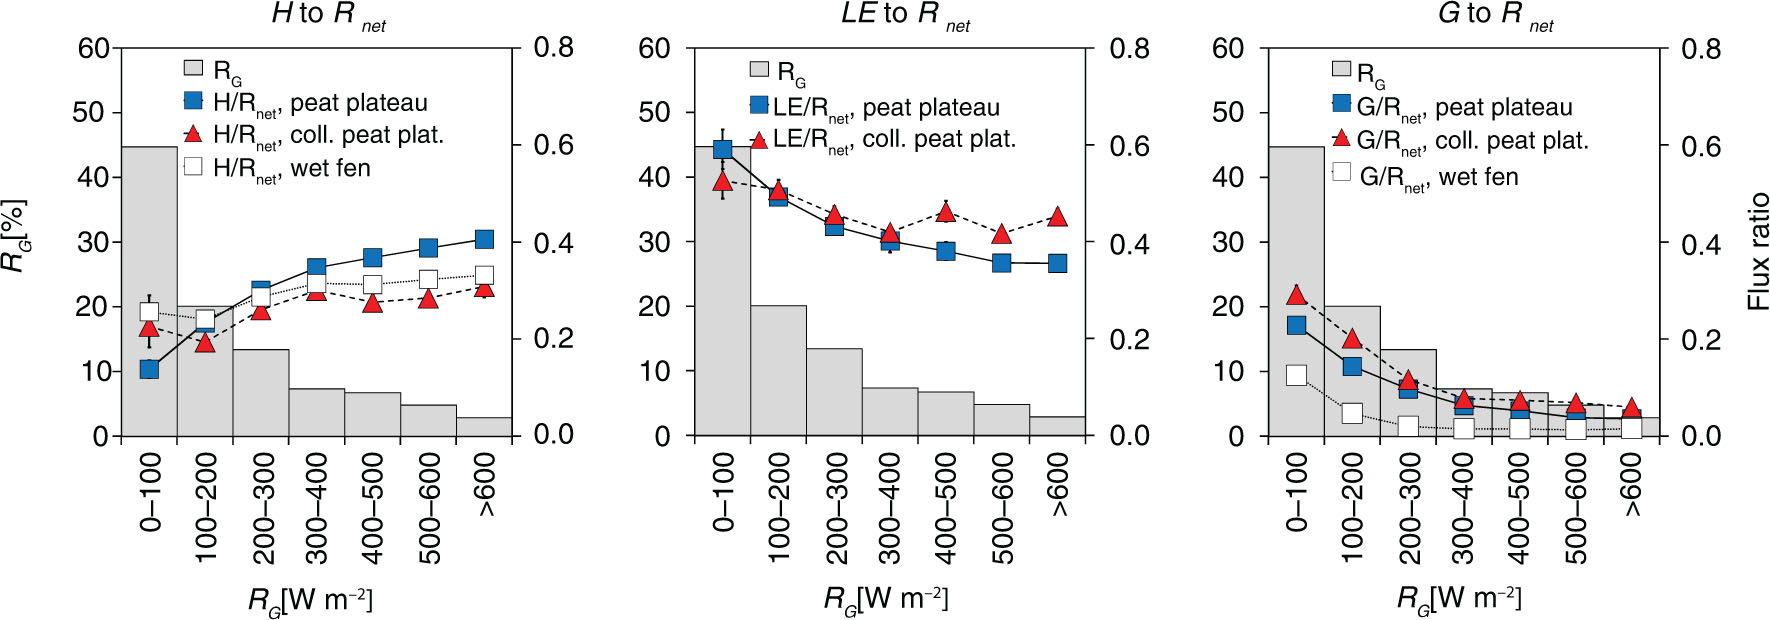
Fig. 5
Energy flux ratios. Mean ratios of sensible heat flux (H) (left), latent heat flux (LE) (middle) and soil heat flux (G) (right) to net radiation (R net ) at the well-developed peat plateau, collapsed peat plateau and wet fen in relation to the global solar radiation (R G ). The error bars represent the standard error. The histogram shows the distribution of the global solar radiation (R G ) in classes of 100 W m−2.
By analysing the controlling factors of evapotranspiration (ET) and LE we obtain better insights on the interplay between the energy balance of the peatland complexes and climatic and ecological factors. Soil moisture content was relatively low at the peat plateau (~46 % volumetric) and differed significantly (p<0.01) compared to the collapsed peat plateau and wet fen where the water table was at the surface and the soil was water-saturated (>85 % volumetric) over the entire measurement period. The observed aerodynamic resistances (Fig. 3), with higher resistances for the peat plateau (73.2 sm−1) compared to the collapsed peat plateau (45.1 sm−1) and the wet fen (48.1 sm−1), were relatively constant over the entire observation period and appeared to be independent of R G and R net . Thus, the difference in aerodynamic resistance is likely caused by differences in surface roughness between the three sites. Compared to the peat plateau, the surface of the collapsed peat plateau shows a higher proportion of free water and mosses which, unlike vascular plants, limit the ability to transfer moisture during high atmospheric demands. Applying the concept of surface resistance to our study locations is therefore difficult since it neglects the contribution of non-vascular plants and open water (Kasurinen et al., 2014). However, we observe higher surface resistance at the peat plateau (92.9 sm−1) compared to the collapsed peat plateau (65.6 sm−1) and a different behaviour of the surface resistance in relation to R G . At the collapsed peat plateau, the surface resistance decreases from ~91 s m−1 for the lowest R G class to ~45 s m−1 for the highest R G class while at the peat plateau, the surface resistance decreases from ~91 s m−1 for R G >100 W m−2 to ~77 s m−1 for intermediate values of R G (200–300 W m−2), followed by a steady increase in surface resistance to ~115 s m−1 for R G >600 W m−2 (Fig. 3).
Mean Ω-value of 0.57 at the peat plateau and 0.53 at the collapsed peat plateau (Table 1) indicate a stronger control of LE by net radiation at the peat plateau compared to the collapsed peat plateau. As a direct consequence, the observed mean atmospheric vapour pressure deficit (VPD) of ~334 Pa at the peat plateau and ~363 Pa at the collapsed peat plateau generally favour LE and evapotranspiration at the latter site. However, although ET was higher at the collapsed peat plateau (~2.3 mm d−1) compared to the peat plateau (~2.1 mm d−1) both locations show suppressed ET of α=0.98 and α=0.93, respectively, below its potential rate of α~1.26. We suggest that the limiting factors for LE and ET at the peat plateau were mainly soil moisture content, VPD and surface resistance. At the collapsed peat plateau, a higher proportion of non-vascular plants limited ET but VPD, surface resistance and soil moisture content generally promoted LE and ET.
The differences in radiation budget are difficult to interpret since the longwave components are sensitive to temperature (air and surface) and air humidity. However, albedo (Fig. 3) is only dependent on surface structure and vegetation composition and here we found small but significantly lower albedo for the collapsed peat plateau, 0.179, as compared to 0.187 for the peat plateau but significantly higher values for the wet fen (0.191) (p<0.05). Compared to the wet fen, the differences in albedo over the summer were manifested in an enhanced radiative forcing of 1.75 W m−2 at the peat plateau and 3.26 W m−2 at the collapsed peat plateau. We suggest that due to rapid permafrost degradation moisture-limited plant communities at the collapsed peat plateau are incapable of adapting to the new moisture regime, resulting in a higher proportion of Sphagnum mosses and barren peat with lower albedo. Albedo at the peat plateau and the wet fen, however, results from plant communities which are well-adapted to the moisture regime.
3.2. Energy balance closure
Figure 6 shows the comparison between the available energy (R net – G) and the turbulent heat fluxes (H+LE) at the peat plateau in Storflaket and at the collapsed peat plateau in Torneträsk. The observed slopes and intercepts were 0.69 and 11.6 W m−2 in Storflaket and 0.67 and 12.2 W m−2 in Torneträsk. Similar energy balance closures were reported from other ecosystems with comparable heterogeneity and availability of water (Wilson et al., 2002; Stoy et al., 2013). However, the energy balance closures at our two study sites, with a gap of 31 % in Storflaket and 33 % in Torneträsk, are on the lower range of observed closures and possible reasons are manifold: The soil–atmosphere boundary is characterised by the concentration of the incoming radiative flux through the slowly dissipating ground heat flux and the rapid turbulent heat dispersion through sensible and latent heat. This opposite behaviour, together with different atmospheric and subterrestrial temperature gradients and varying time scales of fluctuations might impact the energy balance closure, especially on heterogeneous surfaces (Gentine et al., 2012).
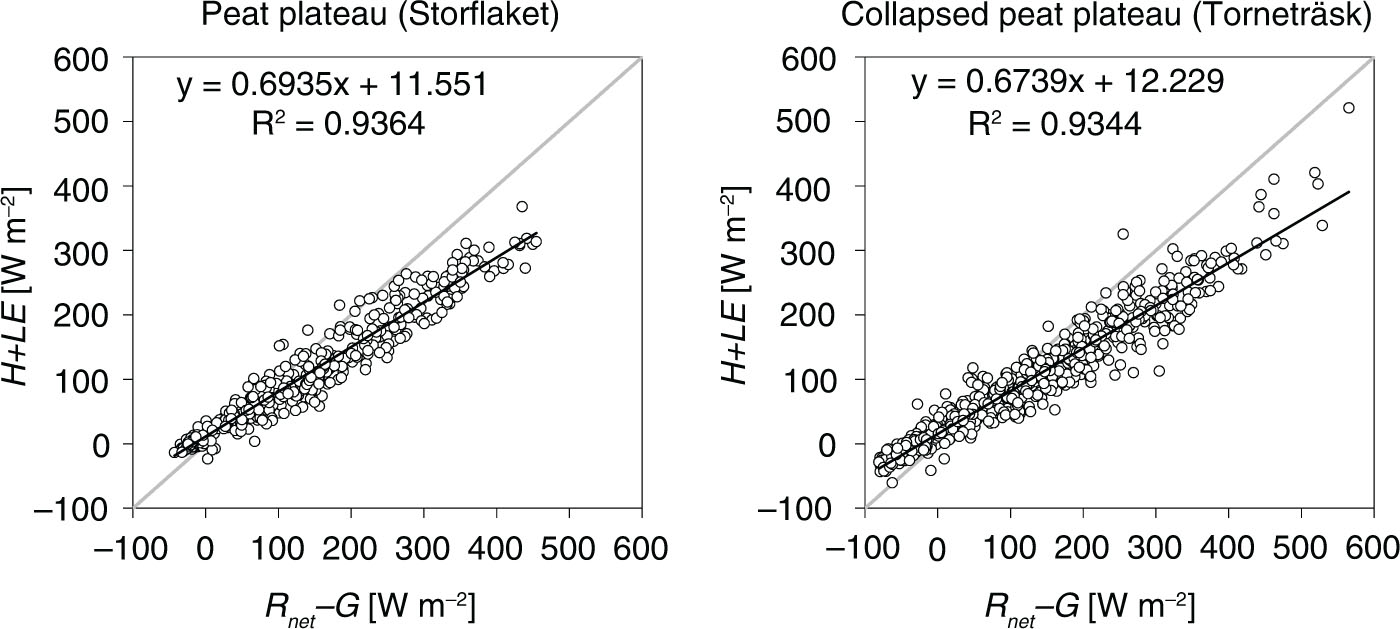
Fig. 6
Energy balance closure. Balance between the turbulent fluxes of sensible and latent heat (H+LE) and the available energy (R net – G) at the peat plateau (left) and at the collapsed peat plateau (right).
Another common problem is the mismatch between the footprint of the turbulent heat fluxes and the measurements of radiation components and ground heat fluxes (Foken, 2008). Therefore, the turbulent heat flux measurements were analysed for their representation of the respective peatland complex. The results from footprint analysis (Kljun et al., 2004) revealed that although the turbulent heat fluxes in Stordalen sourced from a large footprint area, the dominant wind directions weighted the flux footprint towards the dry and elevated parts of the peat plateau where sporadic ponds were completely absent. In Torneträsk, the flux footprint stretched over a small peat plateau and over the wetter parts of the peatland complex which are characterised by several isolated dome-shaped palsas. The flux footprint at the fen in Stordalen showed a good representation of the study site. In southeastern directions and towards west of the eddy covariance tower the flux footprint stretched into areas with individual growth of stunted birch trees. Thus, we are confident that at all our three study sites the observed fluxes are representative for the respective type of peatland complex.
Uncertainties in the true magnitude of available energy at the surface are likely attributed to possible underrepresentation of the ground heat flux (G). The true G might alter from the measured flux due to differences in the thermal conductivity of the heat flux plate and the surrounding soil (van Loon et al., 1998), errors in soil temperature measurements (Liebethal et al., 2005) and lateral heat transfer above the soil heat flux plate (Guo and Sun, 2012). At our study sites in Storflaket and Torneträsk ground heat flux plates, soil moisture sensors and soil temperature sensors were removed after each sequence of measurements due to practical reasons. Although we reinstalled the sensors at each study site in similar soil layers the determination of G might be influenced by the disturbance of the soil. However, despite these limitations in the assessment of G we are confident that at each of our three study sites the measured surface energy balance components are adequately represented.
4. Summary and conclusion
In this study we compared the surface energy balance and its controlling factors of three subarctic peatland complexes in the lake Torneträsk area in northern Sweden. We observed that ongoing permafrost thaw and related degradation of peat plateaus resulted in distinctly different partitioning of the turbulent fluxes of sensible heat and latent heat. If these documented differences in the surface energy budget of peatland complexes are applicable to similar ecosystems in the Arctic we may see a shift in the regional climate system to a regime dominated by larger rates of ET, increased heat loss by LE and a growing importance of atmospheric vapour pressure for the control of LE. The increase in air temperature over the Arctic results in higher water vapour saturation pressure and in an enhanced ability of the lowermost layer of the atmosphere to hold more water vapour (Raupach, 2001). Our measurements indicate that water-saturated and degraded peat plateaus act as a strong source to compensate for the atmospheric demand of water vapour since ET and LE increase in response to higher soil moisture content. If the soil remains water-logged, the degraded peat plateaus may experience a further shift in vegetation composition towards wet fen ecosystems with wet-growing vascular plants and a higher ability of transpiration (Bosiö et al., 2012; Pearson et al., 2013) compared to well-developed peat plateaus.
Thus, we conclude that changes in the surface energy budget of peatland complexes towards accelerated fluxes of LE and ET are of great importance for the climate system. The closely linked energy, carbon and water cycles in the Arctic may experience substantial changes and feedback processes are expected to play a more dominant role in the future Arctic climate. We therefore believe that modelling tools focusing on the effects of thawing permafrost on the global climate and Earth system will benefit from incorporating our study results of the surface energy budget of peat plateaus.
5. Acknowledgements
We thank Abisko Scientific Research Station for facilitating logistics and fieldwork in the lake Torneträsk area. This work forms part of the Nordic Centre of Excellence DEFROST.