
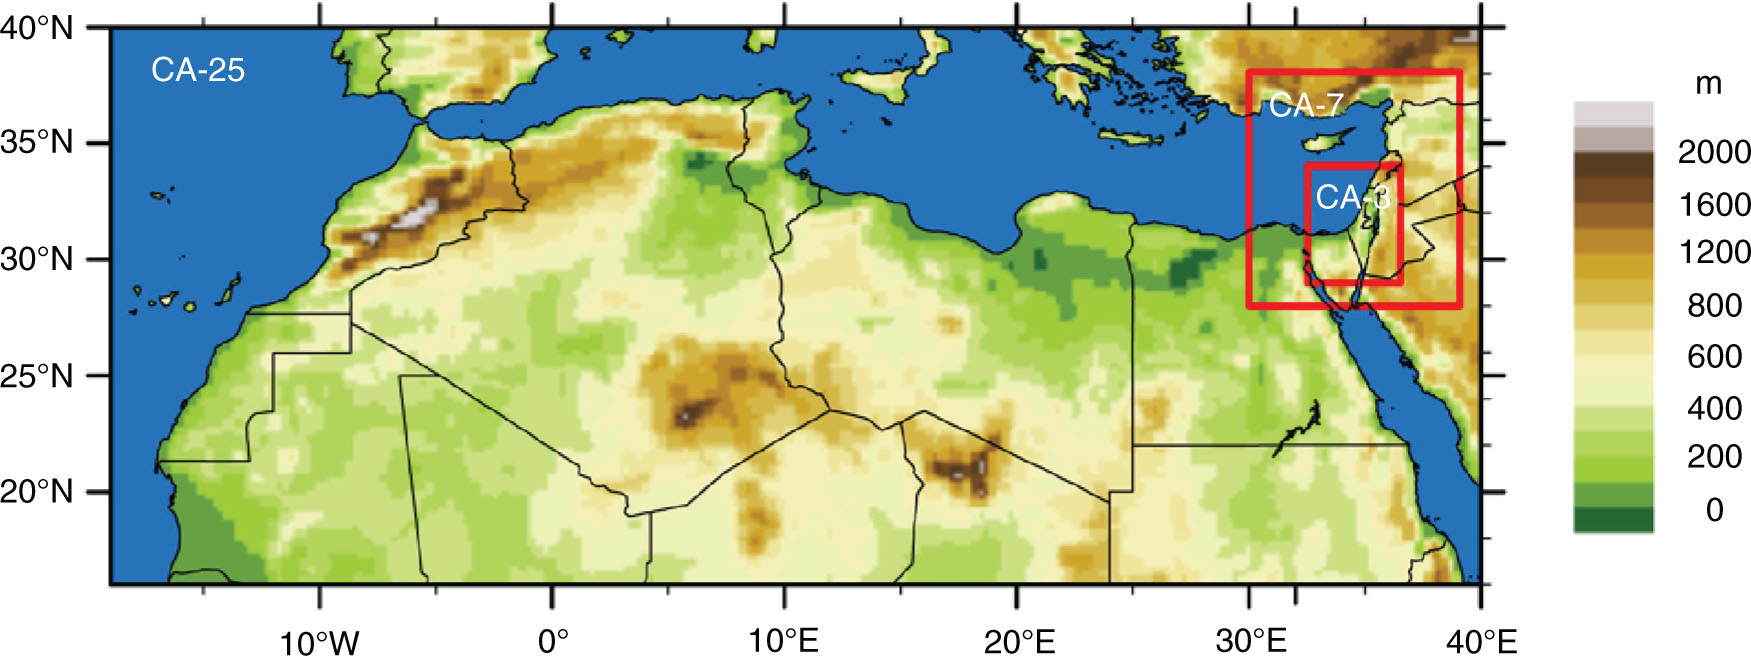
Fig. 1
Map of the three COSMO-ART model domains CA-25, CA-7 and CA-3. The colours indicate the model terrain height.
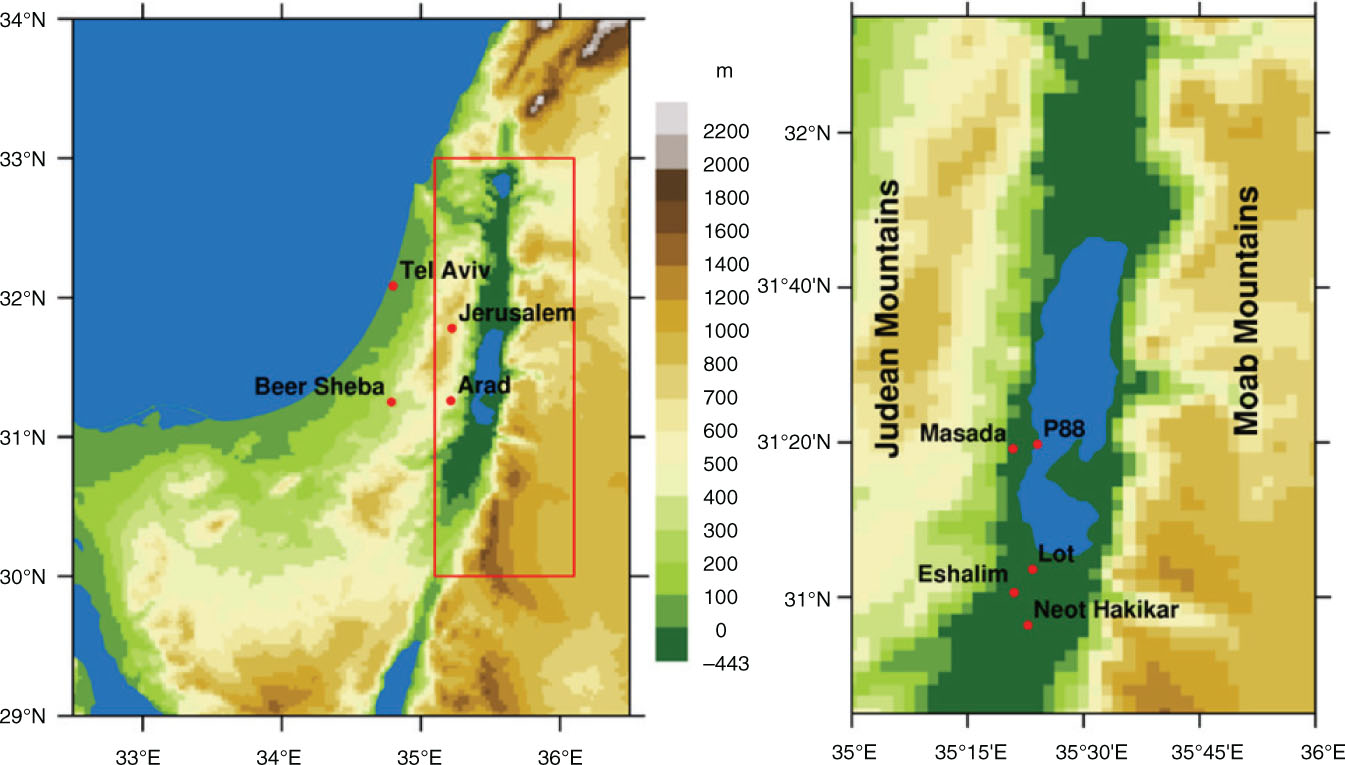
Fig. 2
Left: CA-3 simulation domain and the positions of measurement stations outside of the Dead Sea valley. The red box shows domain of the additional simulations S2 and S3 (Table 2). Right: Same as left with zoom in on the Dead Sea region and the positions of the measurement stations. The colours indicate the model terrain height.
Table 1. TSP and PM10 monitoring sites together with meteorological stations are shown. The maximal measured surface aerosol concentration (C) on 22 March 2013, is given together with the annual 5 %, 50 %, and 95 % percentiles of surface aerosol concentration in the year 2013 (P5, P50, and P95) at the specified monitoring sites. Hourly TSP and PM10 data from January to December 2013 were used. For the station Jerusalem, 3-hourly data are presented
Arad (PM10)31.26 °N; 35.22 °E3381222018Beer-Sheba (PM10)31.25 °N; 34.78 °E15361182806Tel Aviv (PM10)32.11 °N; 34.80 °E16361271064Jerusalem (PM10)31.78 °N; 35.22 °E14371695785Eshelim (TSP)31.01 °N; 35.35 °E15532147149Lot (TSP)31.06 °N; 35.39 °E12421796672Neot Hakikar (TSP)30.94 °N; 35.38 °E16512176478Masada (meteo)31.32 °N; 35.35 °E*P88 (meteo)31.33 °N; 35.40 °E*Jerusalem (meteo)31.78 °N; 35.22 °E*
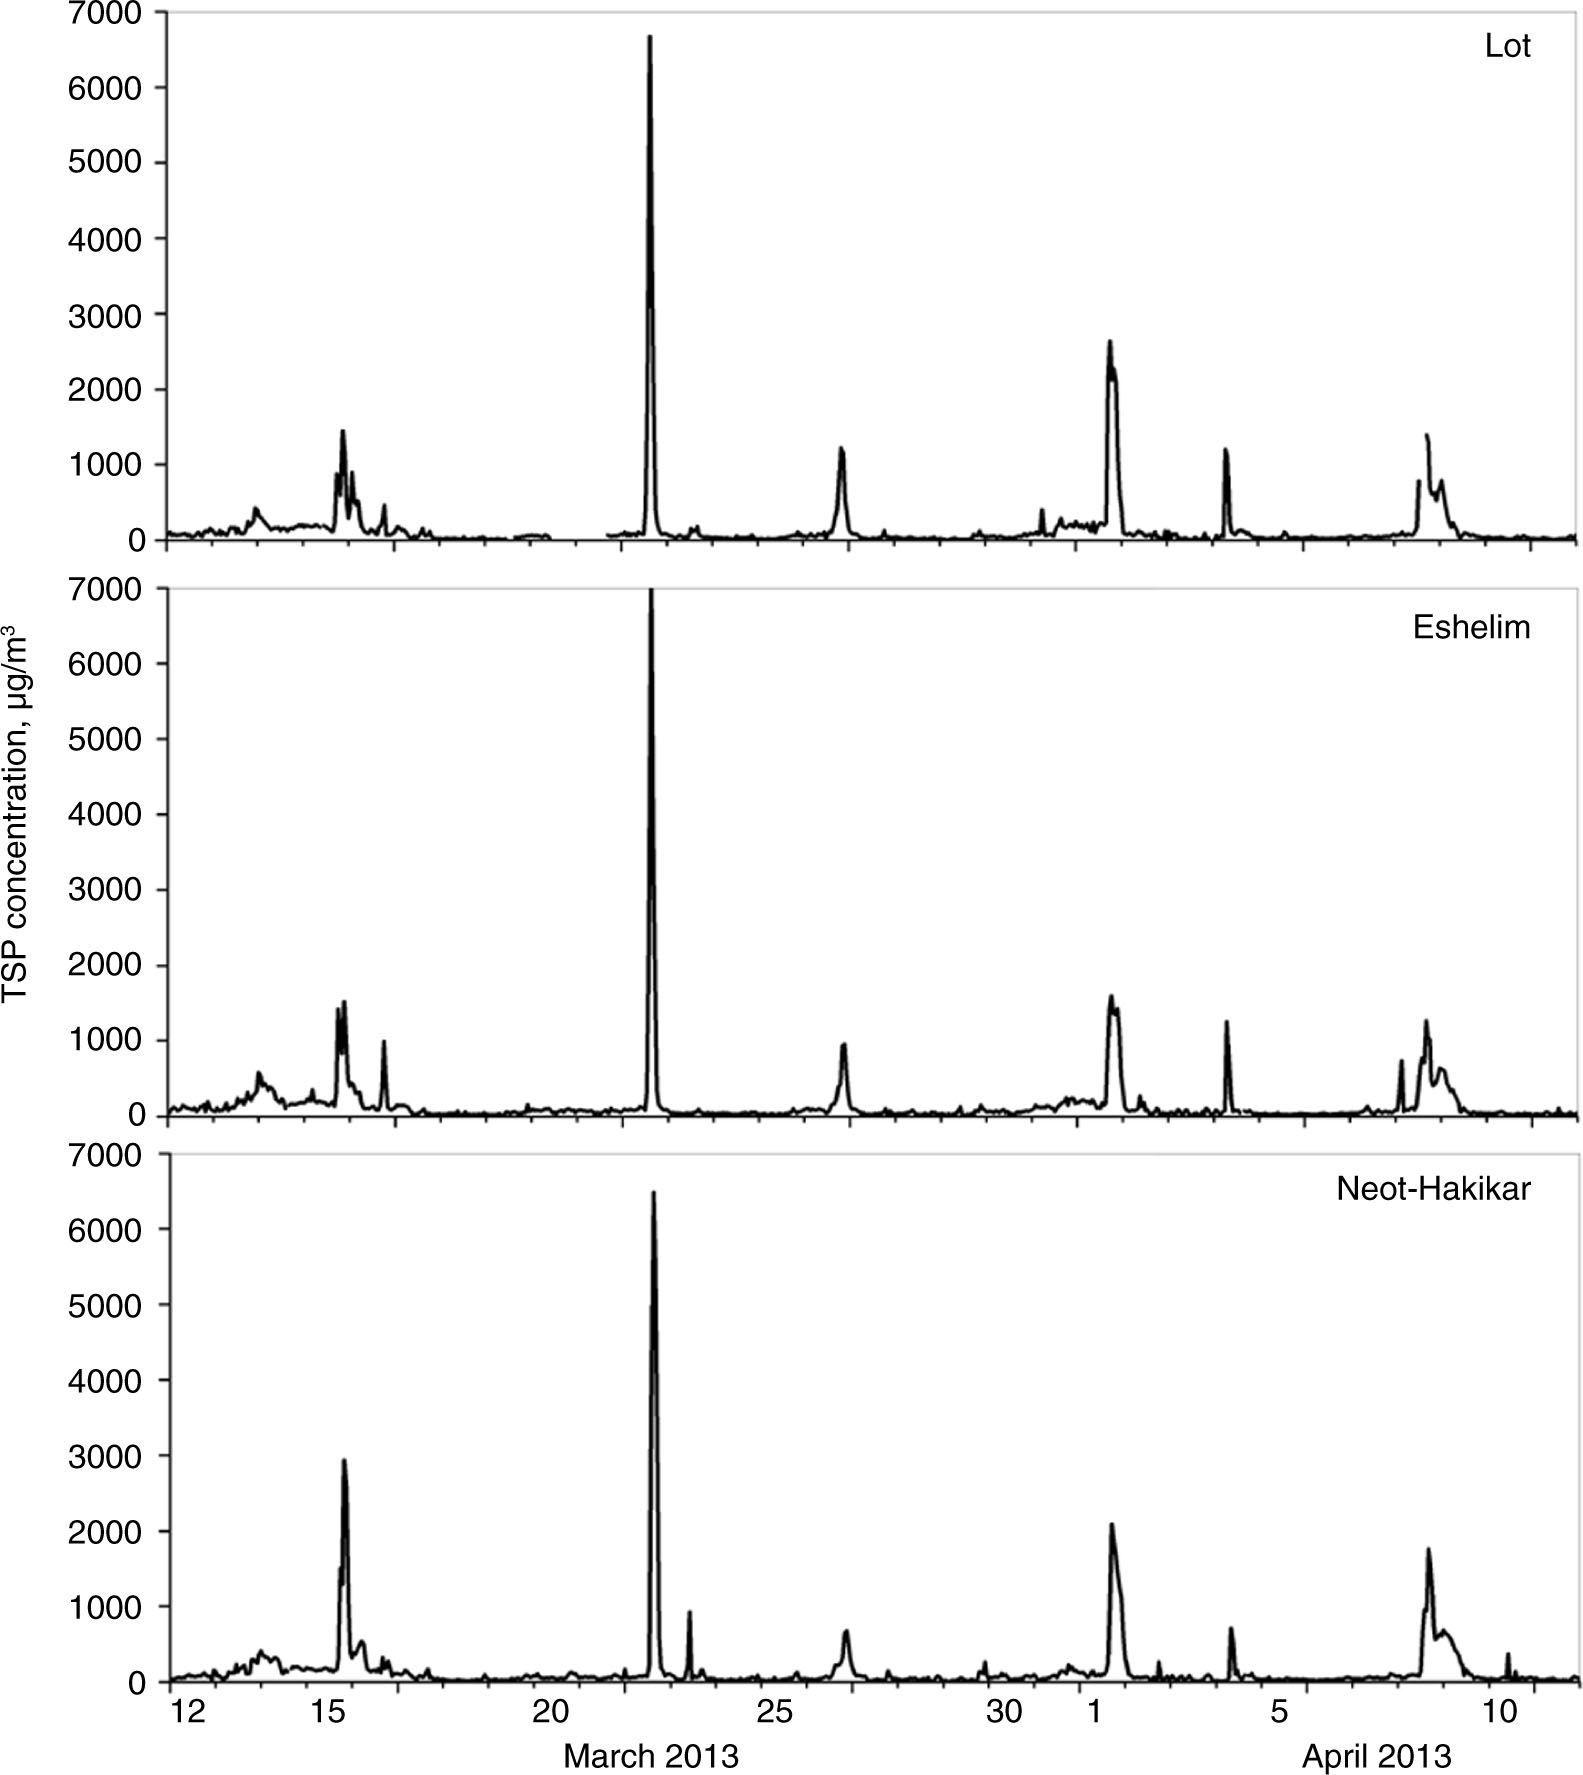
Fig. 3
Time series of hourly concentration measurements of total suspended particles (TSPs) during the 32-d period from 12 March to 11 April 2013, at three stations in the Dead Sea valley.
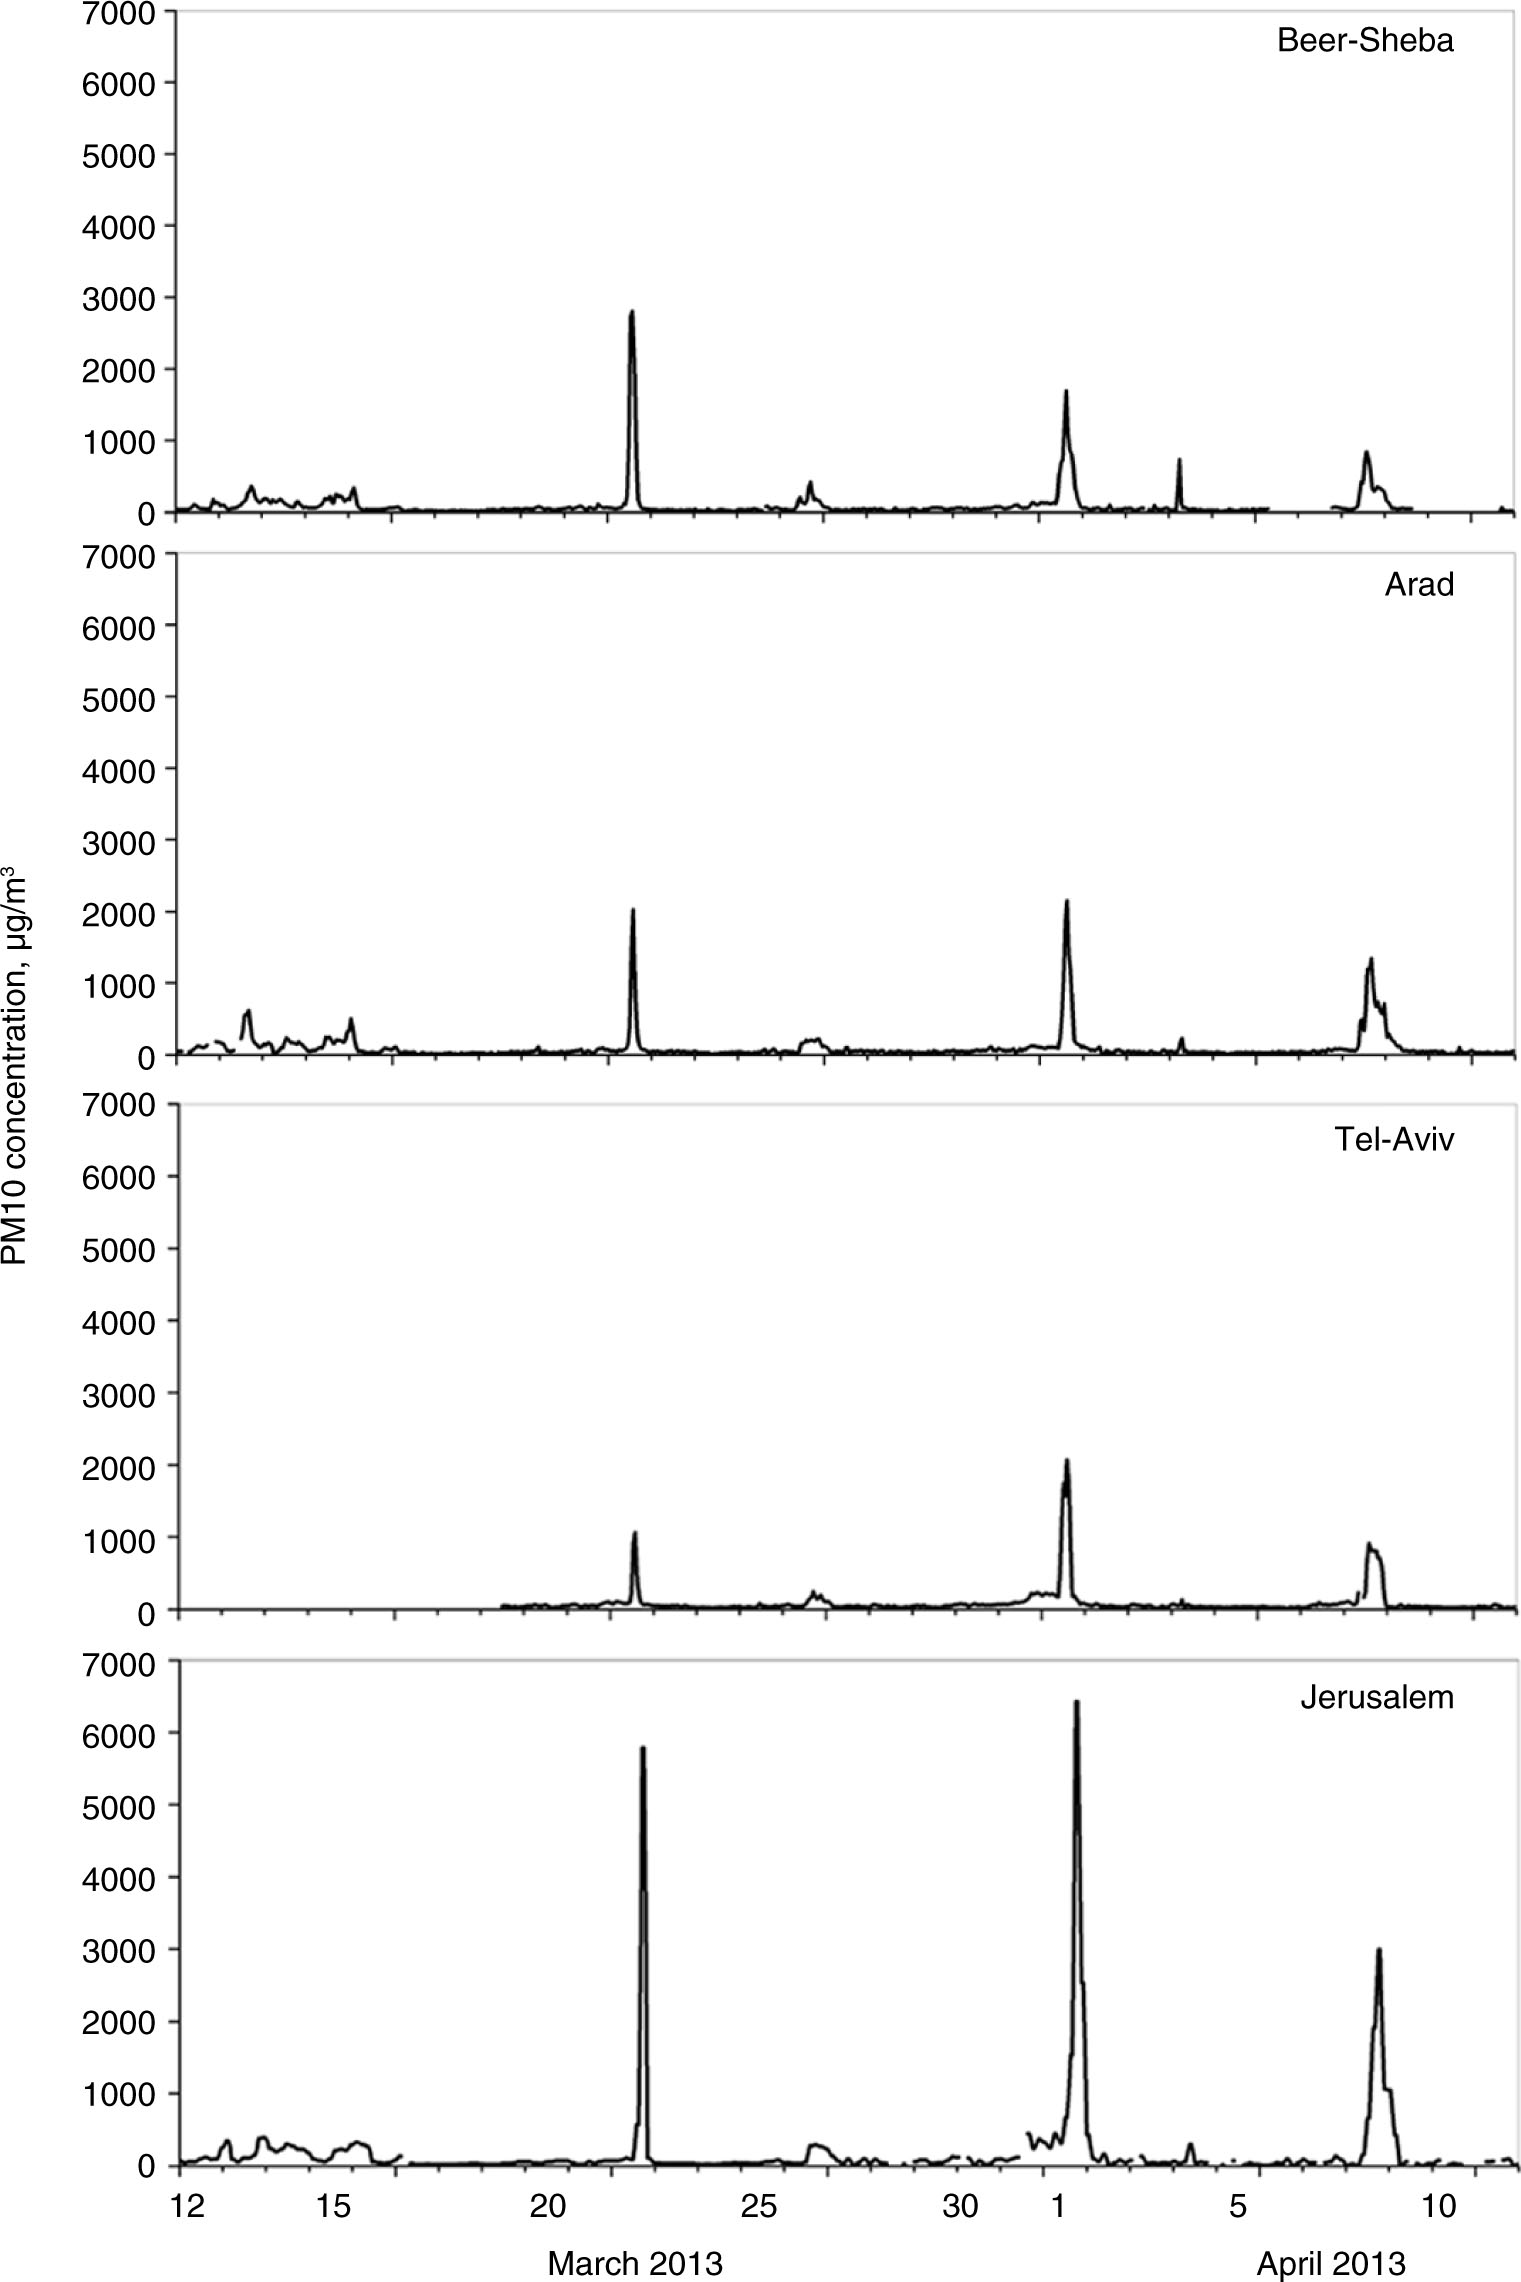
Fig. 4
Time series of hourly PM10 measurements at four stations outside the Dead Sea valley are shown during the 32-d period from 12 March to 11 April 2013. At the Jerusalem site, PM10 measurements are presented as 3-hour averaged data.
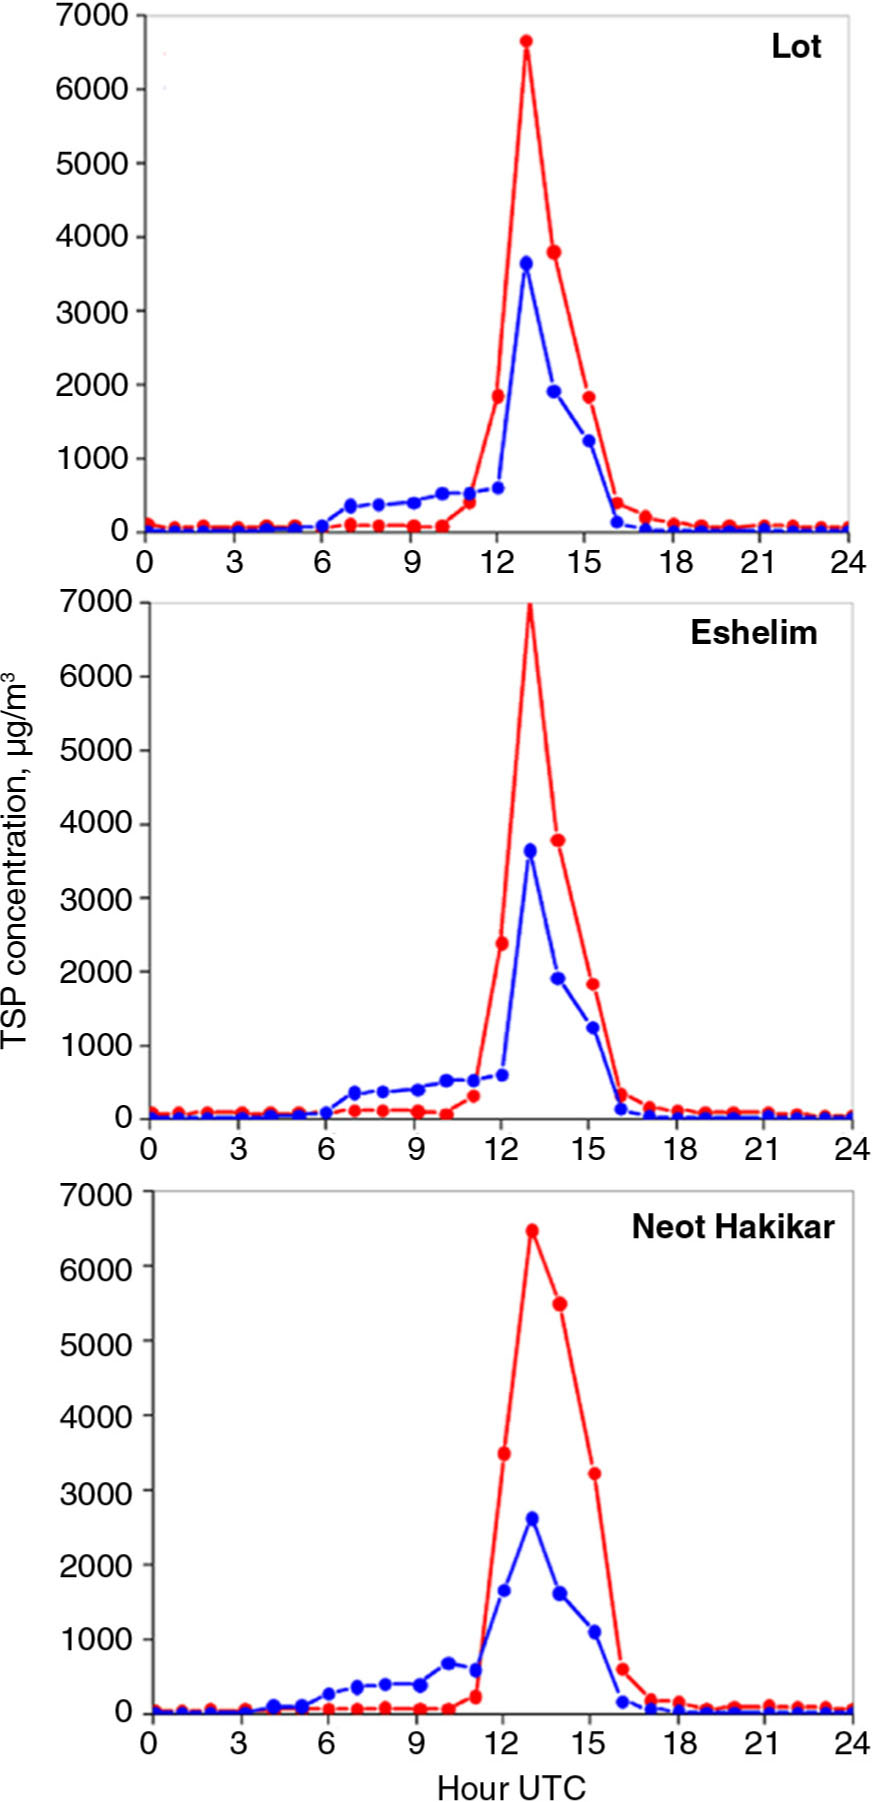
Fig. 5
Surface TSP concentrations: COSMO-ART model results (blue) and observations (red) on 22 March 2013, are shown.
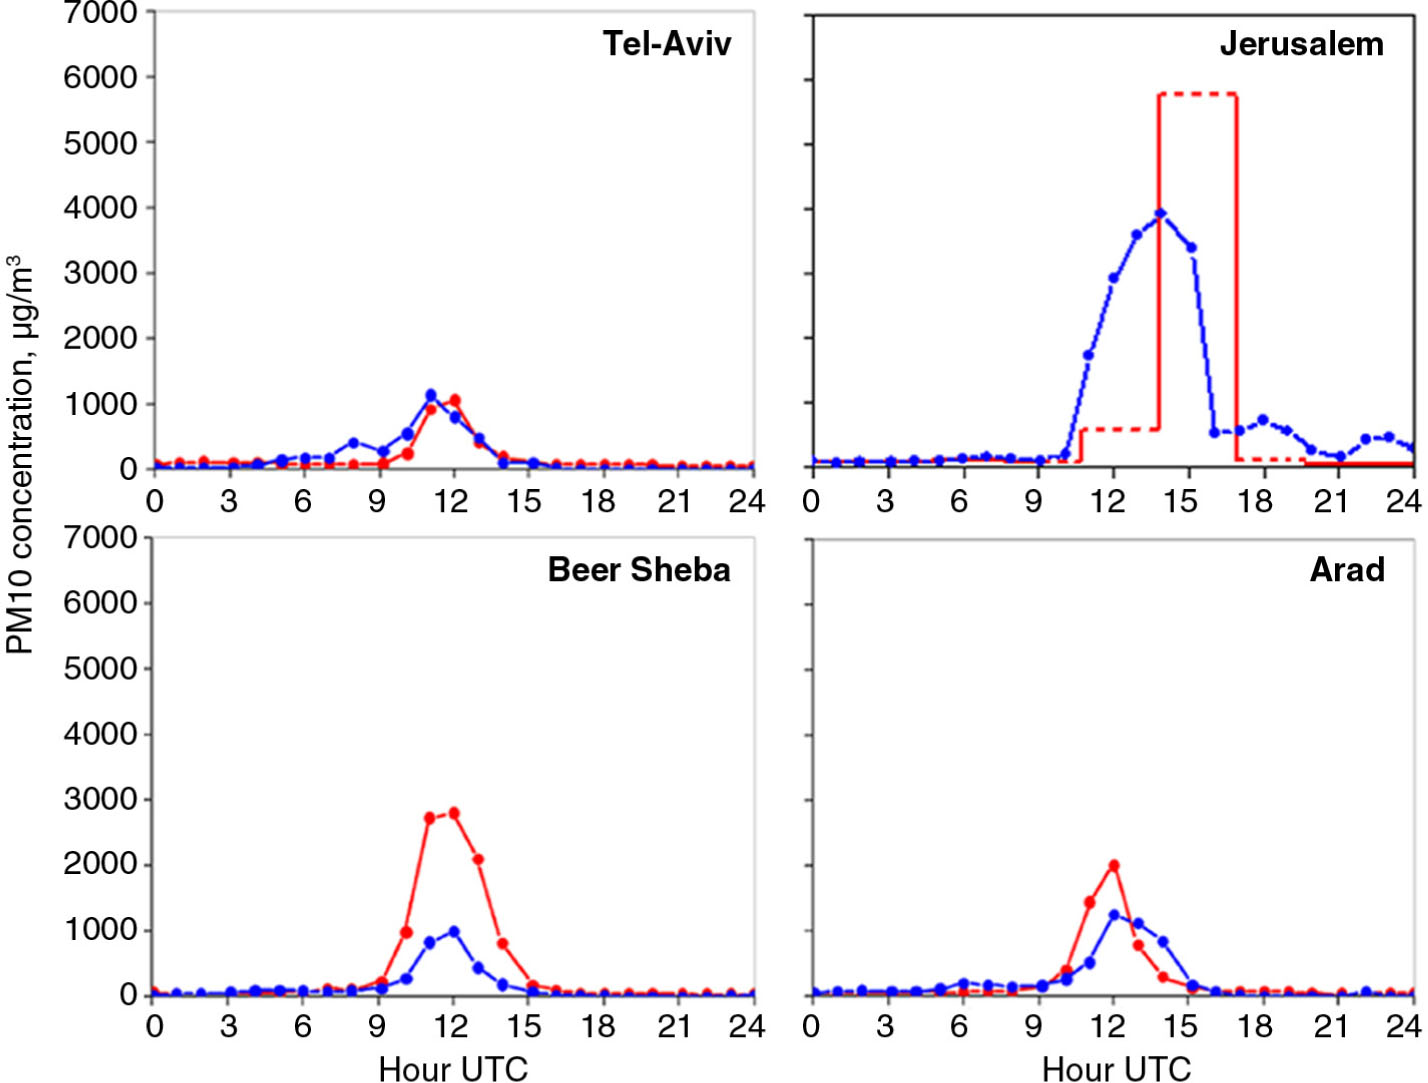
Fig. 6
Surface PM10 concentrations: COSMO-ART model results (blue) and observations (red) on 22 March 2013, are given. At the Jerusalem site, PM10 measurements are presented as 3-hour averaged data.
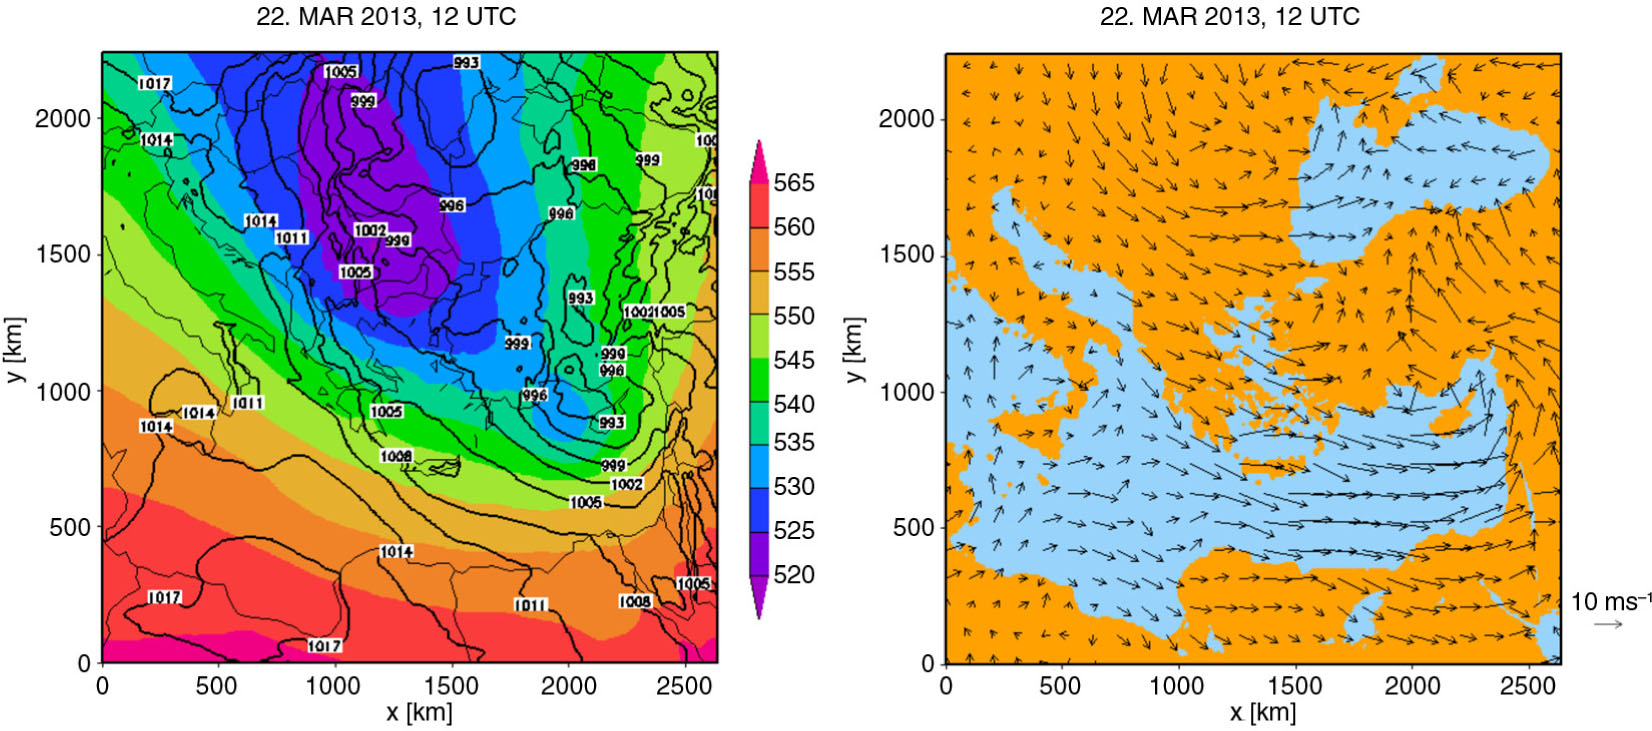
Fig. 7
Left: Sea level pressure (hPa) (black contour lines) and 500 hPa geopotential (gpdam) (coloured). Right: 10-m wind vectors (m s−1). Both figures show data of COSMO-EU analysis at 22 March 2013, 12:00 UTC.
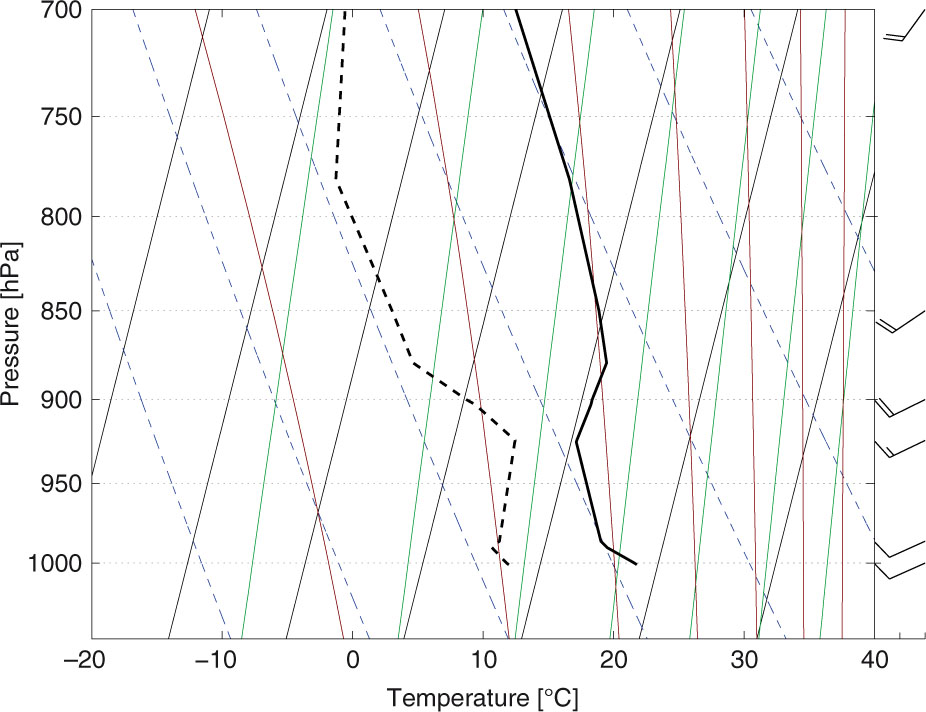
Fig. 8
SkewT–logP diagram of measured temperature (solid line), dew point (dashed line), and wind (in m s−1) on 22 March, 2013, 12:00 UTC at Bet Dagan.
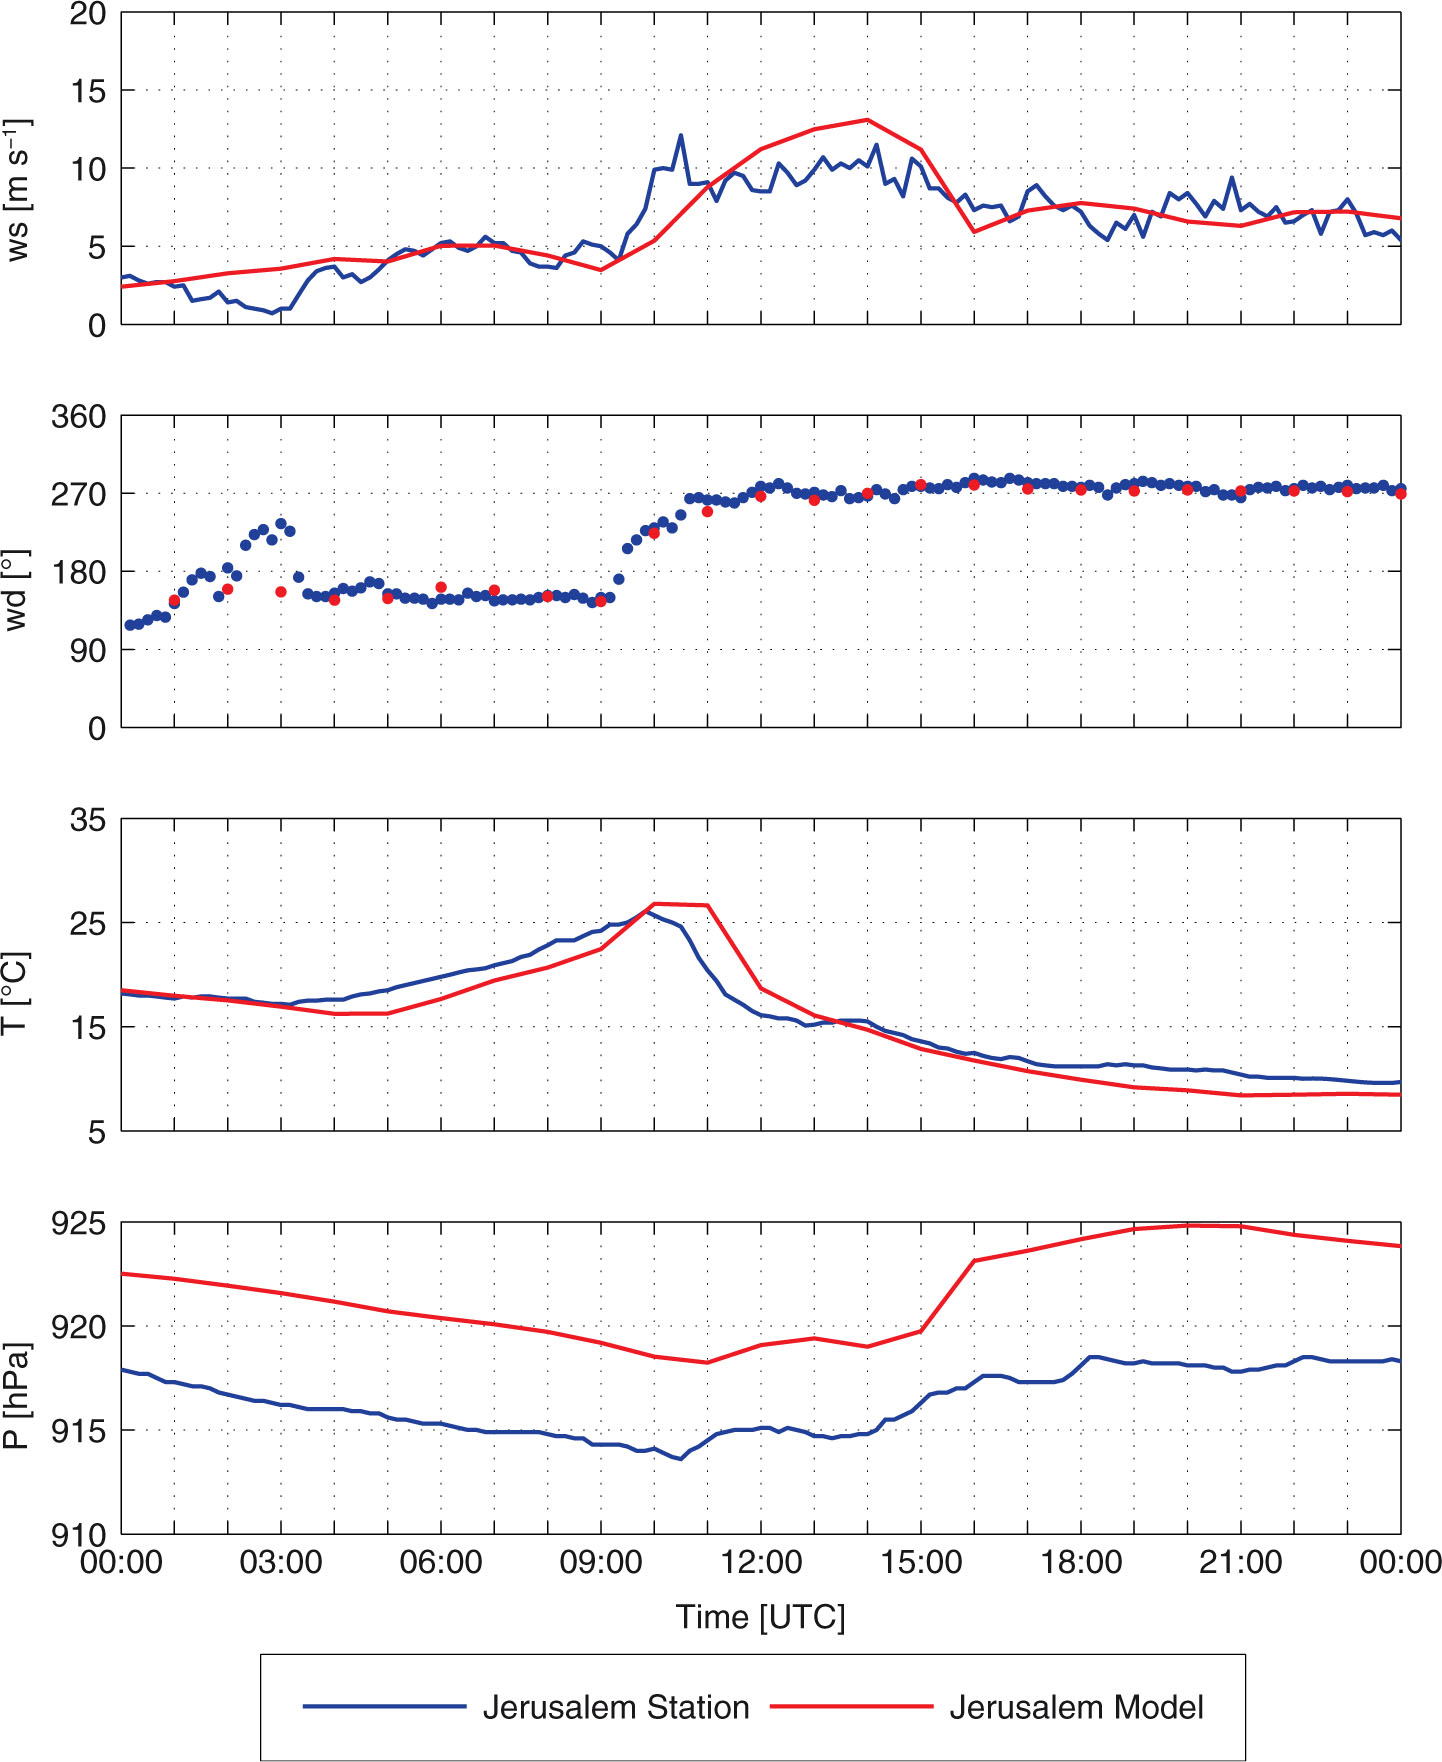
Fig. 9
Measurements and model results of surface meteorological parameters: wind speed (ws), wind direction (wd), temperature (T) and air pressure (P) at the meteorological station of the IMS in Jerusalem on 22 March 2013.
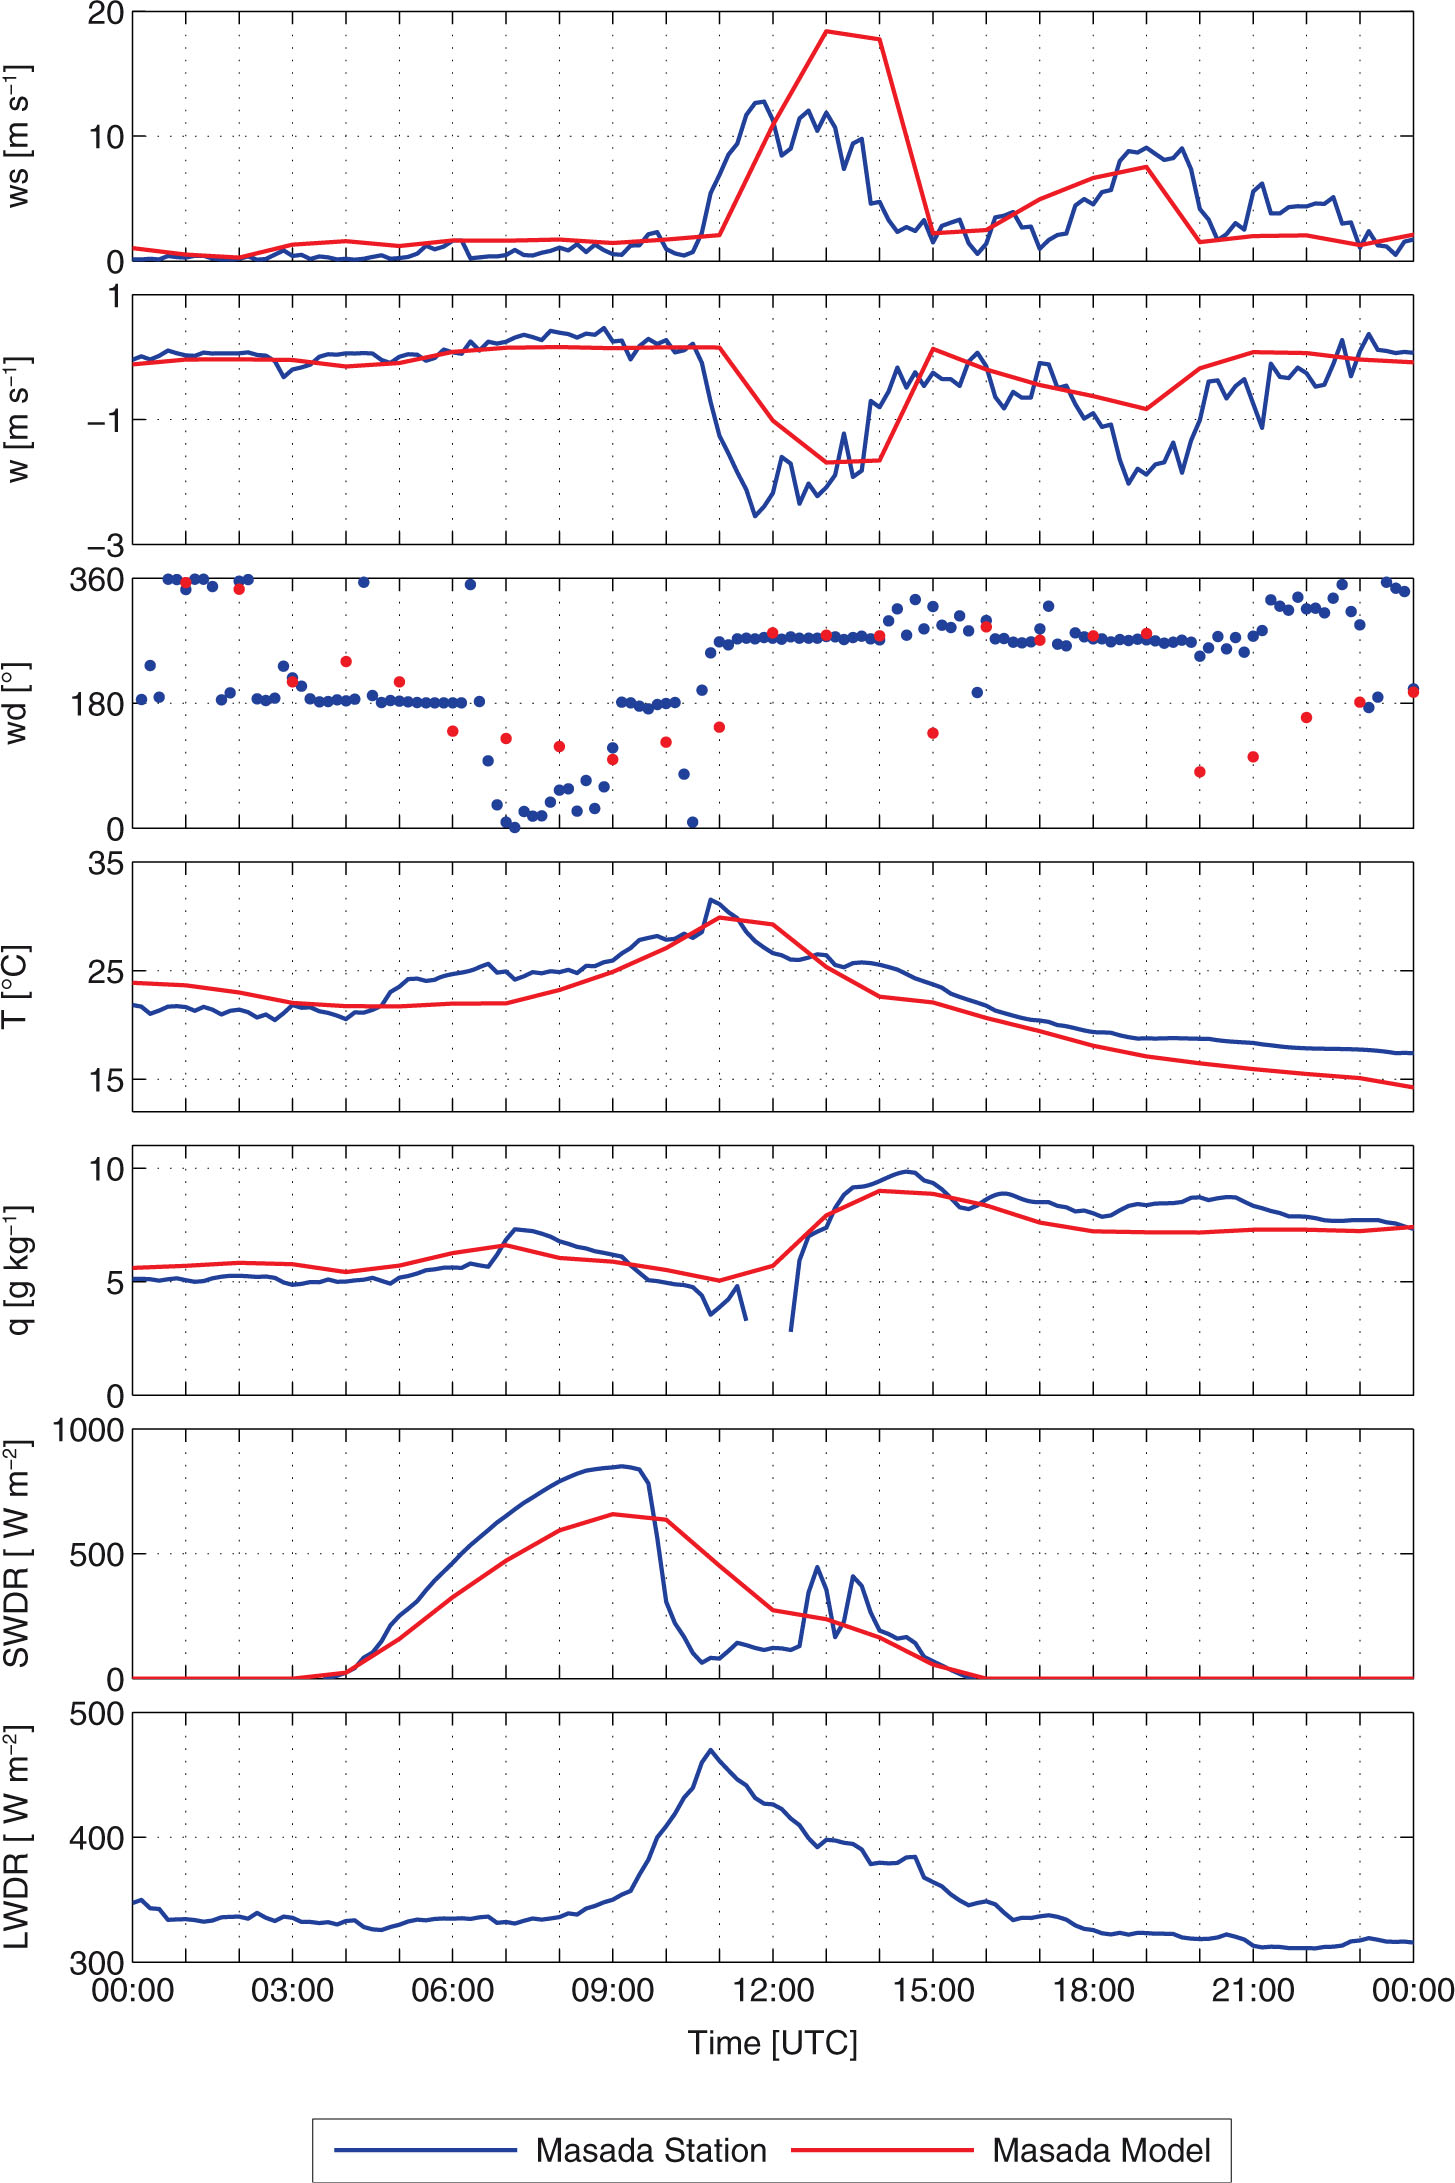
Fig. 10
Measurements and model results of surface meteorological parameters: wind speed (ws), vertical wind speed (w), wind direction (wd), temperature (T), specific humidity (q), shortwave downward radiation (SWDR) and longwave downward radiation (LWDR) at the meteorological station Masada on 22 March 2013.
Table 2. Overview of all simulations performed for this study. The simulations cover 21 March, 12 UTC, to 23 March, 12 UTC. For further details, see Section 2
CA-250.25 °Large domain which includes Saharan dust source regions.CA-70.0625 °Middle domain nested into CA-25.CA-30.025 °Analysis domain, nested into CA-7.S10.025 °As CA-3 except that no dust emissions are allowed inside the domain.S20.025 °Simulation with its western border at the top of the Judean Mountains (see Fig. 2). No emissions are allowed inside this area.S30.025 °Same as S2, except that emissions are allowed inside the simulation domain and no dust is transported into the domain at the boundaries.
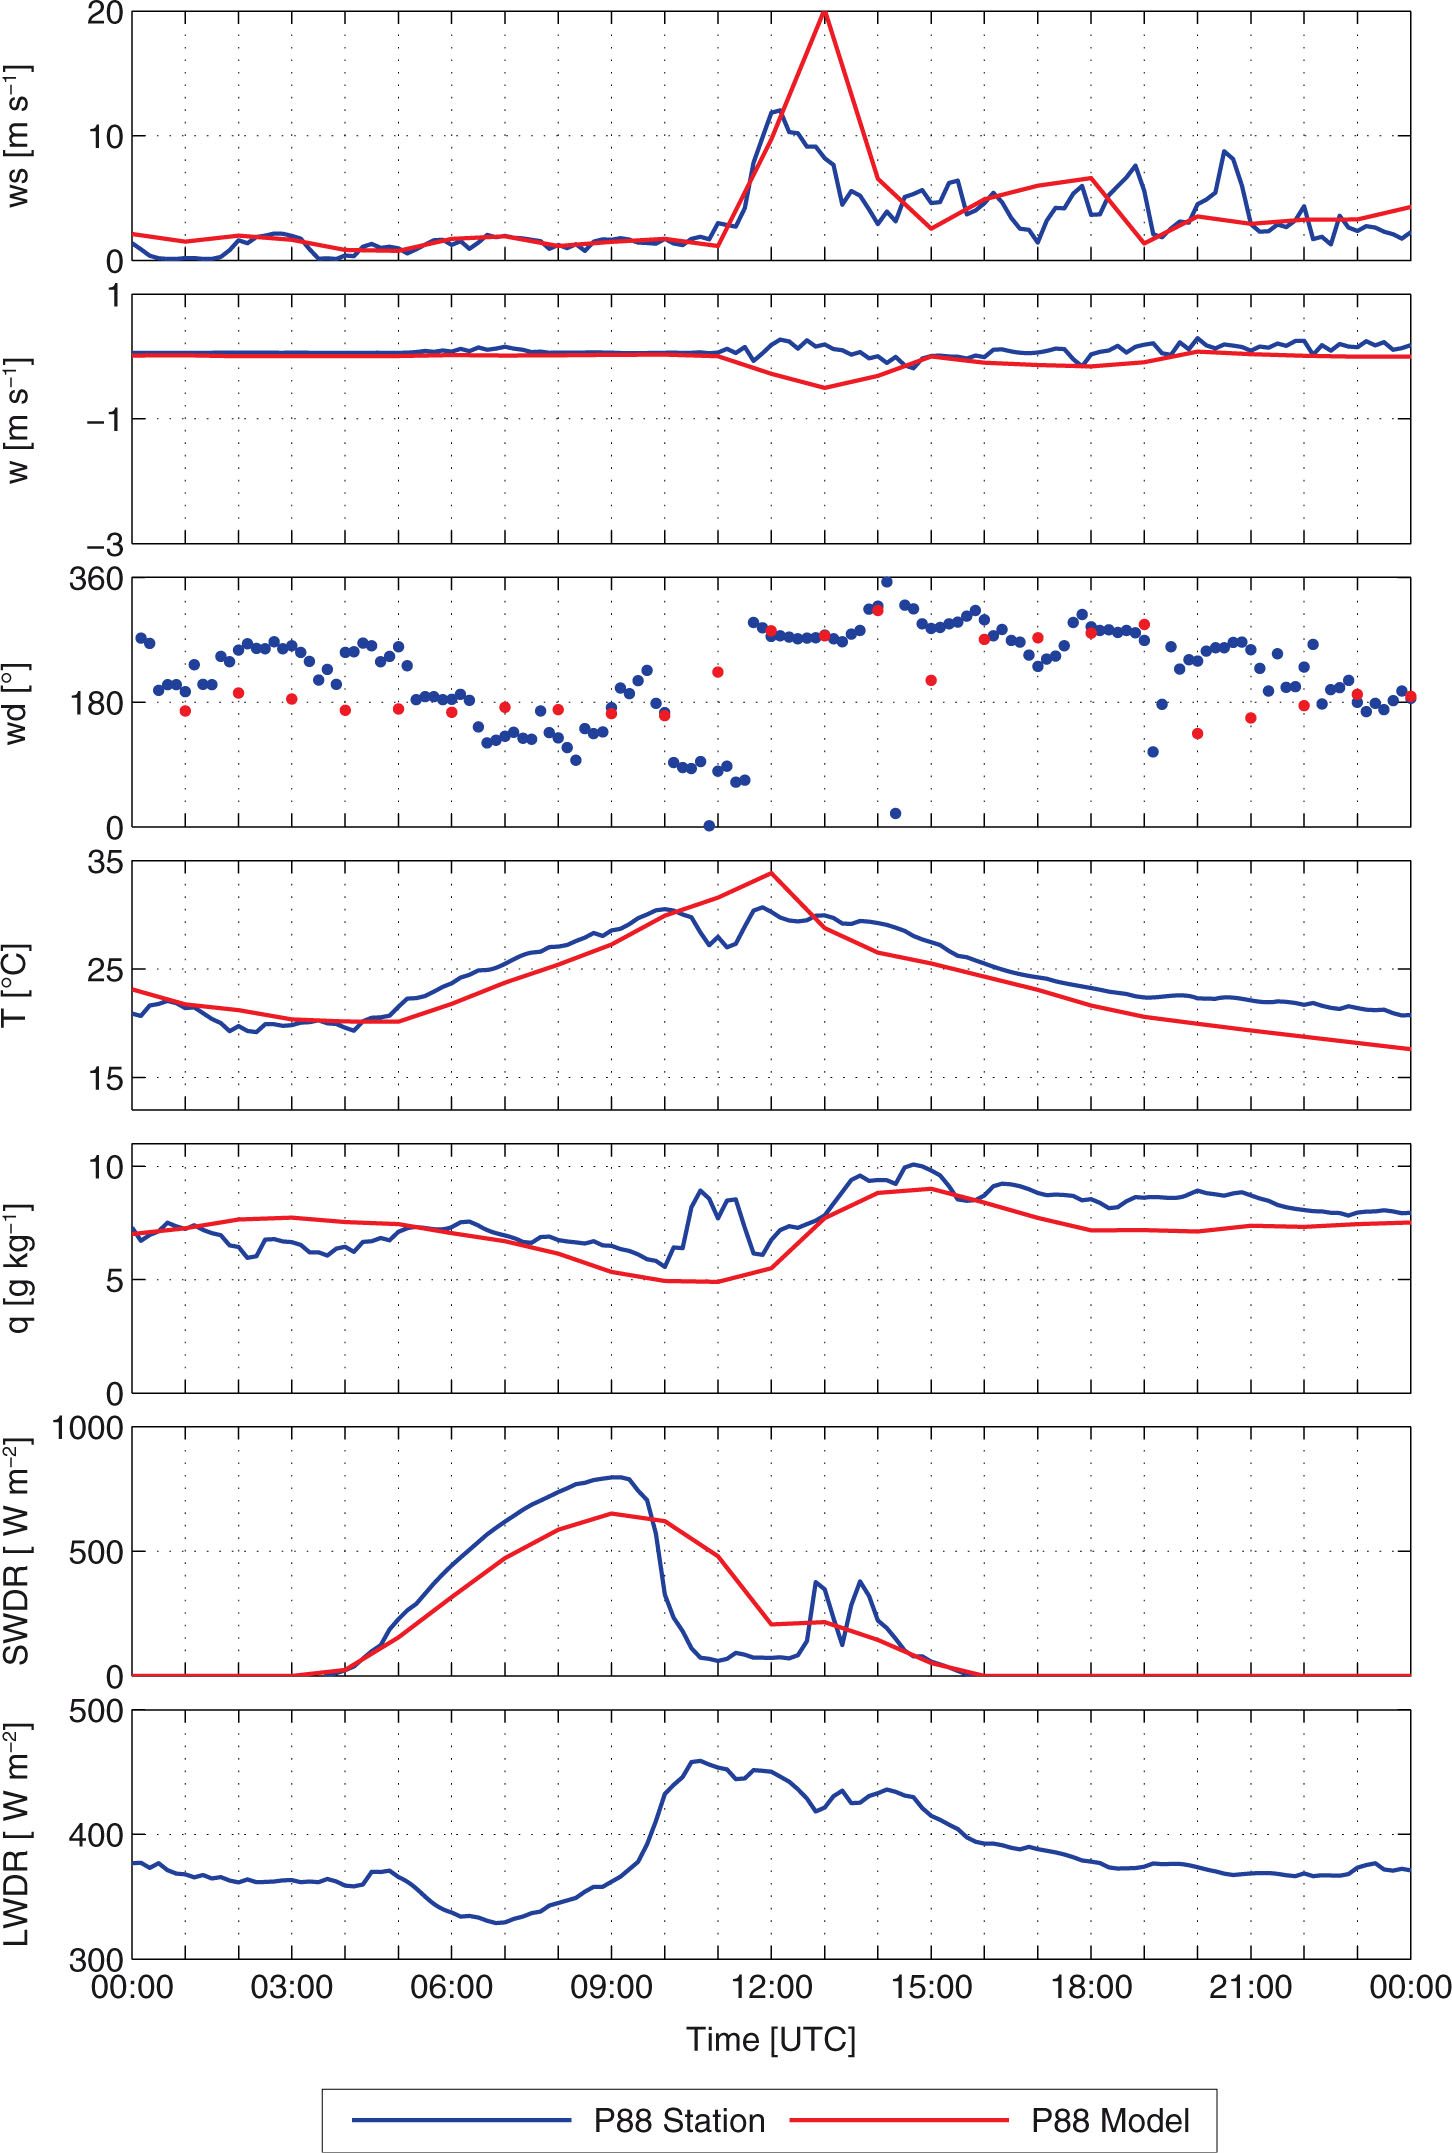
Fig. 11
Measurements and model results of surface meteorological parameters: wind speed (ws), vertical wind speed (w), wind direction (wd), temperature (T), specific humidity (q), shortwave downward radiation (SWDR) and longwave downward radiation (LWDR) at the meteorological station P88 on 22 March 2013.
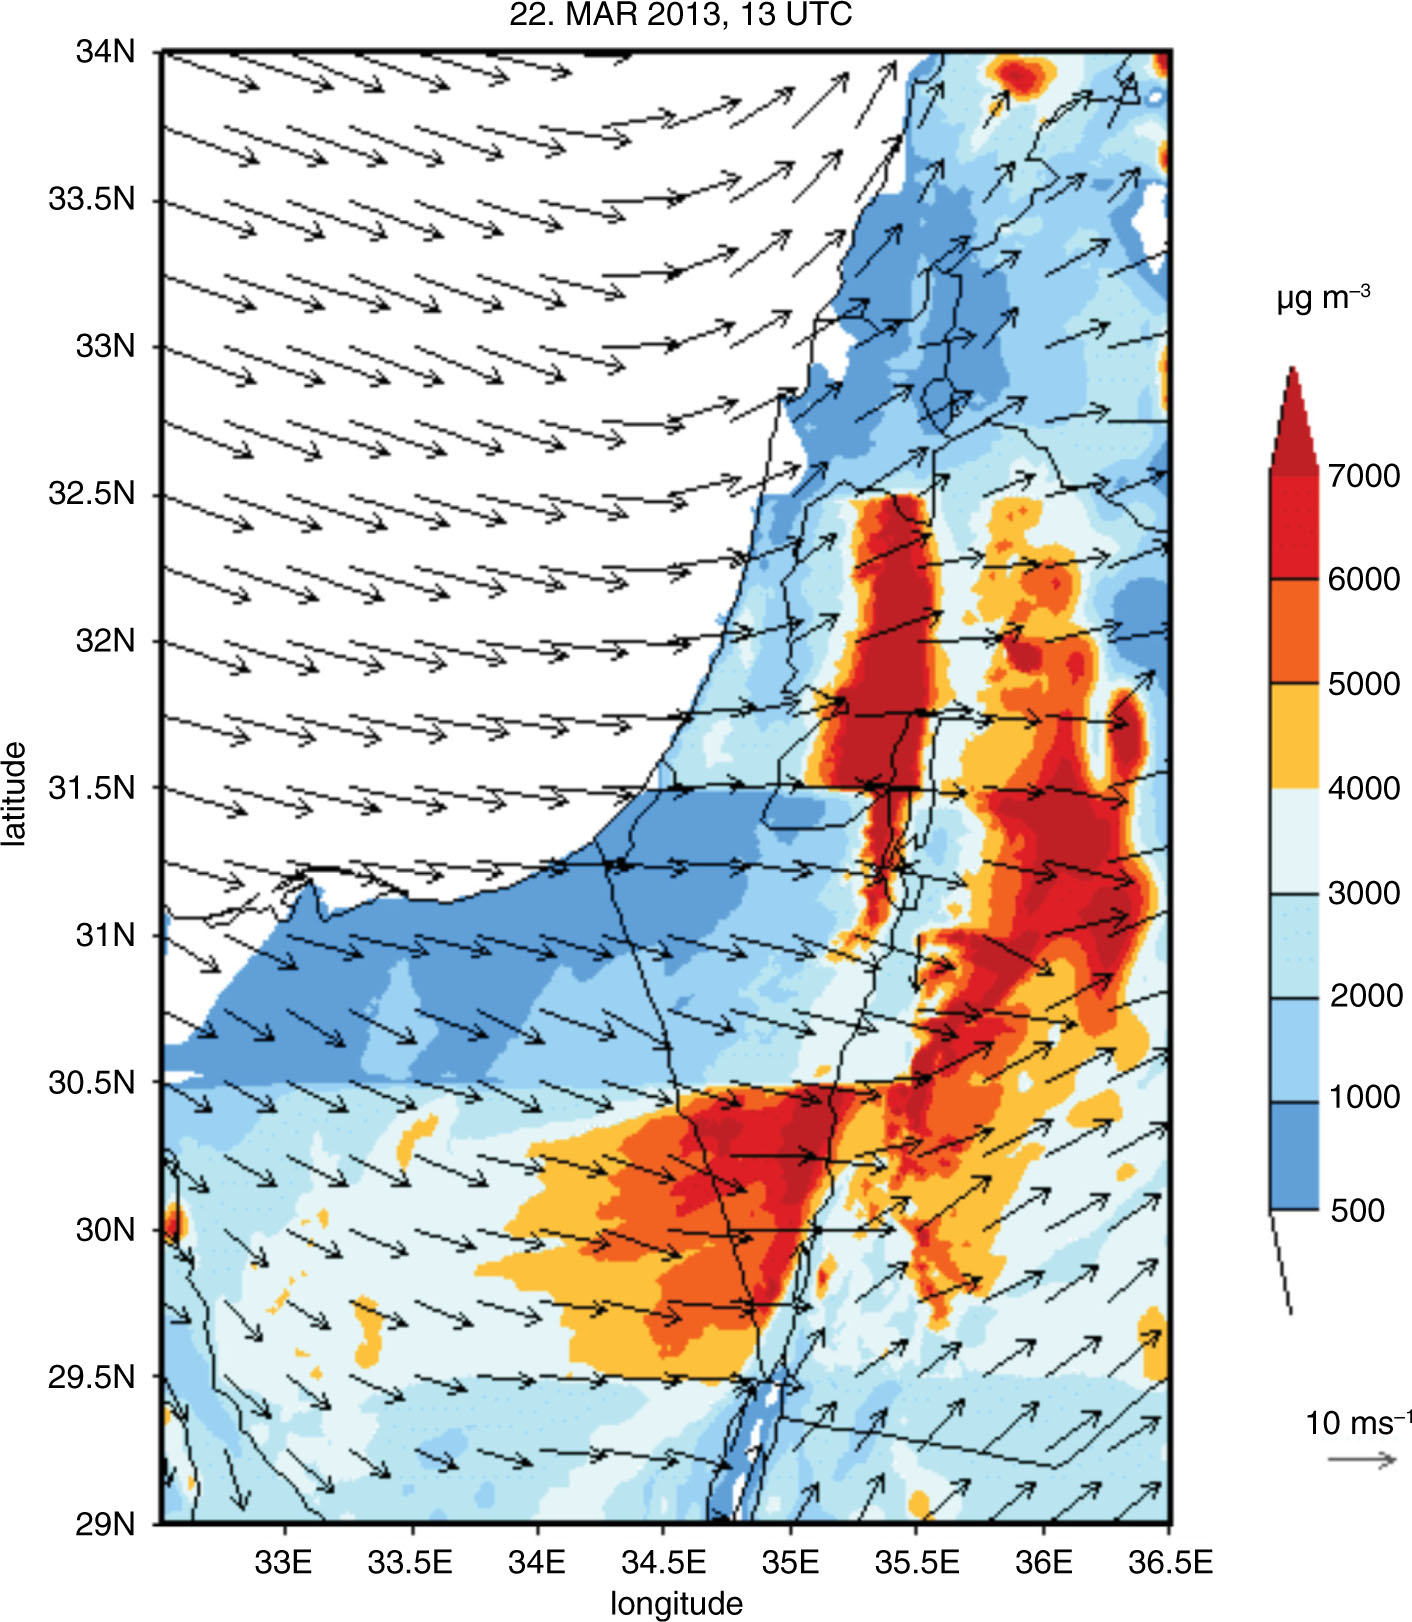
Fig. 12
Spatial distribution of the simulated dust concentration (µg m−3) in the lowest model layer on 22 March 2013, 13:00 UTC is shown. Additionally, wind speed and direction are indicated by every tenth 10-m wind arrow.
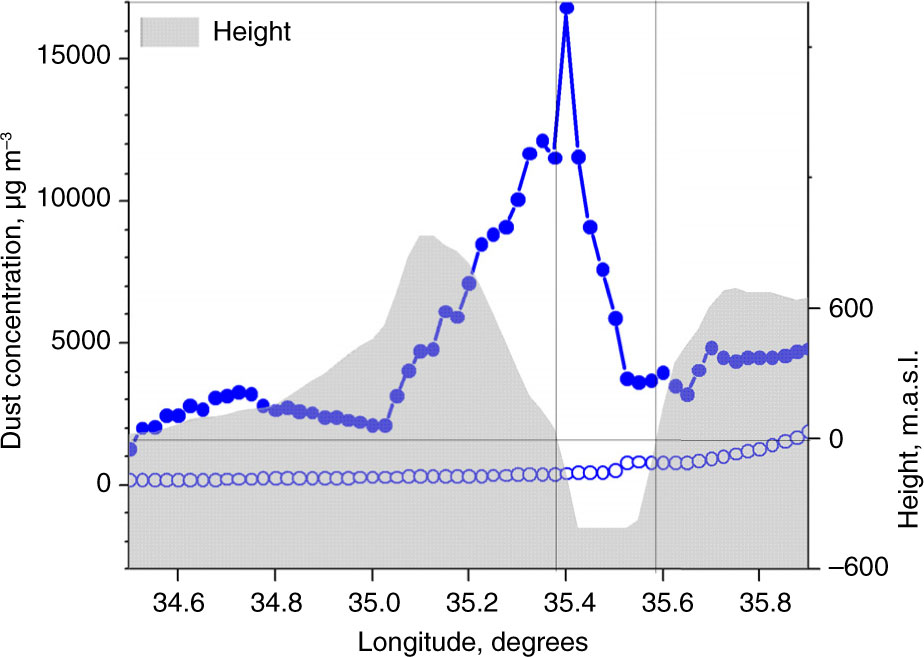
Fig. 13
West-east cross-section of COSMO-ART modelled dust concentration in the lowest model layer (~ 10 m above surface) at 31.6 °N, on 22 March 2013, at 13 UTC. The line with closed circles represents surface dust concentration of the standard simulation CA-3, while the line with open circles represents near-surface dust concentration for simulation S1 (when no dust emissions were allowed inside the CA-3 domain). The horizontal line represents the sea level. The two vertical lines show the interval of longitudes with topographic heights below sea level.
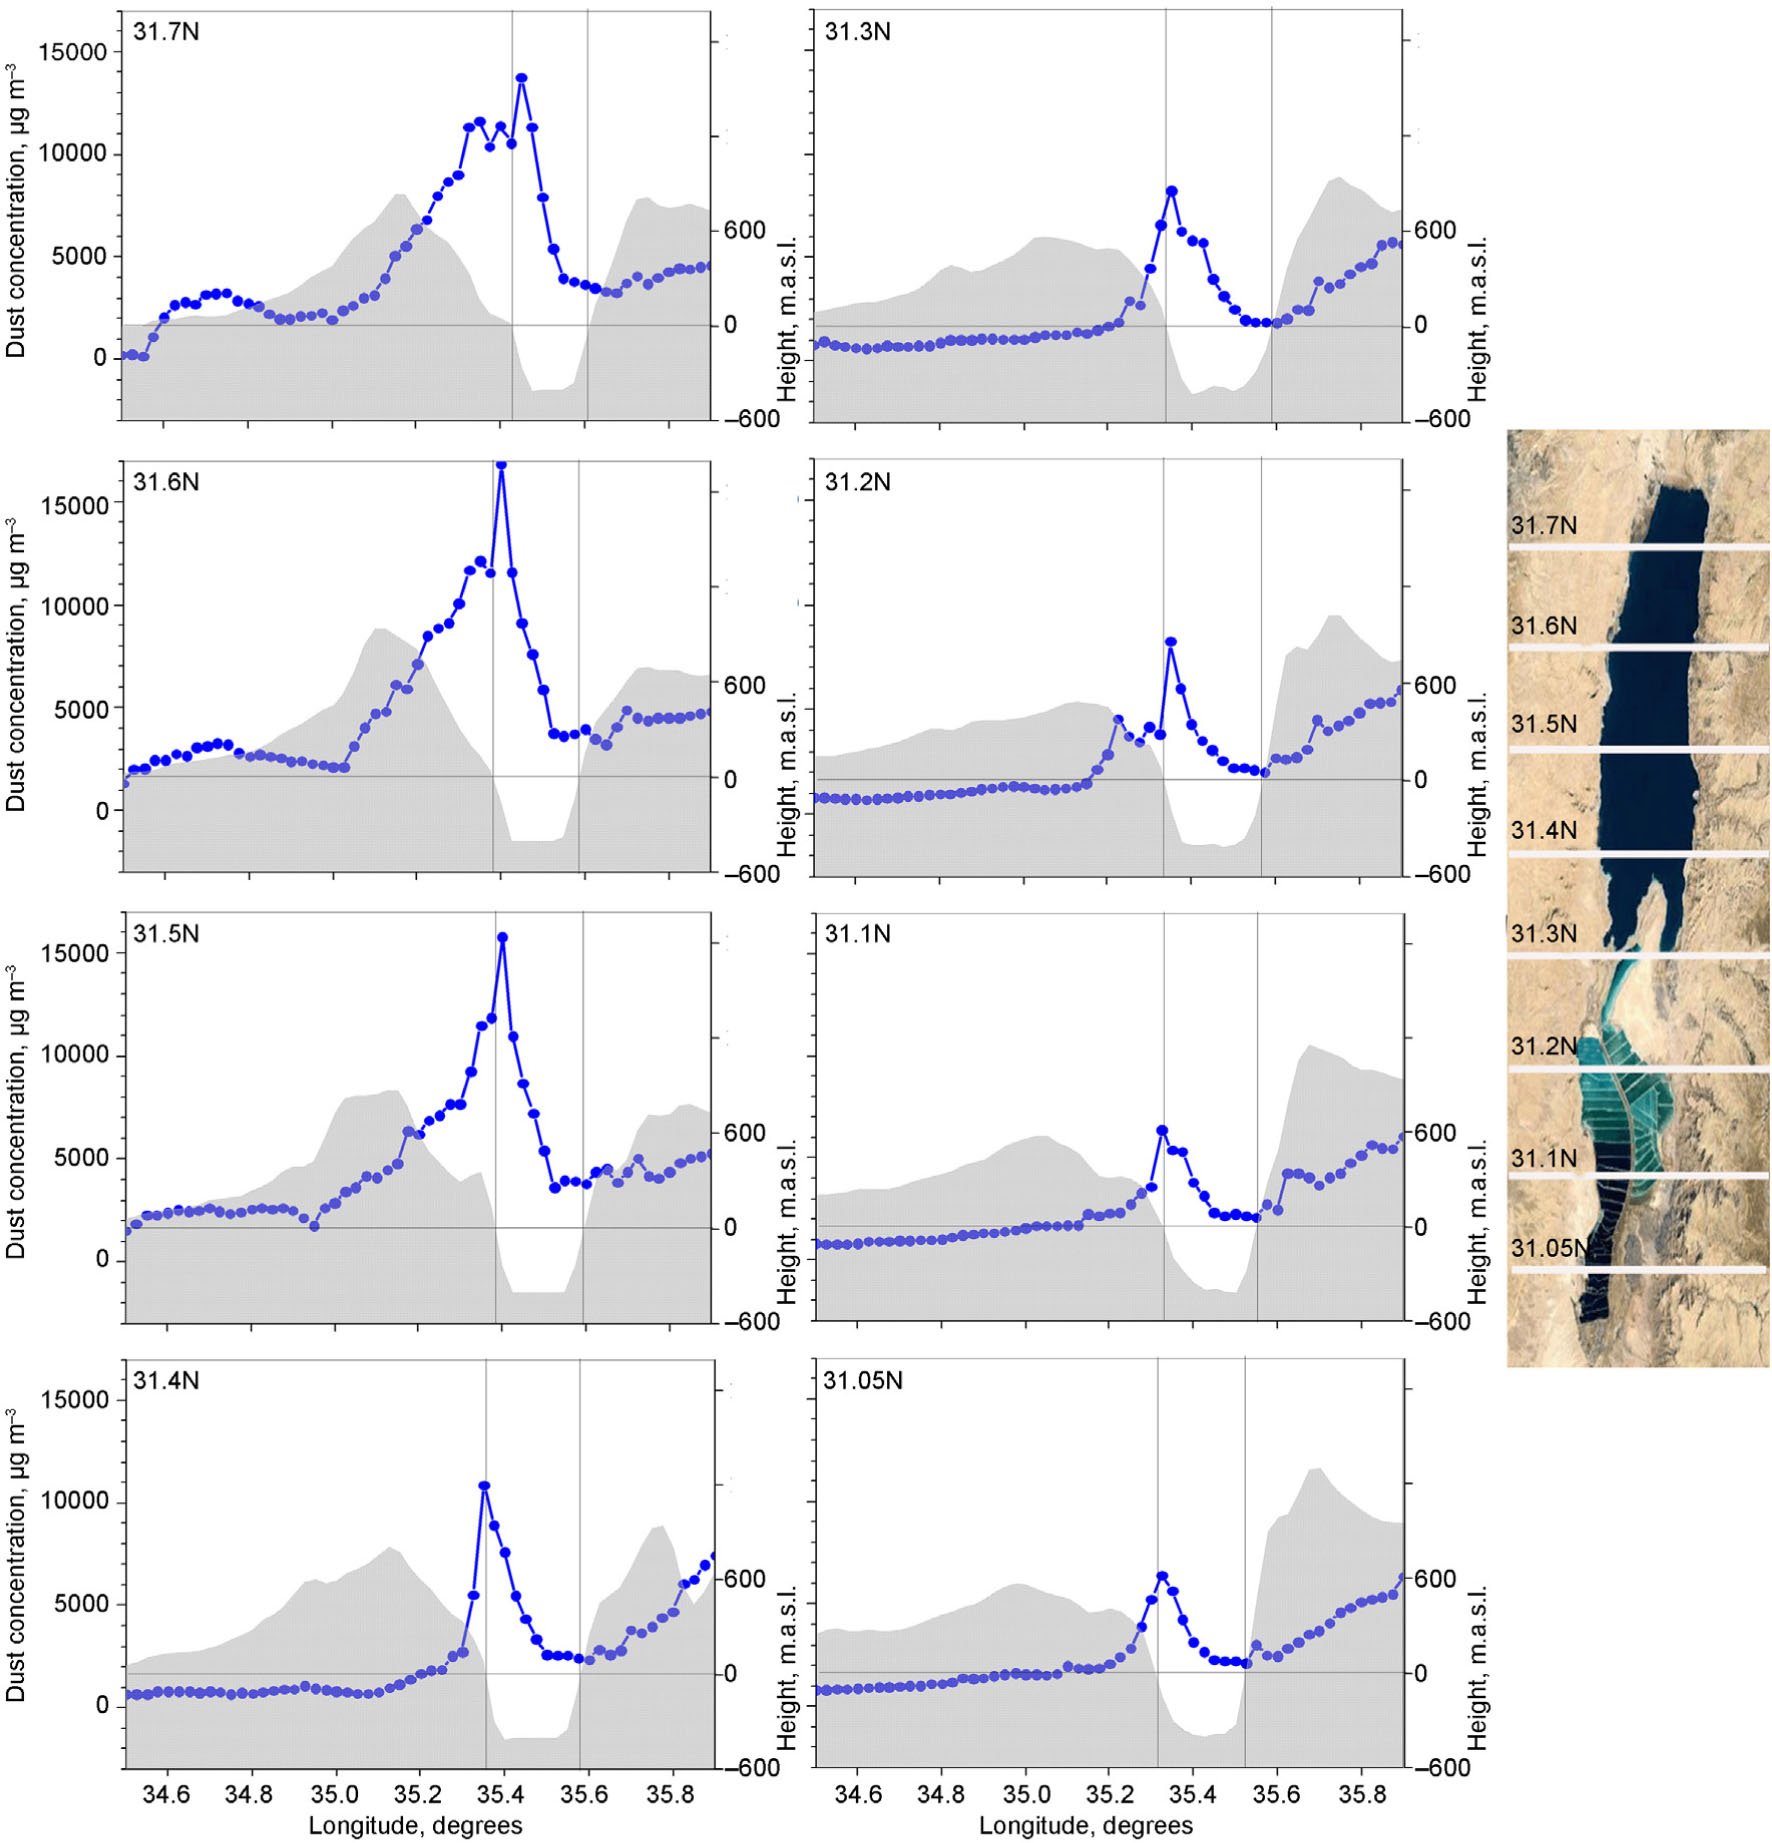
Fig. 14
West-east cross-sections over the Dead Sea valley of (blue lines) modelled near-surface dust concentration and (grey colour) orography at specified latitudes from 31.05 °N to 31.7 °N on 22 March, 2013, at 13:00 UTC. In each cross-section, the horizontal line represents the sea level, while the two vertical lines show the interval of longitude with topographic height below sea level. The right panel represents the Google map of the Dead Sea valley, indicating the locations of the cross-sections (white lines).
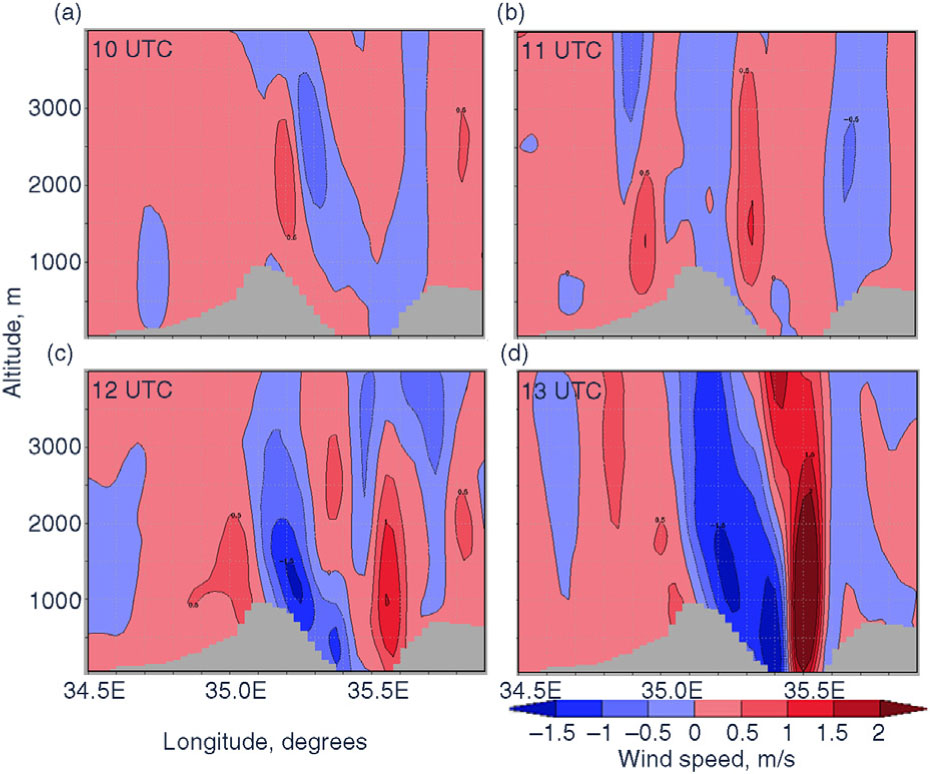
Fig. 15
The diagram shows the west–east cross-sections of modelled vertical wind speed (m s−1) at latitude 31.6 °N over the north of the Dead Sea valley from 10 UTC to 13 UTC on 22 March 2013. Positive values of the vertical velocity correspond to an ascending airflow, while negative values correspond to a descending airflow.
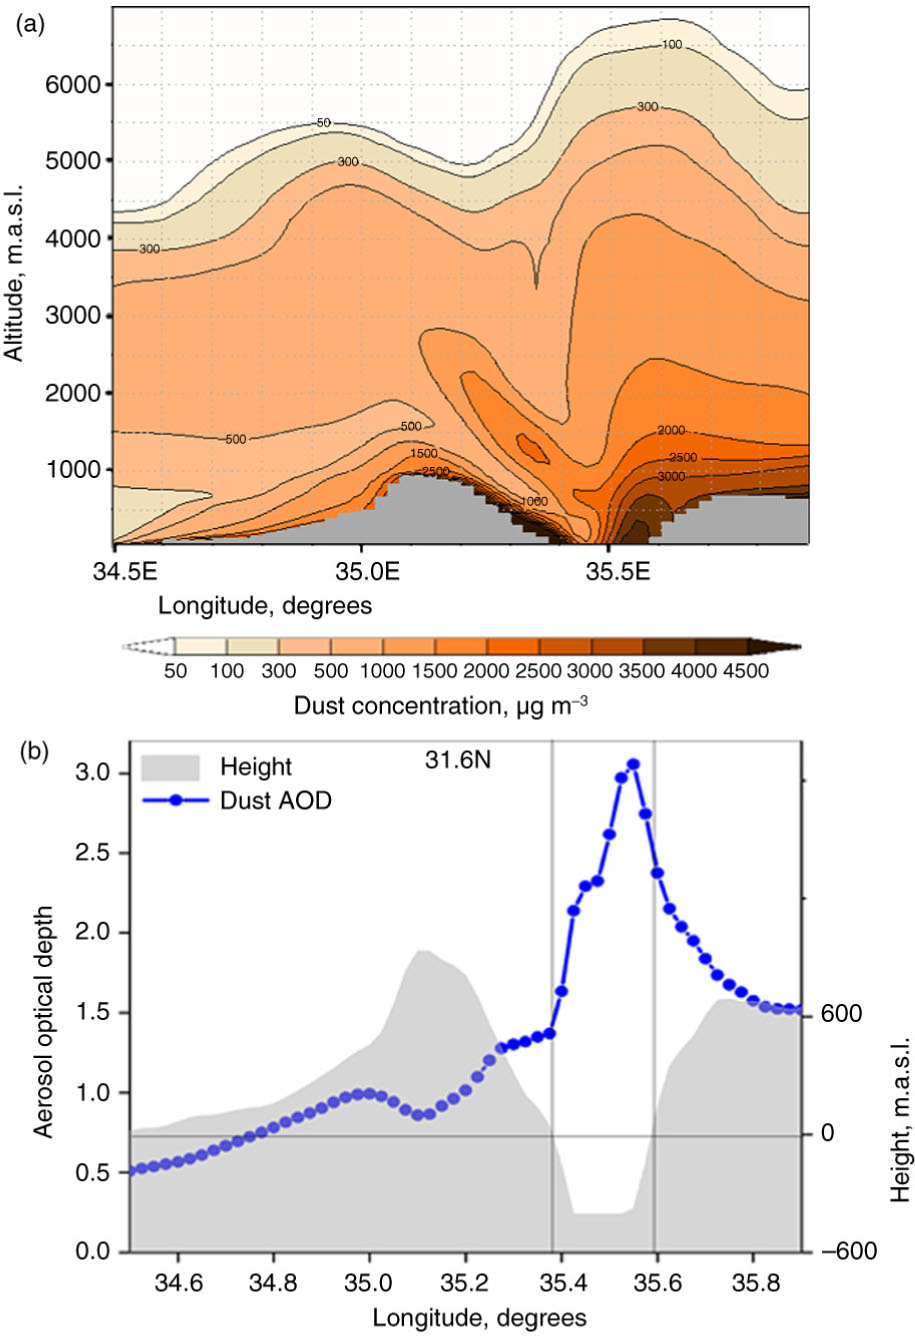
Fig. 16
West–east cross-sections of modelled (a) dust concentration and (b) dust aerosol optical depth (AOD) at latitude 31.6 °N over the north of the Dead Sea valley on 22 March 2013, at 13 UTC.
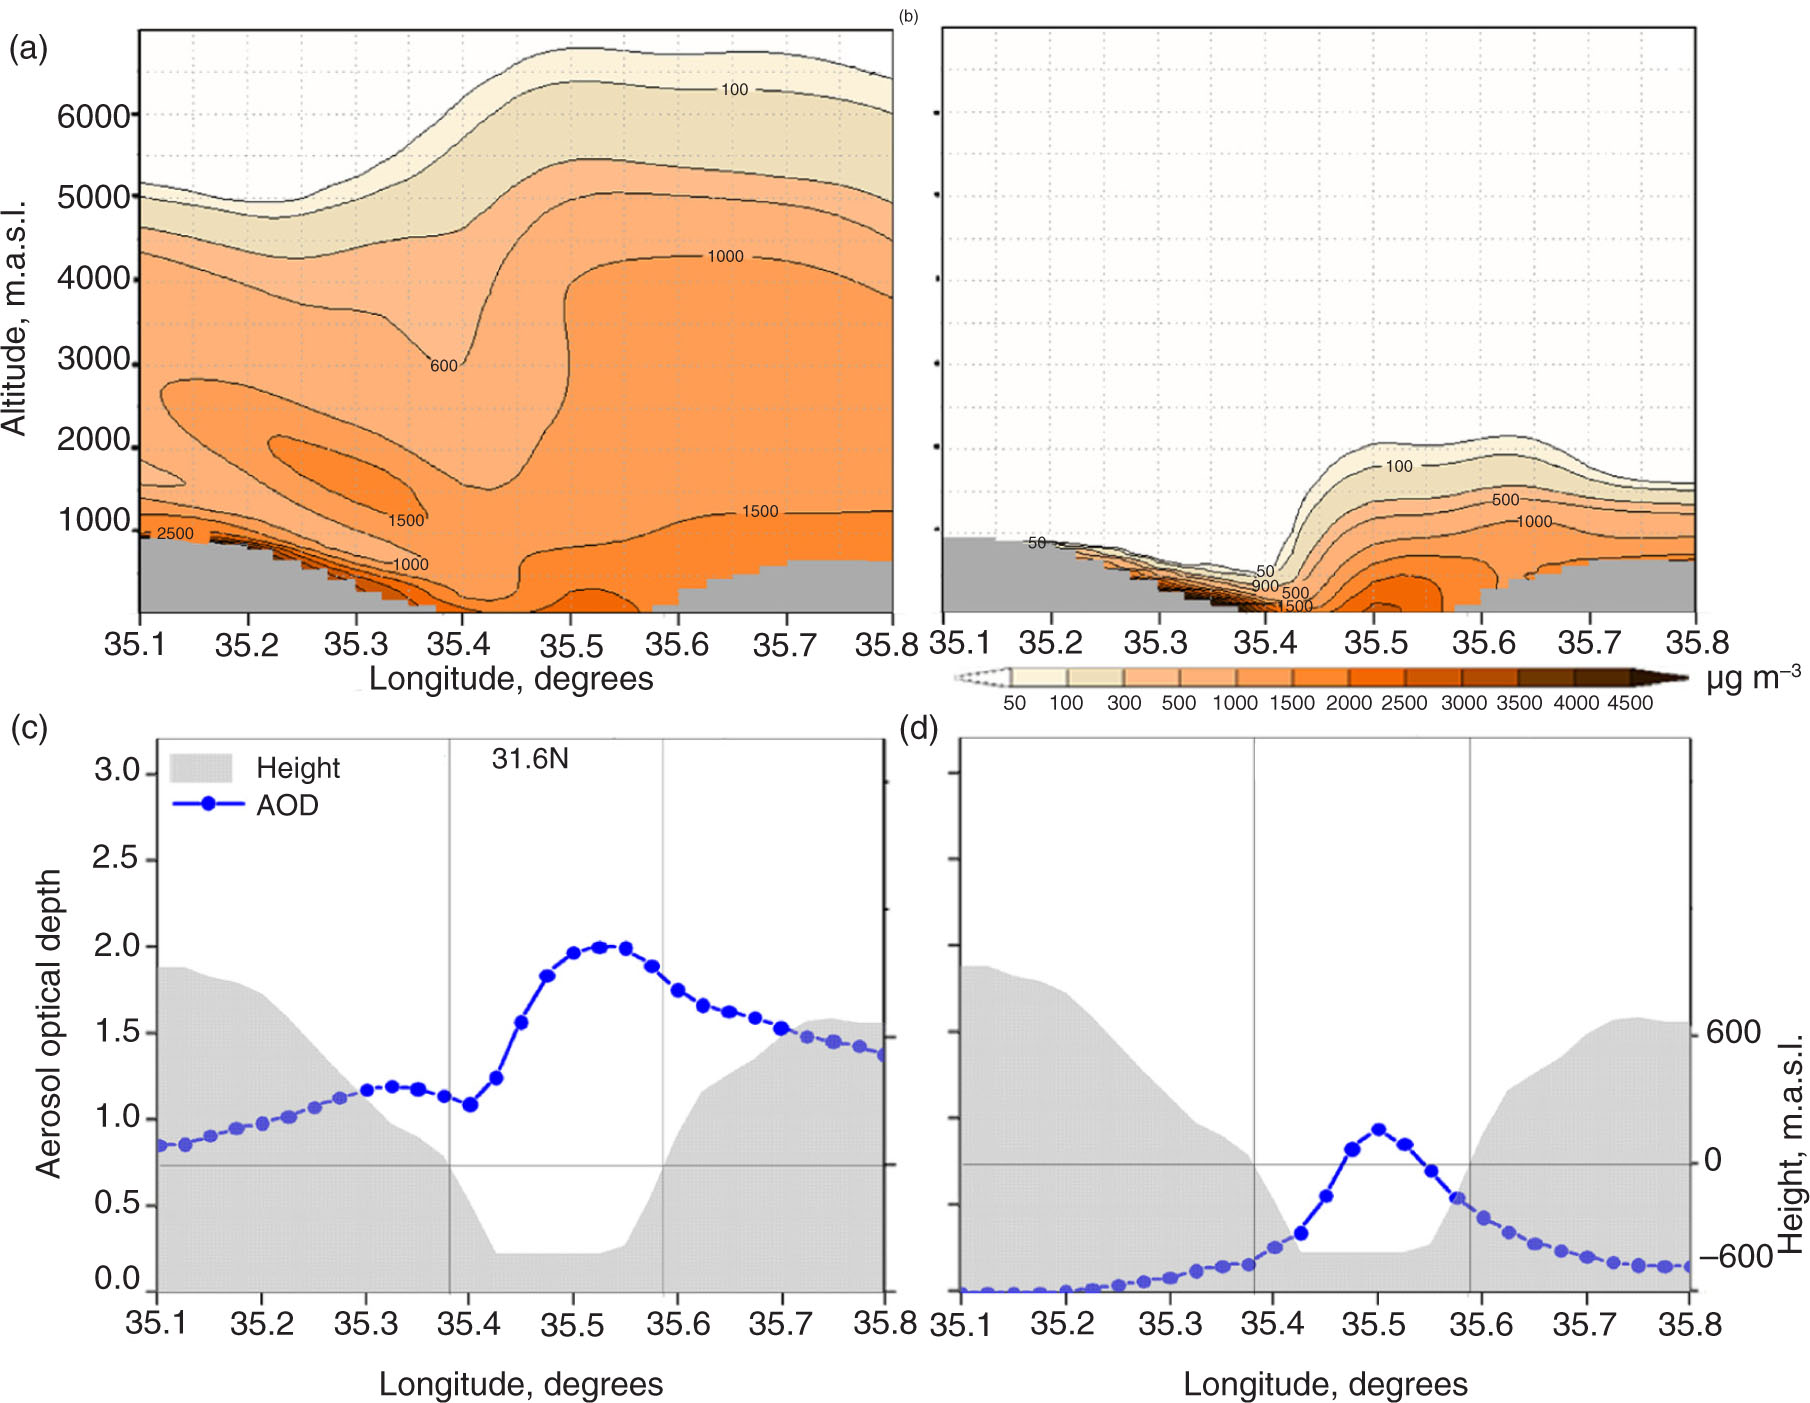
Fig. 17
West–east cross-sections of modelled dust concentration for simulations (a) S2 and (b) S3 over the north of the Dead Sea valley at latitude 31.6 °N on 22 March 2013, at 13 UTC. Lower panel: modelled dust AOD for (c) S2 and (d) S3 in the same cross-section as in (a) and (b).
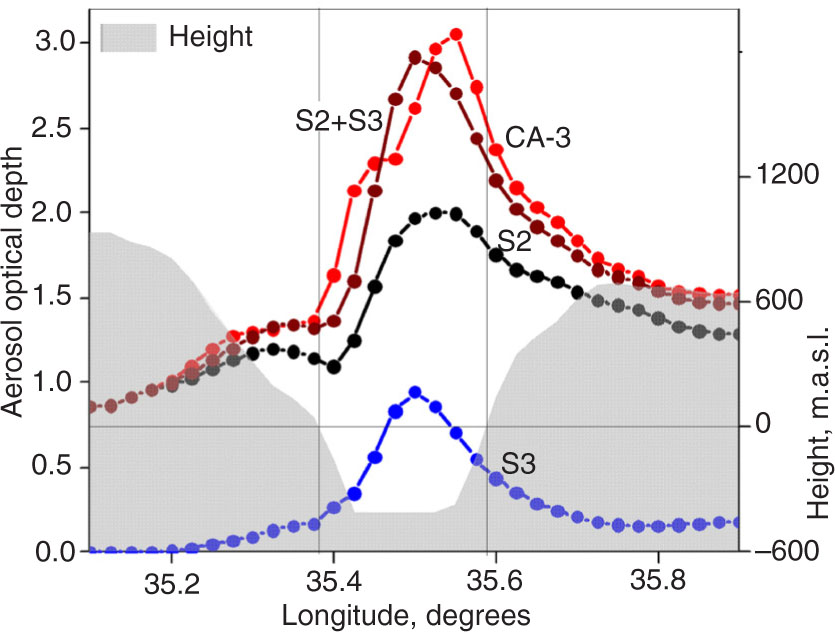
Fig. 18
Comparisons of modelled dust AOD for simulations CA-3, S2, S3, as well as for the superposition of S2 and S3 (S2 + S3), over the north of the Dead Sea valley (at latitude 31.6 °N) on 22 March 2013, at 13 UTC.