
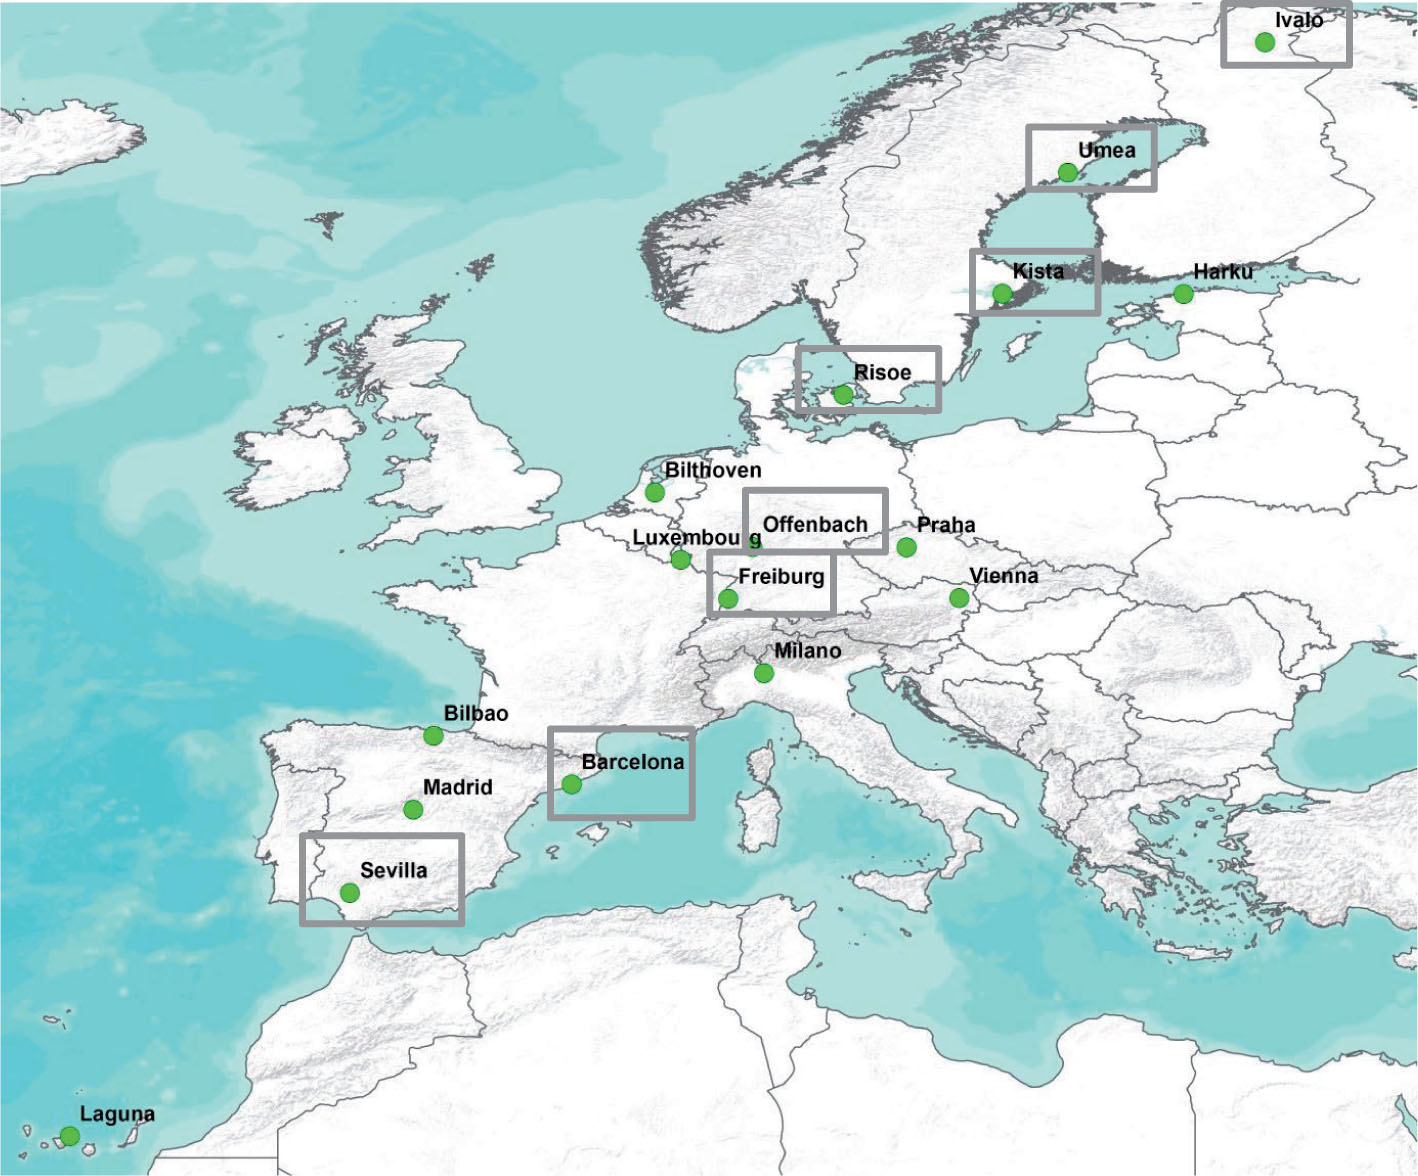
Fig. 1
Map of 7Be sampling sites. The stations given in squares are selected for latitudinal analysis (Section 3.2).
Table 1. Station name, coordinates (latitude, longitude, altitude above sea level), number of operability sampling periods and temporal resolution.
Ivalo68.6427.57130418Weekly (between 6 and 8 d)Umea63.8520.3445478Kista59.417.9316488Harku59.3924.5836400Risoe55.6912.109448Bilthoven52.115.184501Offenbach50.18.77107445Praha50.0914.42202446Luxembourg49.636.13280434Vienna48.2216.35193506Freiburg48.207.87411466Milano45.479.18125349Bilbao43.17−2.94380468Barcelona41.382.1252472Madrid40.45−3.69715471Sevilla37.39−6.018475Laguna28.46−16.29358200
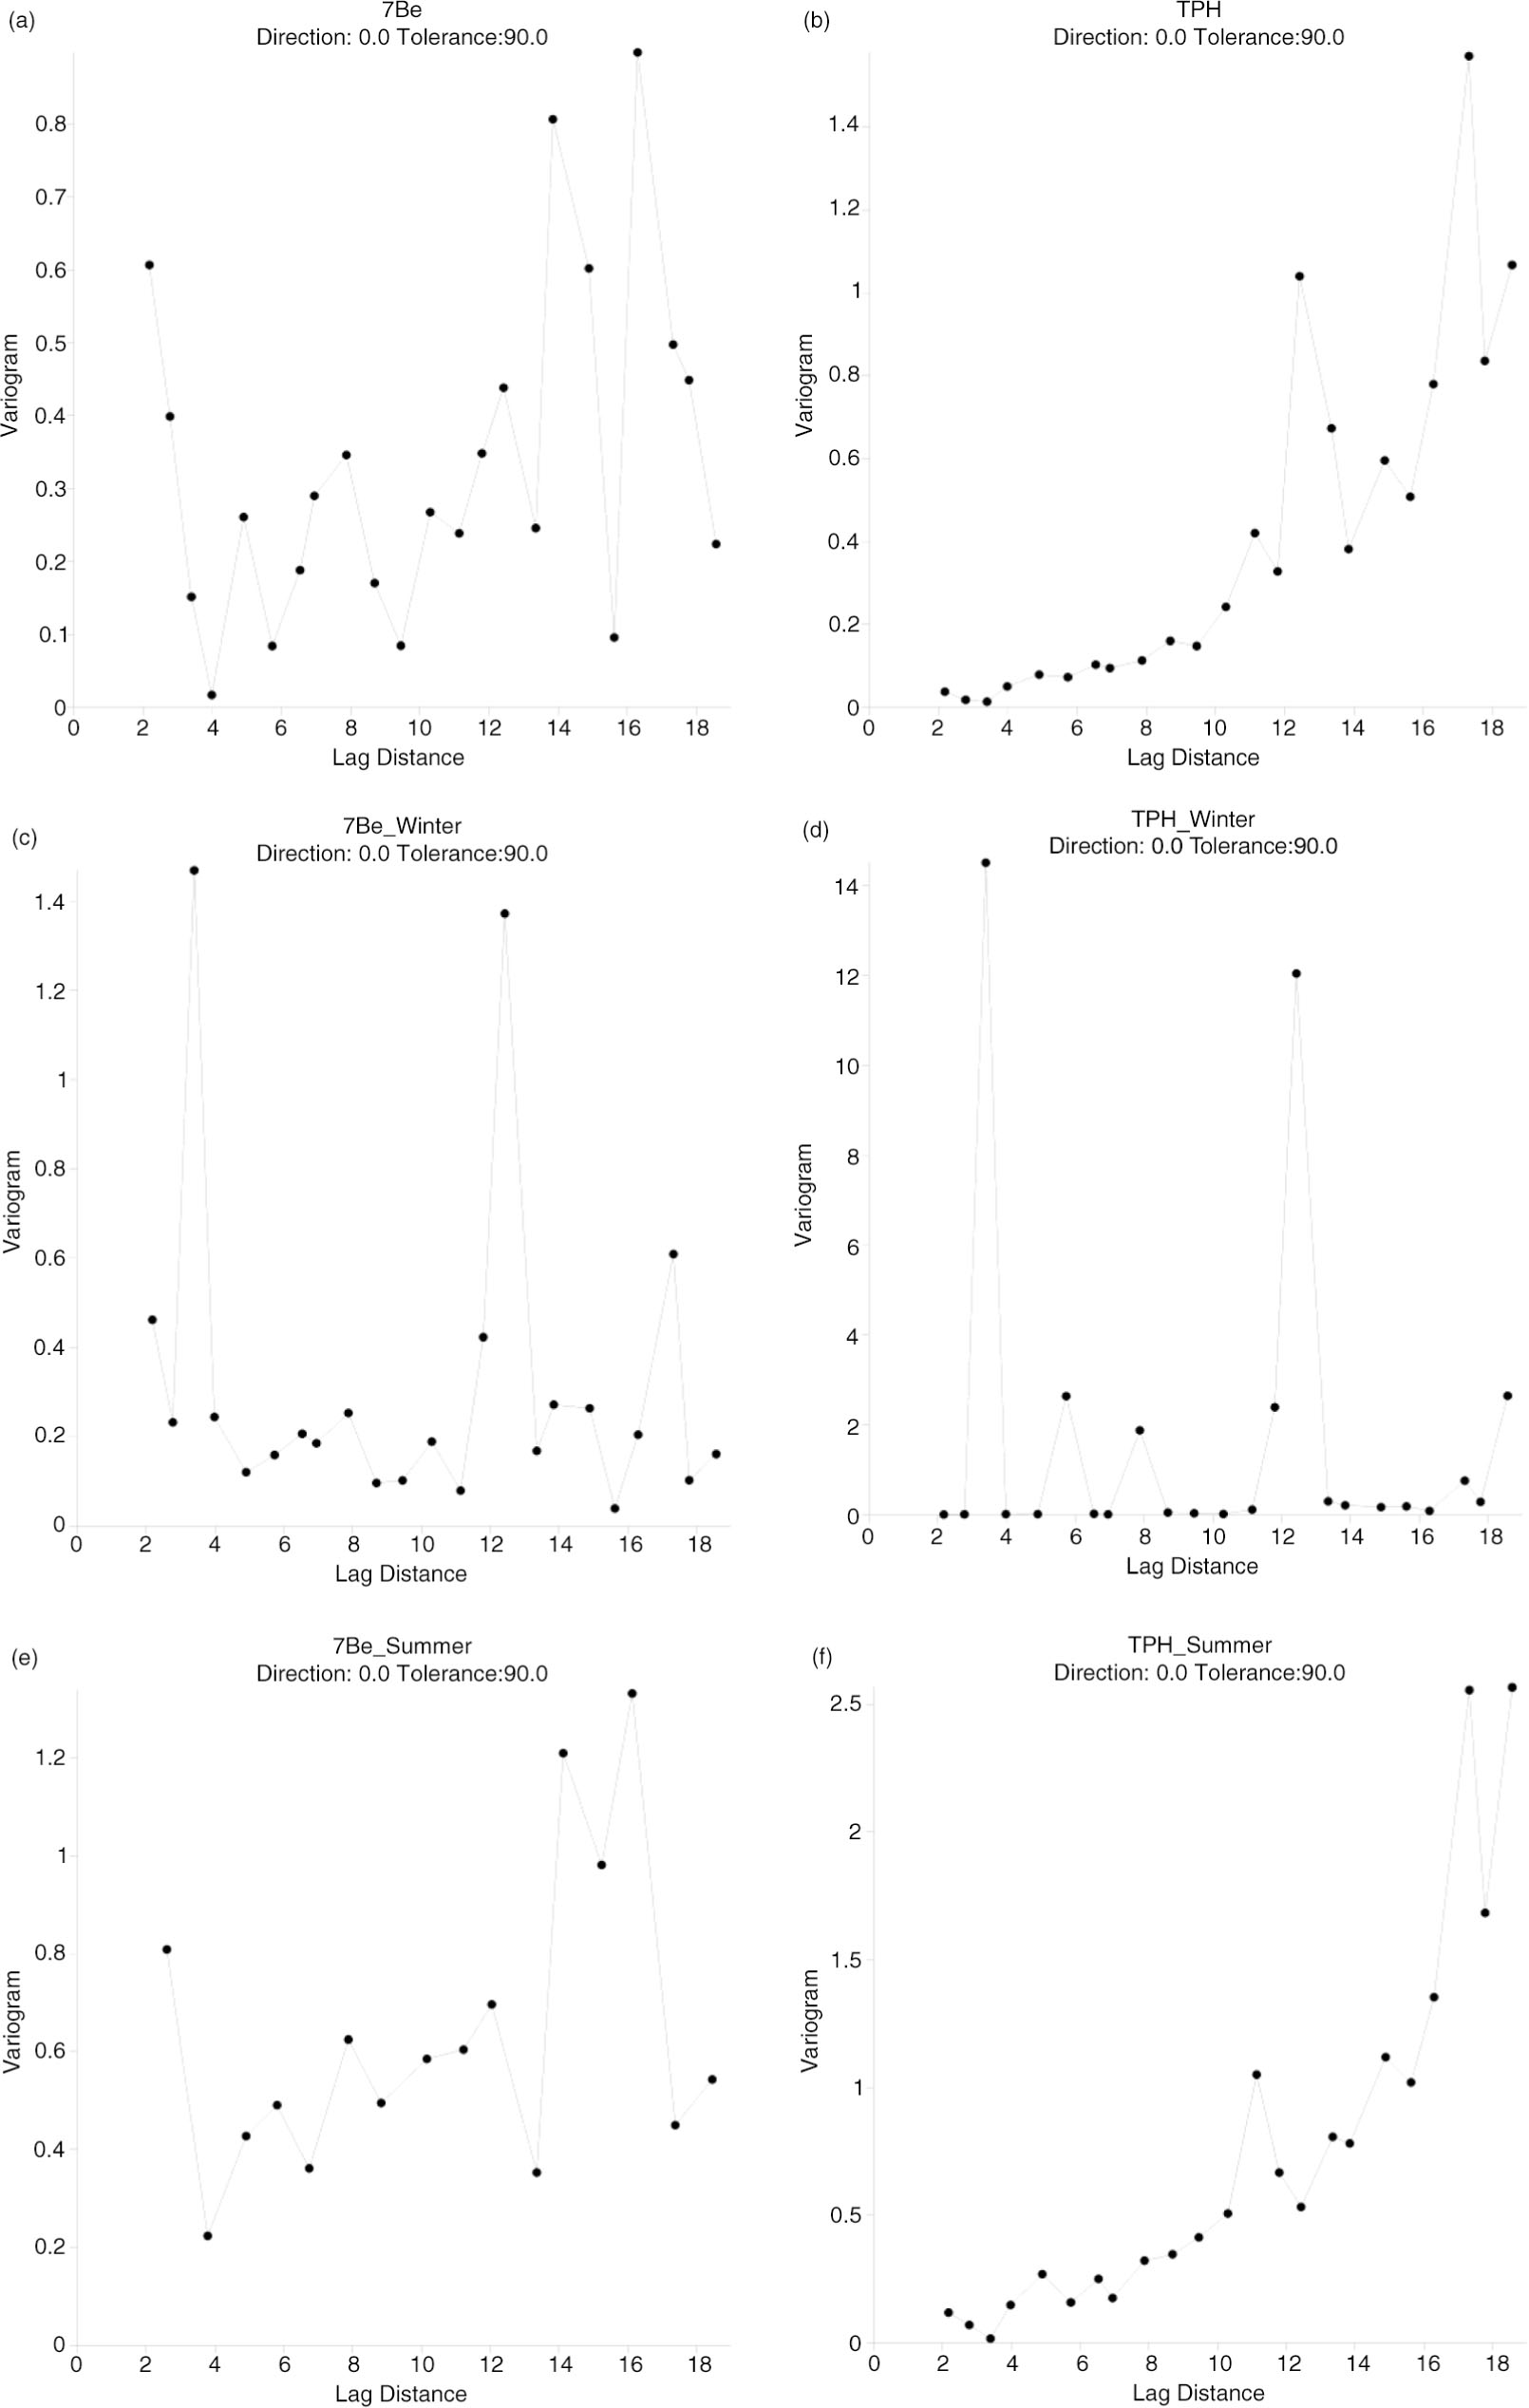
Fig. 2
Variograms for 7Be and TPH: all available data (a and b), and separately winter (c and d) and summer (e and f) seasons.
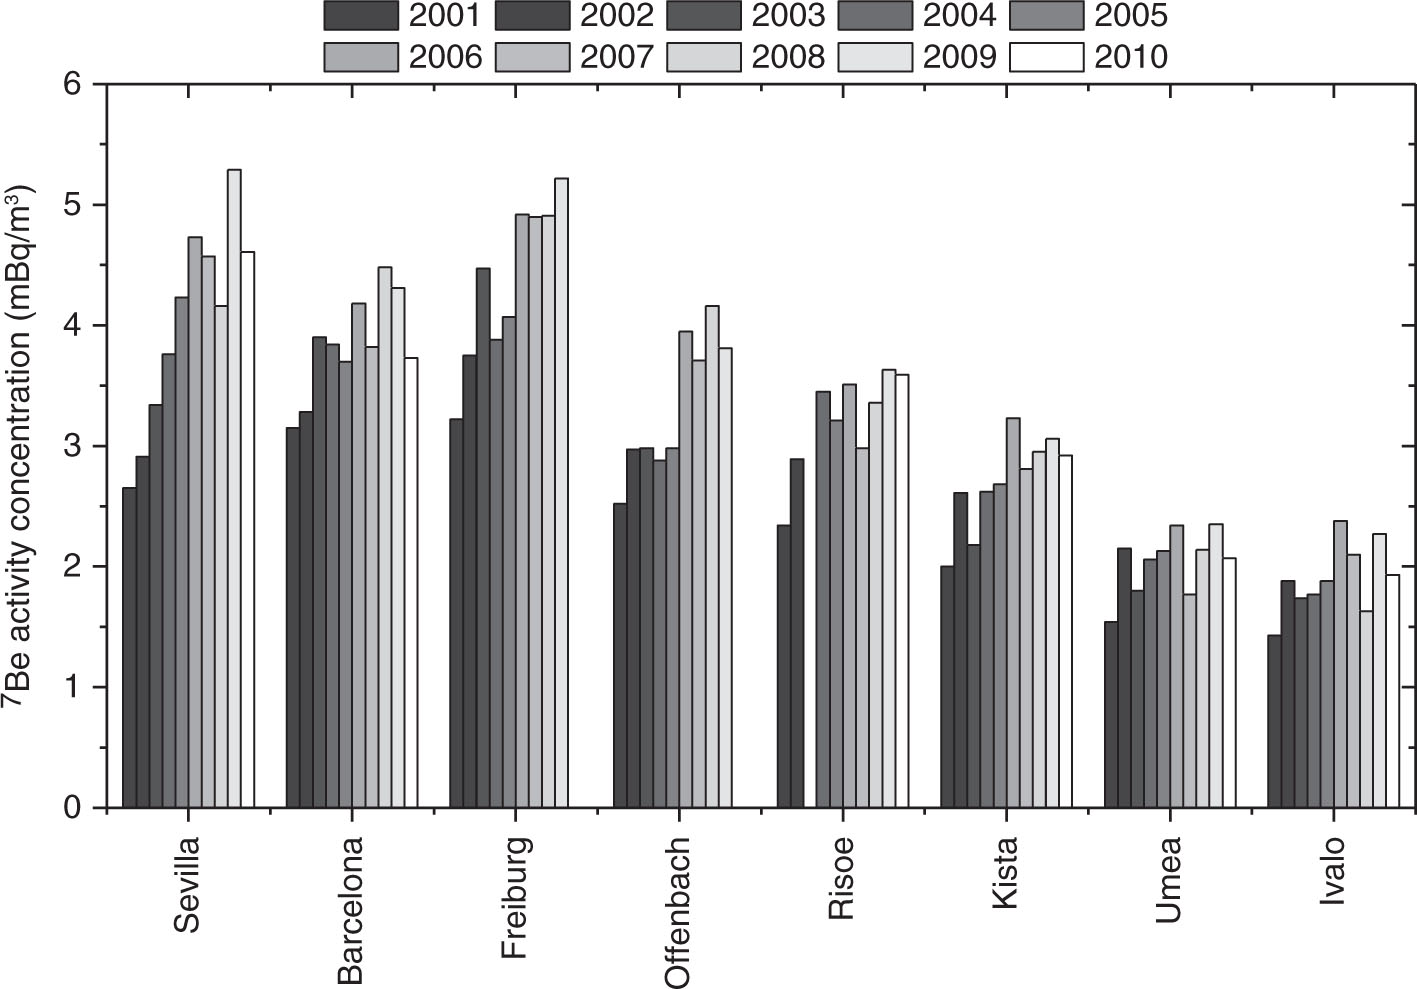
Fig. 3
Interannual variability of 7Be activity concentrations.
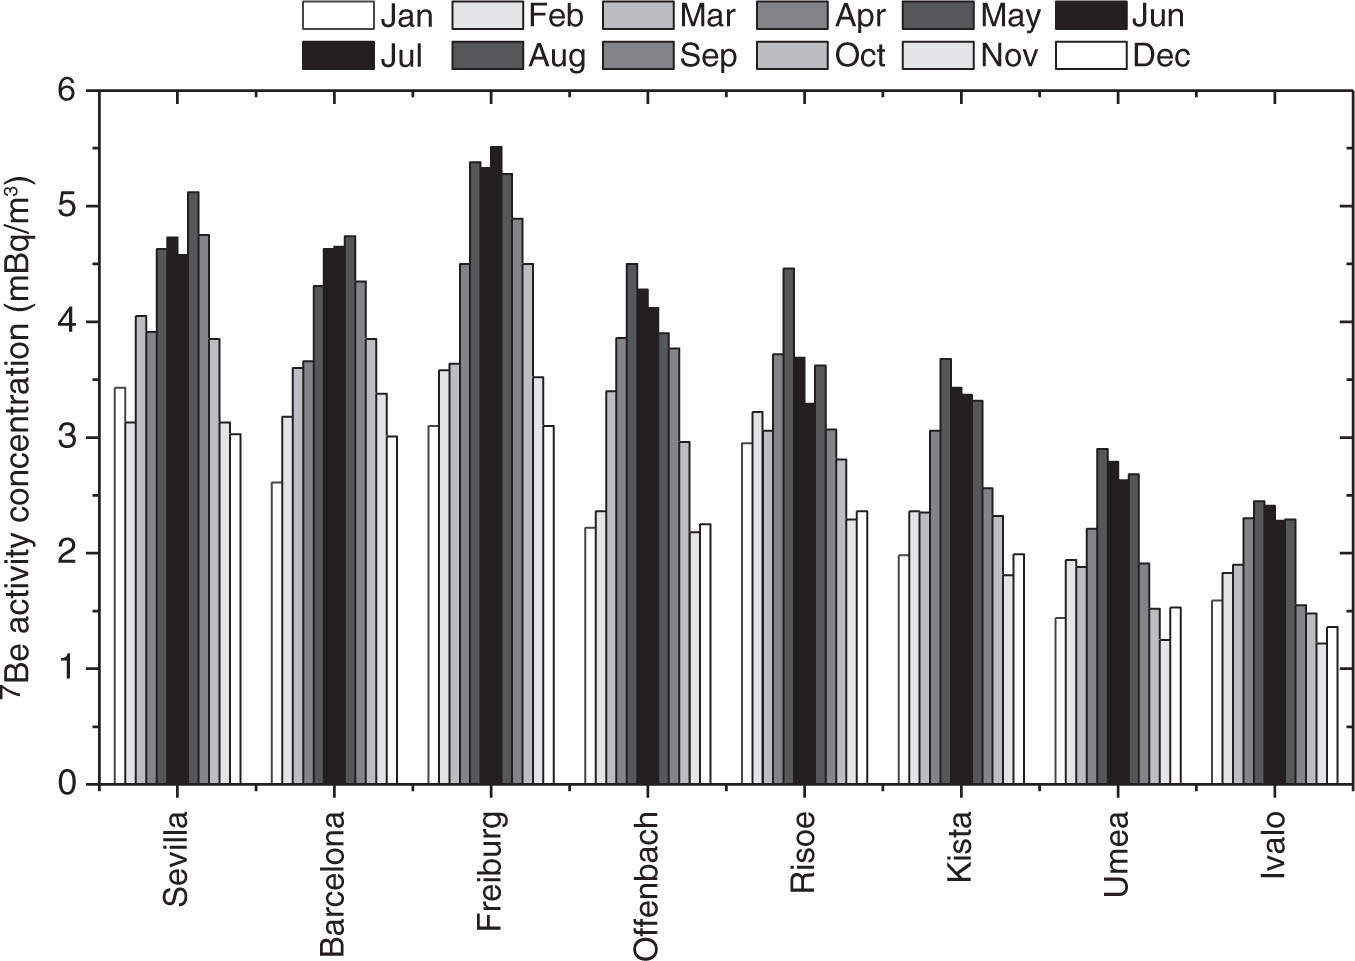
Fig. 4
Mean monthly variability of 7Be activity concentrations (2001–2010).
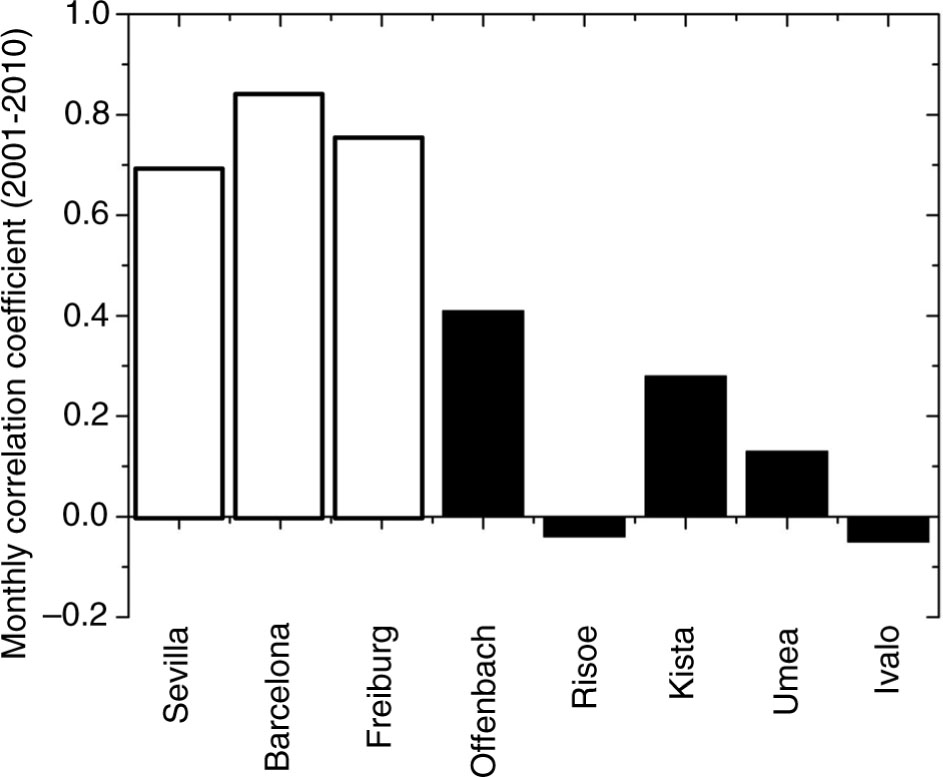
Fig. 5
Correlation coefficient between mean monthly 7Be and TPH (2001–2010). White and black columns denote significant and non-significant correlations, respectively.
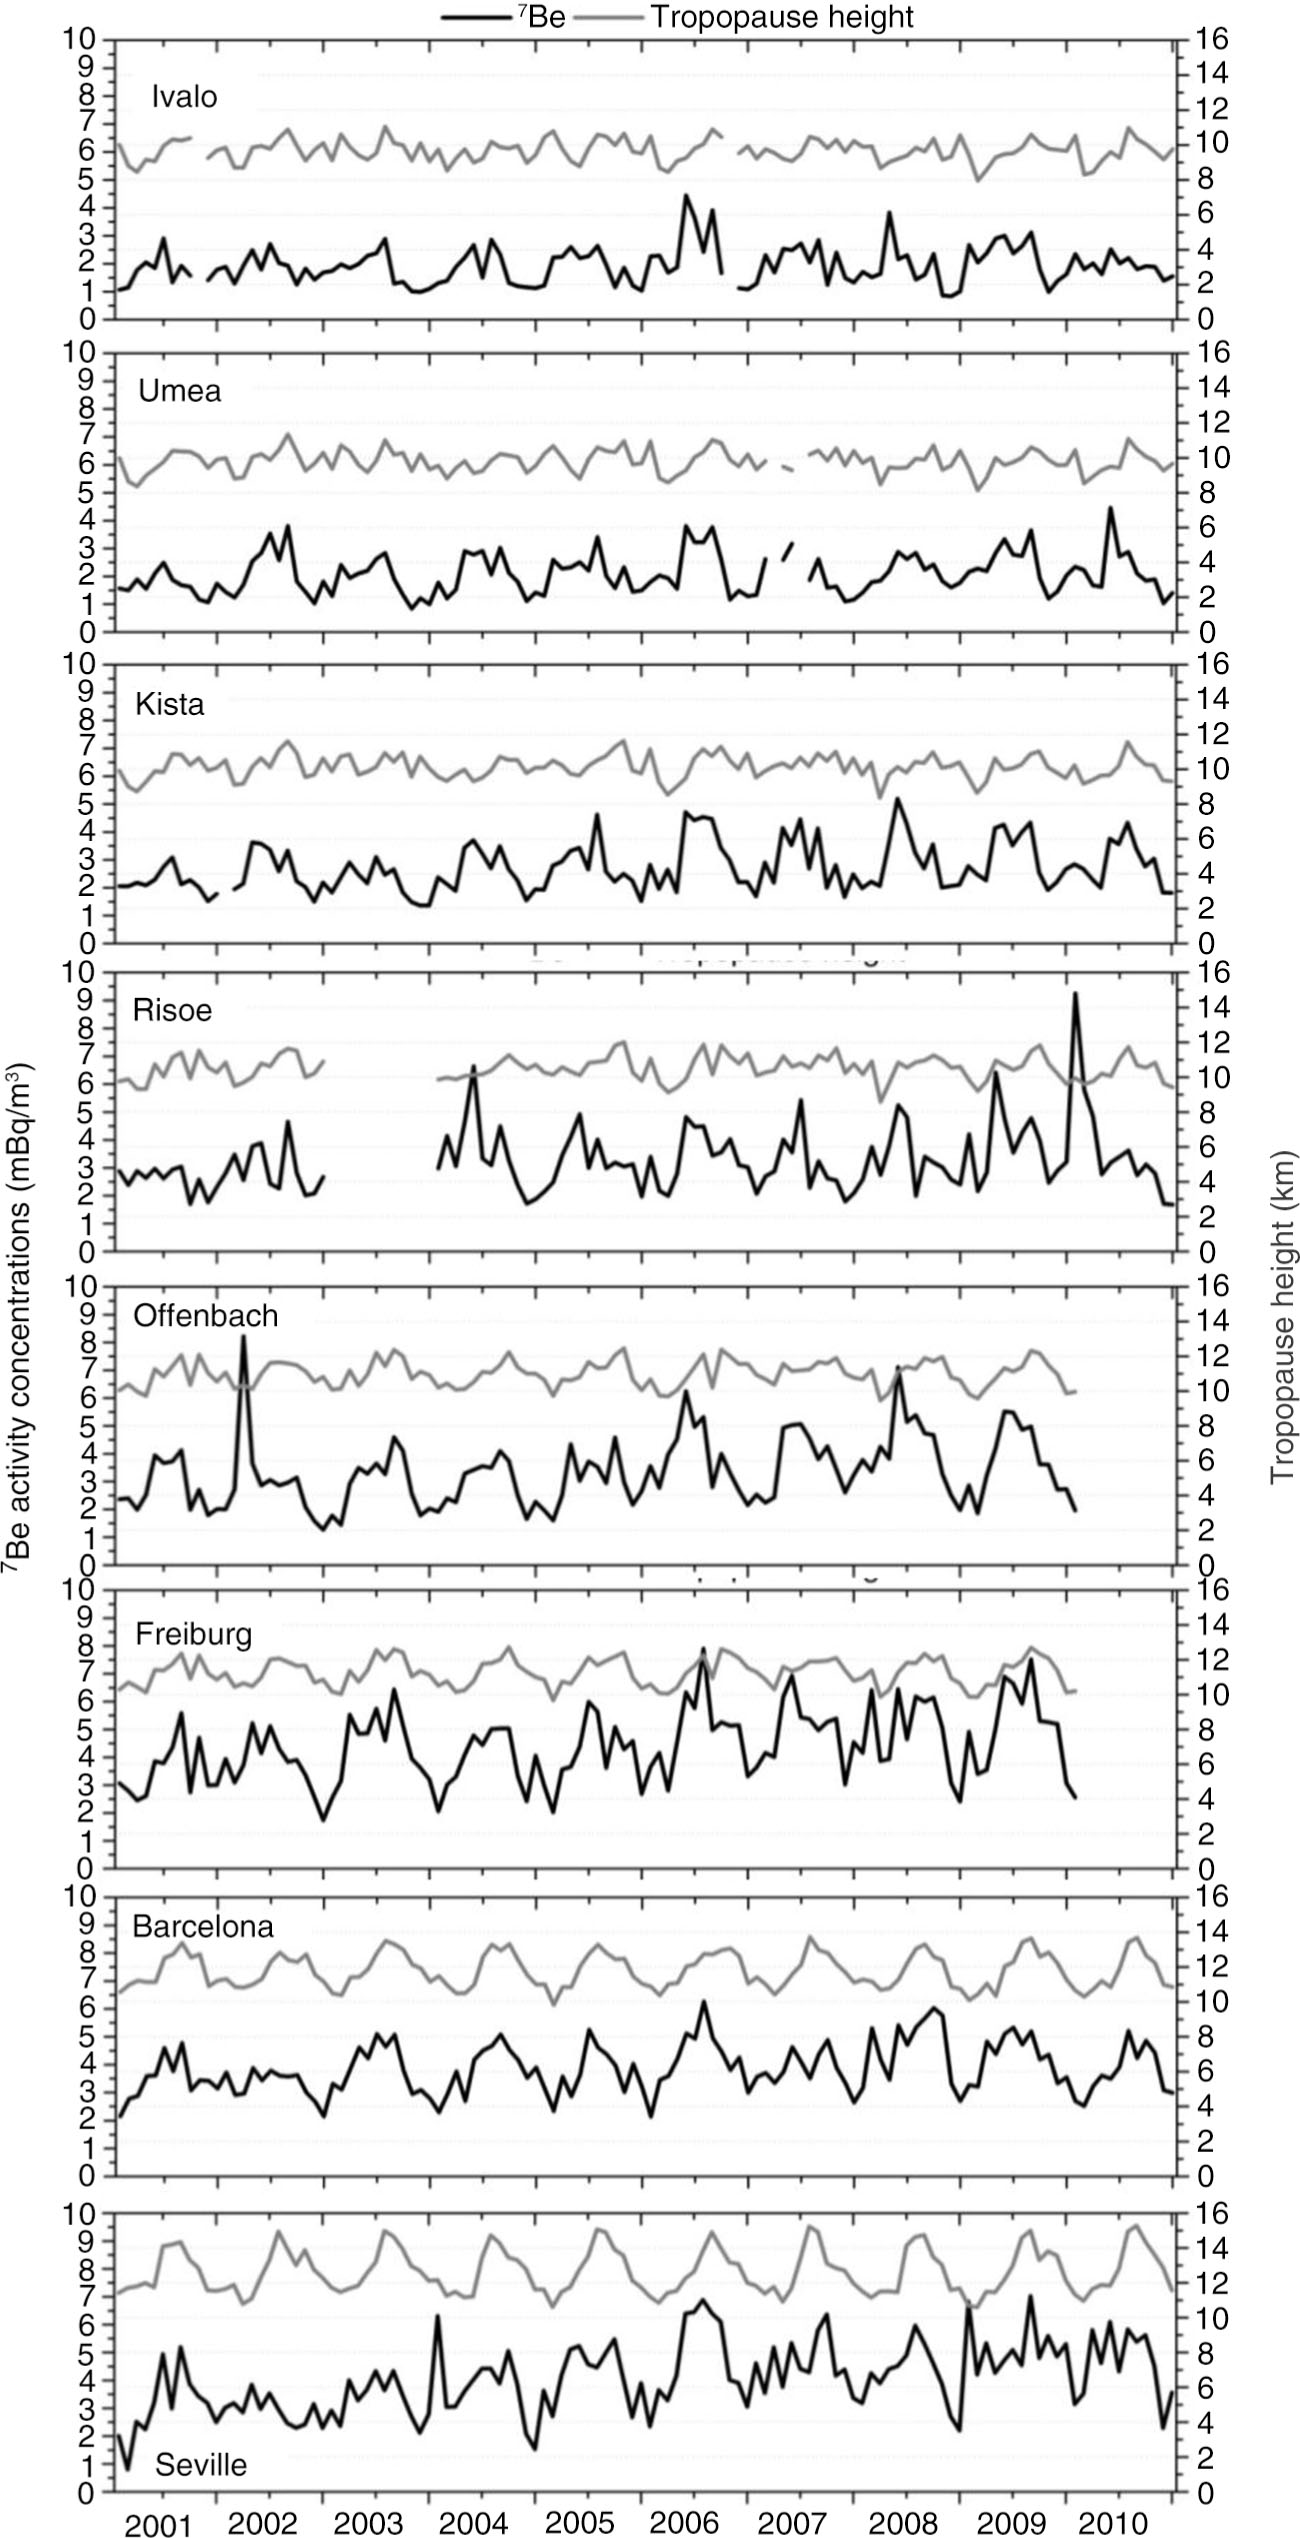
Fig. 6
Latitudinal variation of the monthly evolution of 7Be and TPH (2001–2010).
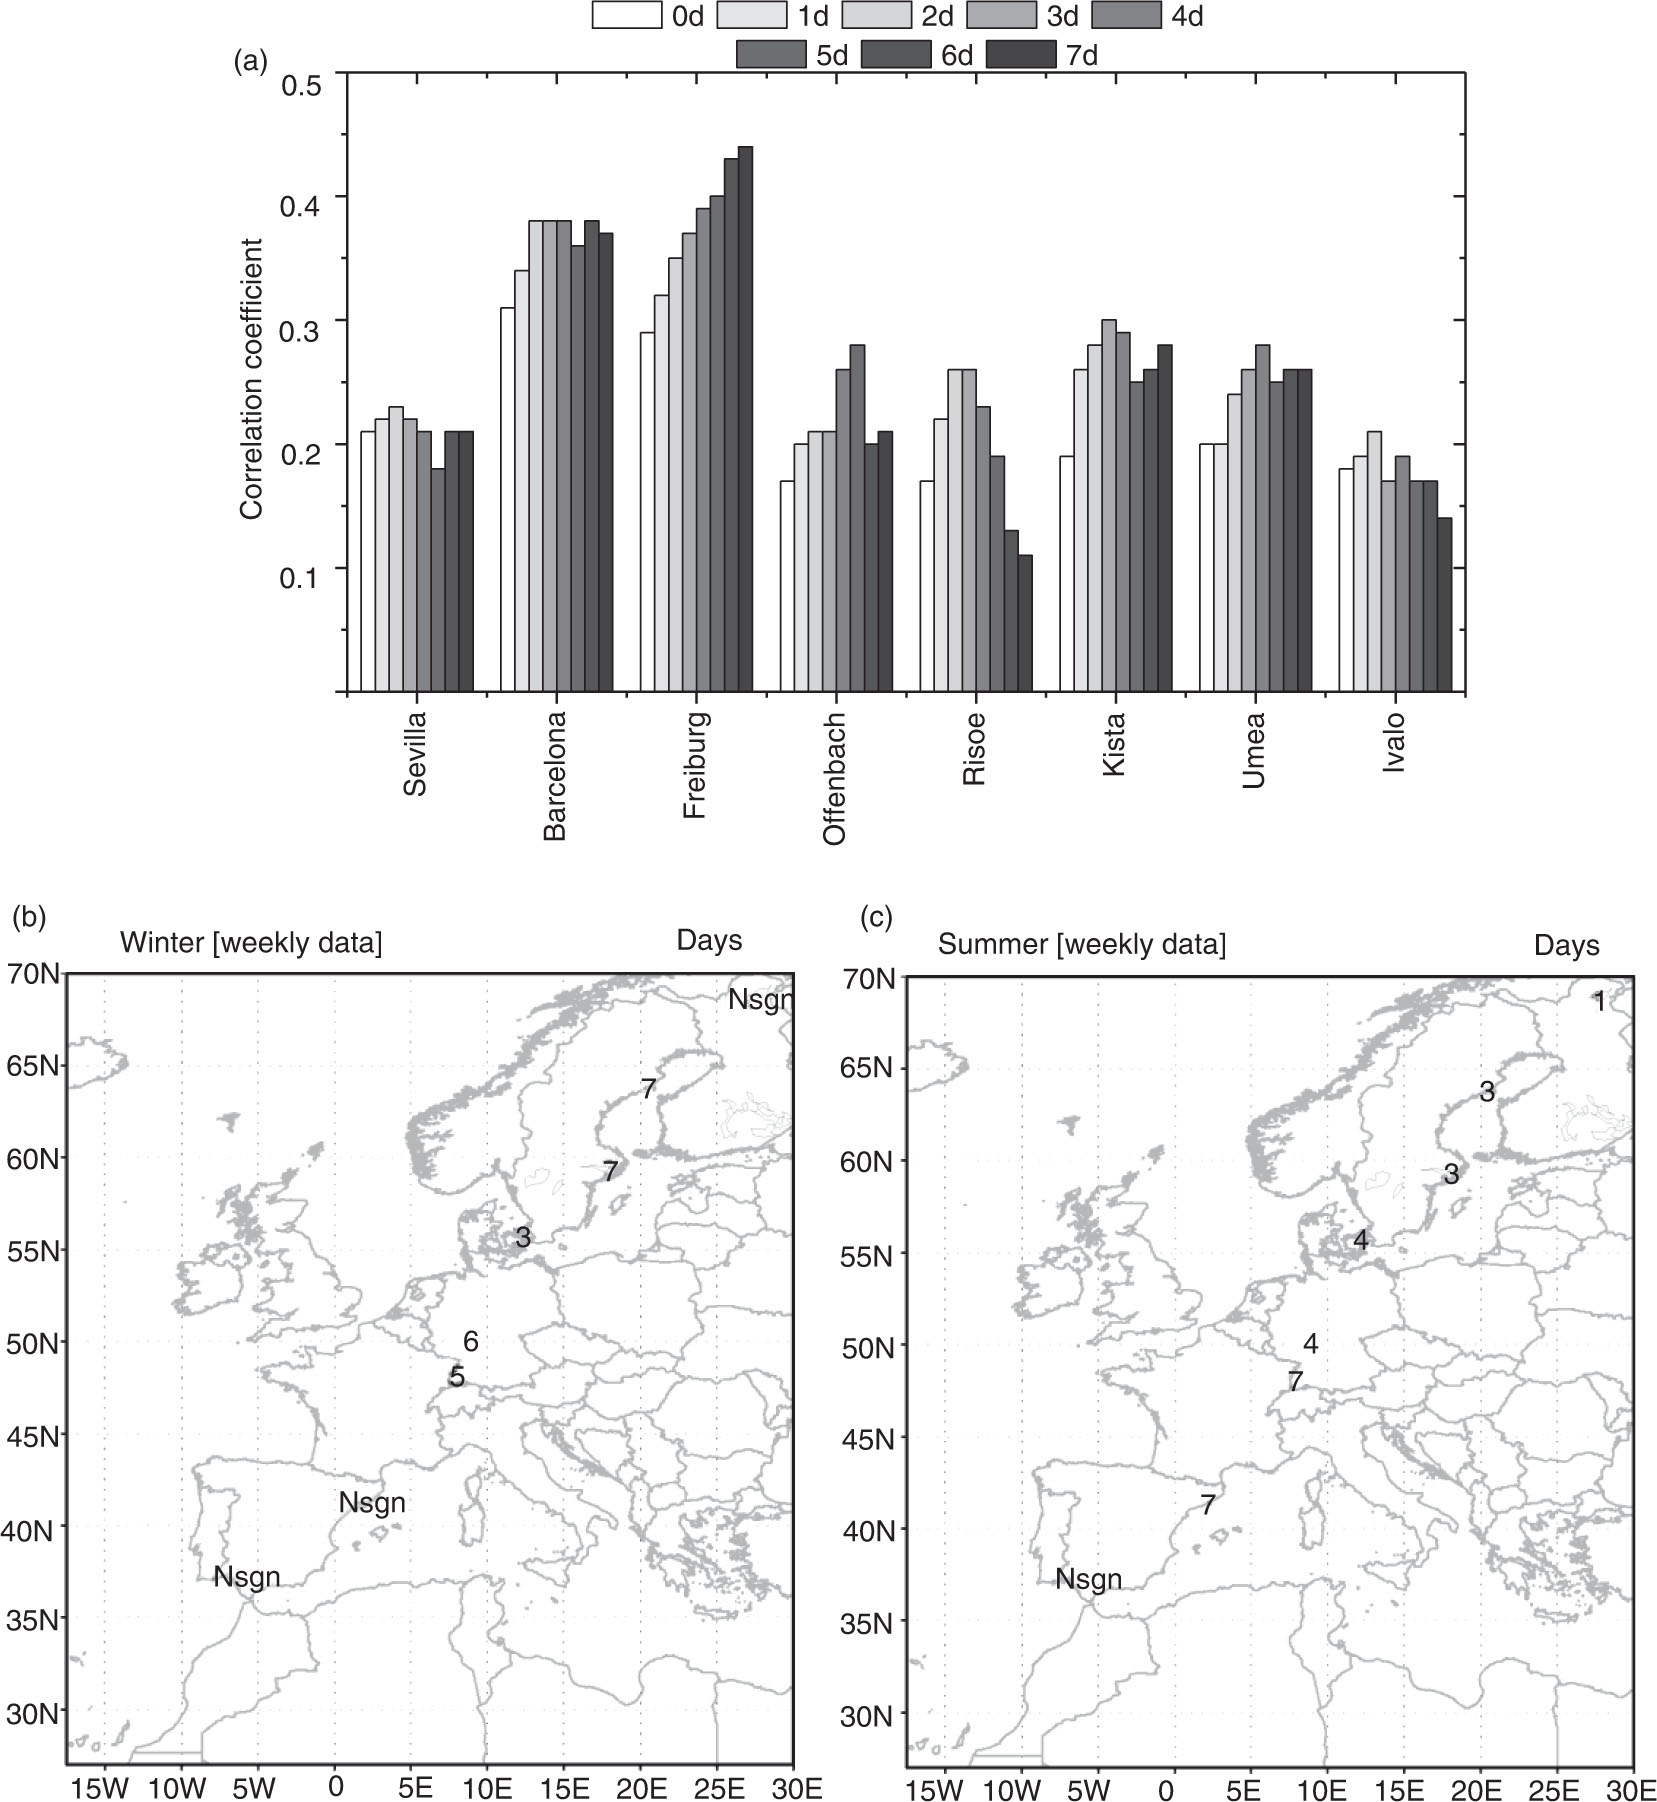
Fig. 7
(a) Correlogram (a time lag from 0 to 7 d) between 7Be surface concentration and tropopause height, and maps showing the day on which the maximum correlation coefficient between TPH and 7Be is observed at the selected stations during (b) winter and (c) summer. ‘Nsgn’ stands for a correlation coefficient not statistically significant.
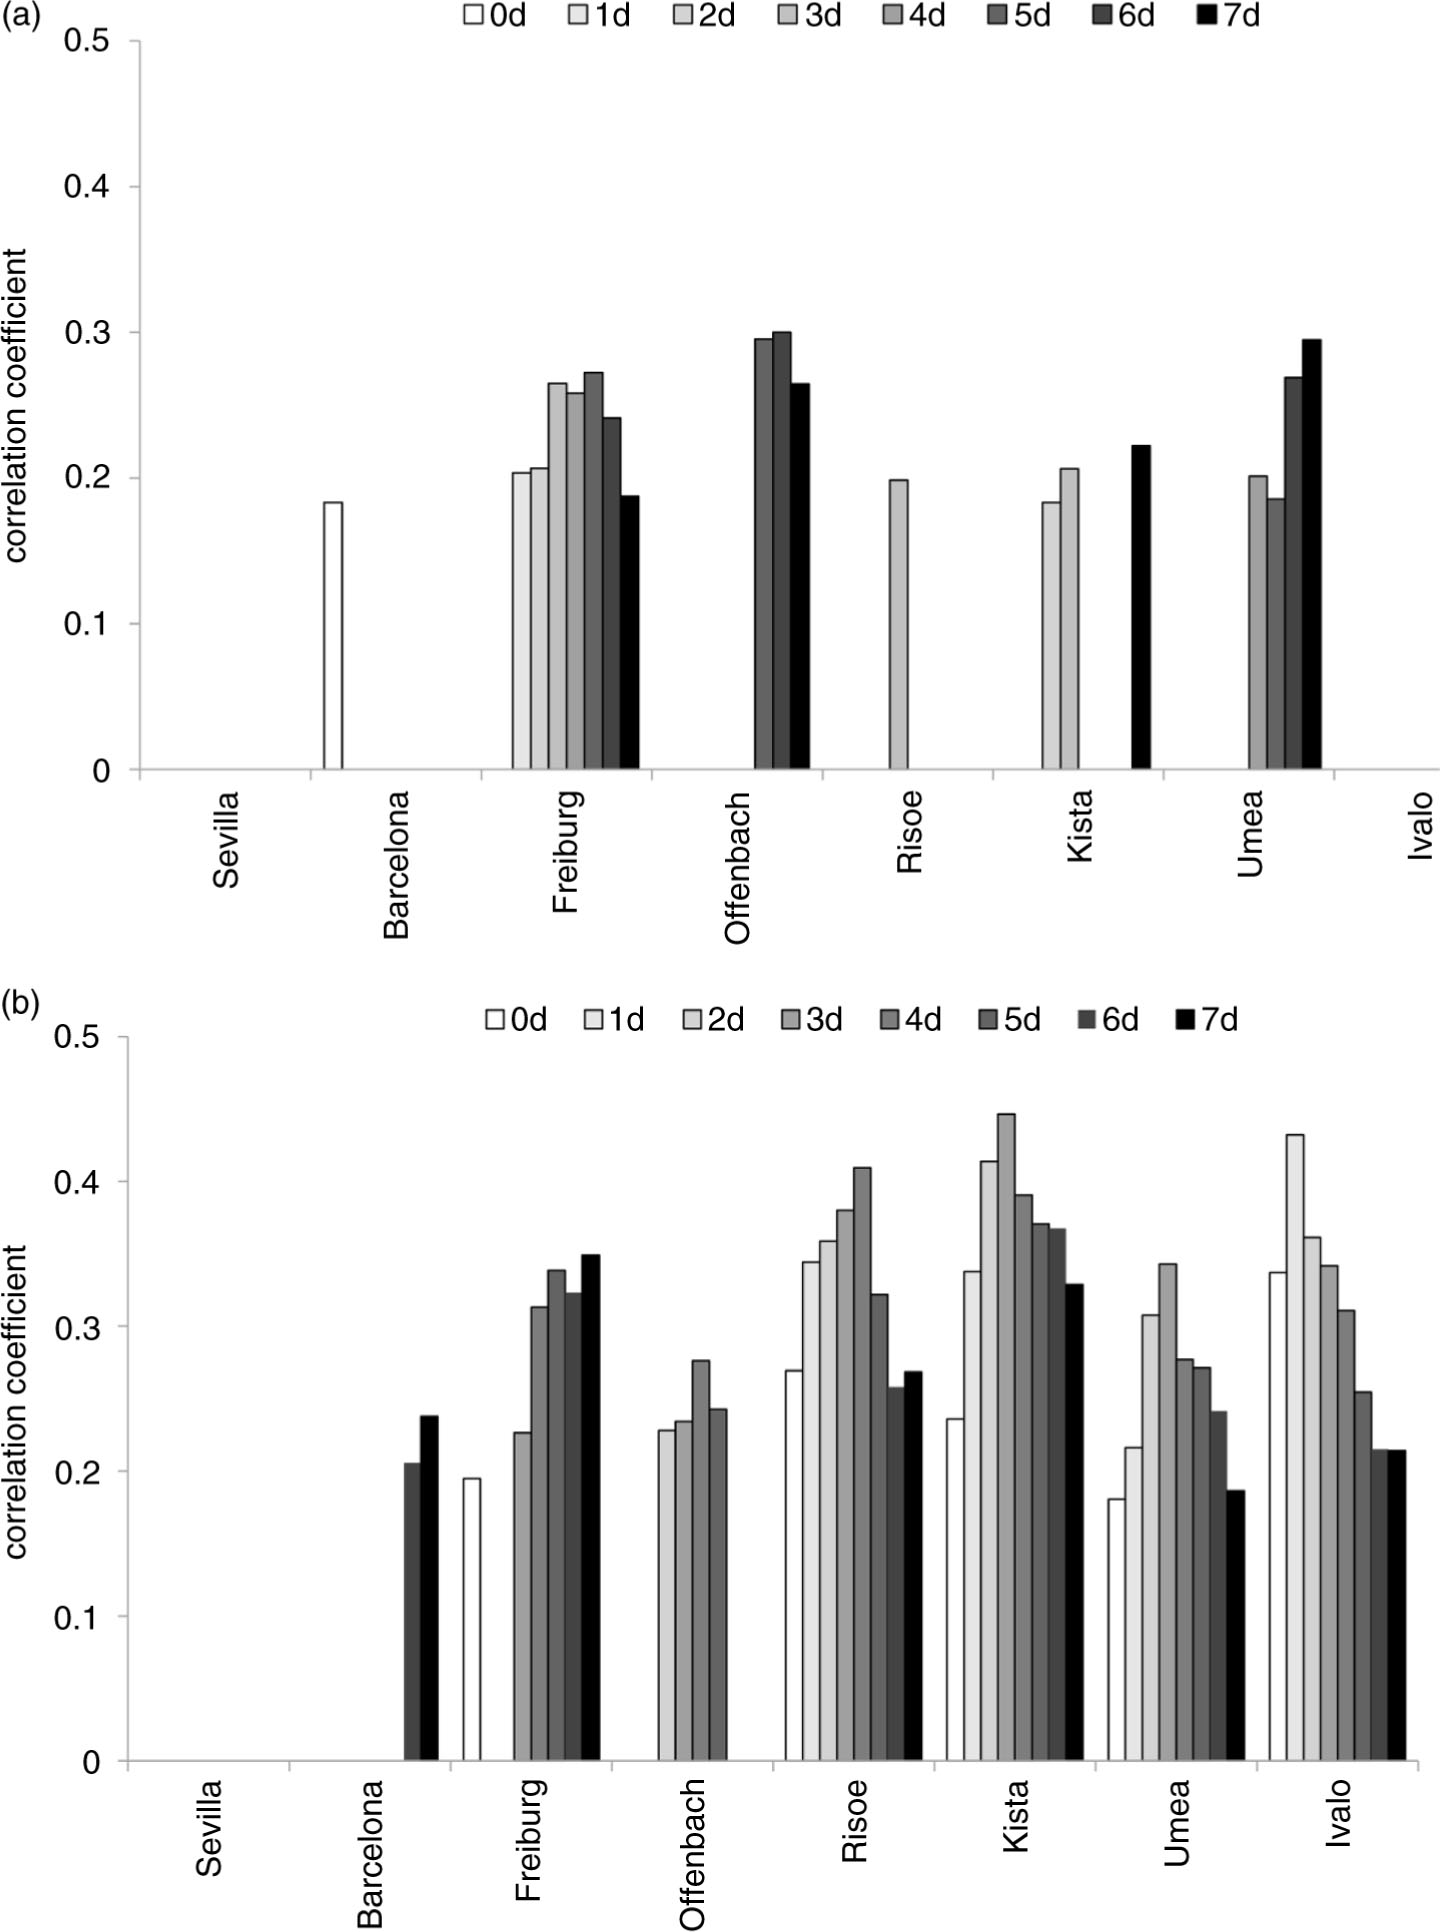
Fig. 8
Winter (a) and summer (b) significant correlation coefficients between 7Be and TPH with a varying time lag from zero to seven for the selected stations.