
1. Introduction
Aerosols are of central importance for atmospheric chemistry and physics (Pöschl, 2005). In the free troposphere, they have a strong influence on direct and indirect radiation effects in the Earth's atmosphere (Andreae, 1995). Some form by the disintegration of bulk material on the Earth's surface (e.g. sea salt and mineral dust), whereas others are produced by chemical reactions (scavenging and loss of gases, aqueous phase reactions) in the atmosphere. The latter are known as secondary aerosols.
In the present (Holocene) climate of Antarctica, various studies have addressed the seasonal concentrations of major aerosol constituents including , , , sea salts (e.g. Na+ and Cl−) and minor aerosol constituents of minerals and carbonaceous species (e.g. soot and organics) (Kerminen et al., 2000; Legrand et al., 2001; Jourdain et al., 2008; Preunkert et al., 2008; Udisti et al., 2012). To better understand the origins of these constituents and the chemical reactions that occur on aerosol particles, single-particle analyses of Antarctic aerosols have been done (Parungo et al., 1979; Artaxo et al., 1992; Hara et al., 1995, 2005, 2013; Mouri et al., 1999). More recently, Hara et al. (2014) showed that most sea-salt particles in the continental region near the coast were modified with acidic sulphur species such as H2SO4 and CH3SO3H. In contrast, other, non-sulphurous acidic species (likely HNO3) contributed markedly to sea-salt modification in inland areas during the traverse.
The same ions (, , , Na+ and Cl−) have also been detected as major components in Antarctic snow precipitation and snowpack (Legrand and Delmas, 1985, 1986, 1988a, 1988b; Mulvaney and Wolff, 1994; De Angelis and Legrand, 1995; Kreutz and Mayewski, 1999; Wagnon et al., 1999; Isaksson et al., 2001; Suzuki et al., 2002; Delmas et al., 2003a, 2003b; Davis et al., 2004; Dibb et al., 2004; Huey et al., 2004; Iizuka et al., 2004; Fischer et al., 2007). The consistency between the aerosol and snow composition suggests that past aerosols are well preserved in Antarctic snow. However, due to the high volatility of and (Wagnon et al., 1999; Röthlisberger et al., 2002), melted samples of surface snow, firn and Holocene ice from inland Antarctica contain mainly sodium, chloride and sulphate ions (Legrand and Delmas, 1988a; Legrand and Mayewski, 1997; Petit et al., 1999; Watanabe et al., 2003; Iizuka et al., 2004, 2006; Wolff et al., 2006; Fischer et al., 2007). These ions are considered to come from primary sea salt (sodium chloride) and marine biological activity (methane sulphonic and sulphuric acids) in the Southern Ocean (Legrand and Delmas, 1985, 1988a, 1988b; Legrand et al., 2001; Wolff et al., 2006; Fischer et al., 2007; Jourdain et al., 2008; Preunkert et al., 2008; Udisti et al., 2012). As these soluble aerosols typically travel more than several hundred kilometres from the Southern Ocean to inland Antarctica, with very little aerosol added from the Antarctic ice sheet, the composition of soluble aerosols sampled inland is a good indicator of how secondary aerosols are formed (Legrand and Delmas, 1988b; Kerminen et al., 2000; Delmas et al., 2003a). In addition, inland Antarctica contains many deep ice cores from which one can reconstruct past aerosol fluctuations (Petit et al., 1999; Watanabe et al., 2003; Wolff et al., 2006; Fischer et al., 2007). However, interpretation of the aerosol record requires knowledge of aerosol modification.
In previous studies, aerosol constituents in snow were determined using bulk analysis techniques, mainly ion chromatography. For example, in the present Antarctic atmosphere and snow, Cl−/Na+ ratios from ion chromatography are used to infer sea-salt modification (Legrand and Delmas, 1988b). This ratio is lowest during the winter because cyclones frequently carry sea-salt aerosols (Na+ and Cl−) from the Antarctic sea to the inland ice sheet (Jourdain et al., 2008; Udisti et al., 2012). The mole ratio is highest in summer, when marine biological activity produces a great deal of sulphuric acid, which then passes into the atmosphere and promotes sulphatisation (Preunkert et al., 2008). In addition, gaseous Cl− (HCl) likely transports more easily inland than particulate NaCl and Na2SO4.
To obtain the concentrations of salt and acid in snow and ice, we previously proposed the ion-deducing method (IDM) to deduce the salt concentrations from ion concentrations in snow and ice (Iizuka et al., 2008). The method is based on two assumptions about salt-formation priority: (1) sulphate has the highest salt-formation priority due to vaporisation of HNO3 and HCl (Legrand and Delmas, 1988b; Röthlisberger et al., 2003) and (2) nitrate has a higher salt-formation priority than chloride (Kerminen et al., 2000). For the Dome Fuji ice core (inland Antarctica), the deduced salt concentrations agreed well with the major salts identified from direct measurements of impurities in ice by Raman spectroscopy (Ohno et al., 2005, 2006).
As another analysis method, we developed a sublimation method capable of collecting several hundred non-volatile particles from a small ice sample at temperatures below −50 °C (Iizuka et al., 2009, 2012a). This sublimation method can be applied to surface snow and firn (Iizuka et al., 2012b). By applying scanning electron microscopy and energy dispersion X-ray spectrometry (SEM–EDS) to the particles from the sublimated samples, we can determine each particle's constituent elements and also classify the particle as insoluble or soluble. For salt concentrations, both the combination sublimation–EDS method and the IDM method have a close relationship at depths from the surface snow to 4-m depth in the Dome Fuji region (Iizuka et al., 2012b). However, the relation is less close for Holocene ice of the Talos Dome ice core (Iizuka et al., 2013), which was drilled in a coastal area (Delmonte et al., 2010; Stenni et al., 2011). Specifically, the particles in the Talos Dome ice contain a lot of NaCl according to the sublimation–EDS method. But the IDM method showed that the major salt is Na2SO4 without NaCl, due to the Holocene ice having more than Na+. This implies that sea-salt sulphatisation proceeds in the coastal region, and the reactant NaCl remains even when enough H2SO4 exists to react with the sea salt.
Thus, to clarify how much and where the secondary aerosols form on the Antarctic ice sheet, we can use not only the Cl−/Na+ ratio and the IDM model but also single-particle analyses by the sublimation–EDS method. These methods had not yet been applied to a spatial study of single-particle analyses in the surface snow of Antarctica. To evaluate the Cl−/Na+ ratio and the IDM model, we collected and identified non-volatile particles in the surface snow from coastal to inland regions of East Antarctica. Here, we obtain the atomic ratios of Na, S and Cl, and calculate the masses of sodium sulphate and sodium chloride in surface snow to determine how much the sea salt in surface snow becomes modified during transport from the coast (north) to inland (south).
2. Sampling site and analytical procedures
The samples came from the traverse route in Queen Maud Land, East Antarctica, by the 54th Japanese Antarctic Research Expedition (Fig. 1). On this campaign, the team collected samples in summer of 2012/2013 while travelling from site S16 (69°01′45″ S, 40°03′01″ E, 534 m a.s.l.), near Syowa Station, to inland Antarctica at 80°S and 45°E via Dome Fuji Station (77°19′01″ S, 39°42′12″ E, 3810 m a.s.l.). All sampling sites lie within 69°S to 80°S, and 39°E to 45°E (1022–3803 m a.s.l.). For comparisons, in this area, Suzuki et al. (2002) measured ion concentrations of surface snow during 1999/2000, and Hara et al. (2014) measured single-particle constituents in the atmosphere during 2007/2008.
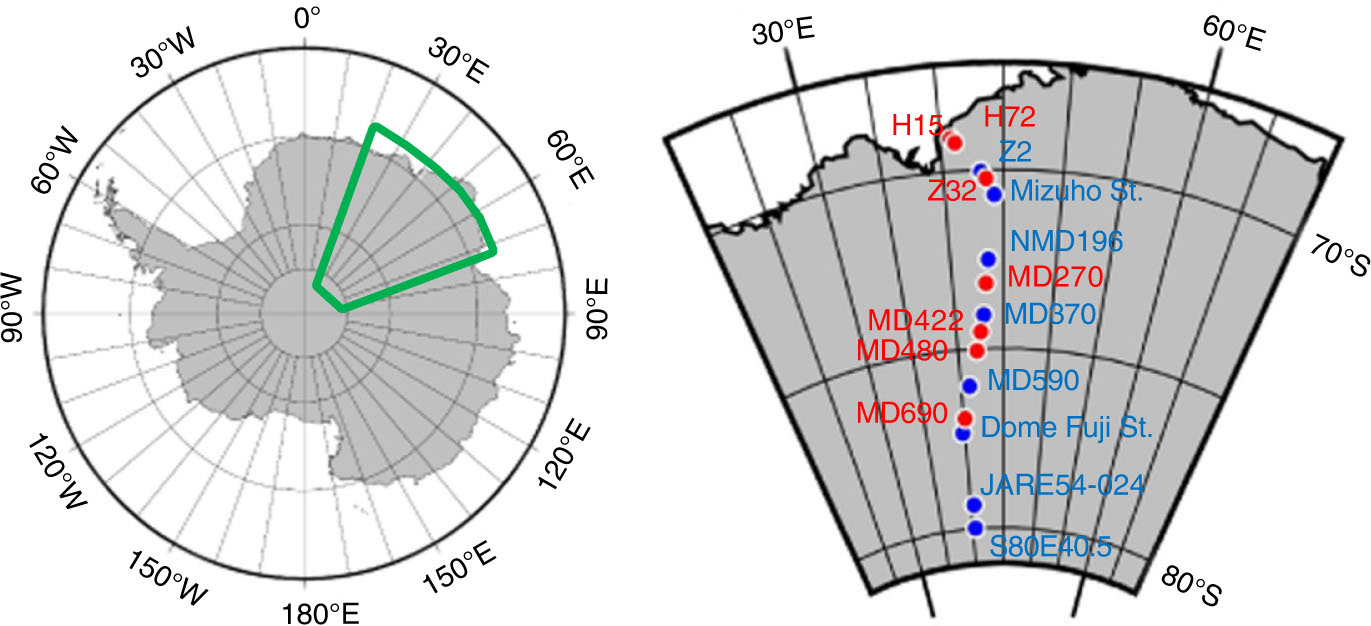
Fig. 1
Region of study and sampling sites in East Antarctica. The green boundary in the left map shows the location in Antarctica. At right, an enlarged region shows locations of snow samples. Blue marks spots where several tens of centimetres were extracted, and red marks spots where only freshly fallen surface snow was extracted. The base map is from GMT free software.
We collected seven samples of freshly fallen surface snow up to a 5-cm depth. These samples are considered as snowpack from summer precipitation. To compare to precipitation over the past several years, we also collected eight samples of snow cover from the surface to 30- to 80-cm depth. Pits with 30–80 cm depth were dug, and innerwall snow was removed using a cylindrical sampler. As a result, each snow sample represents several years of accumulated snow. After well mixing the snow cover sample in a clean bag, we put the samples into clean plastic bottles. Before their use, these bottles and tools were cleaned in an ultrasonic bath using ultra-pure water in a clean room at the National Institute of Polar Research, Japan. The sample dates, source locations and particle properties are listed in Table 1.
Table 1. Particle sampling sites, their positions and dates
H1569.0740.77102213223 Nov 2012055050.83H7269.2041.08118516723 Nov 2012054560.87Z270.0443.15192440625 Nov 20120801950.79Z3270.2543.55206045326 Nov 2012053480.72Mizuho70.7144.27221554027 Nov 20120503620.81NMD19672.5143.6428455373 Dec 20120503731.05MD27073.1743.3530635535 Dec 2012052551.13MD37074.0642.9833385678 Dec 20120503610.91MD42274.5242.6234315739 Dec 2012053691.06MD48075.0542.17353758510 Dec 2012055030.83MD59076.0341.13368462112 Dec 20120503830.89MD69076.9340.12375468114 Dec 2012054340.80Dome Fuji77.3239.70380371413 Jan 20130304610.96JARE54-02479.3640.51367889028 Dec 20120303480.91S80E40.580.0040.5036259443 Jan 20130303670.81
We did laboratory analyses for the major soluble ion concentrations and chemical component analysis of the non-volatile particles. For analysis of major ion concentrations, the ice samples were melted in cleaned bottles and then their concentrations of soluble ions were measured using ion chromatography (Dionex, DX500) following the scheme in Miyake et al. (2009). These major ions include
 , Cl–,
 , NO3,
 Na+,
Na+,
 , K+, Mg2+ and Ca2+. We previously proposed the IDM to determine the concentration of salt compounds for the Dome Fuji ice core (Iizuka et al., 2008). The IDM is based on the assumption that salts form at different rates, in the order (fast-to-slow) of (1) CaSO4, (2) other sulphate (Na2SO4 and MgSO4), (3) nitrate and (4) chloride. In Antarctica, the contribution of
is too small. The excess anions (e.g. Cl−) over cations exist as acid (Iizuka et al., 2008).
, K+, Mg2+ and Ca2+. We previously proposed the IDM to determine the concentration of salt compounds for the Dome Fuji ice core (Iizuka et al., 2008). The IDM is based on the assumption that salts form at different rates, in the order (fast-to-slow) of (1) CaSO4, (2) other sulphate (Na2SO4 and MgSO4), (3) nitrate and (4) chloride. In Antarctica, the contribution of
is too small. The excess anions (e.g. Cl−) over cations exist as acid (Iizuka et al., 2008).
For the component analyses, we pulverise 1 g of snow from each sample and sublimate the snow on a polycarbonate filter with a pore size of 0.4 µm (Advantec, K040A013A) at −50 °C using clean, dry air following Iizuka et al. (2009). All filters are coated with platinum for 30 s to a thickness of 10 nm using magnetron sputtering (Vacuum Device, MSP-10). We then analyse the 15 filter samples using a SEM/EDS system (JEOL, JSM-6360LV/JED2201). In this study, each filter yielded several hundred particles exceeding 0.4-µm diameter. Using SEM–EDS at 20 keV, we determine the levels of O, Si, Al, S, Cl, Na, Mg and Ca in the particles. We do not analyse the levels of C and N due to inaccuracies with light elements and because C is a contaminant from the polycarbonate filter. Finally, we assume that Na-containing particles contain sea-salt aerosol.
To determine the sulphate and chloride components, we use the sublimation–EDS method described by Iizuka et al. (2009, 2012a). This method identifies the non-volatile particles and separates the non-volatiles into soluble and insoluble components. Particles containing Si are assumed to have silicate material. Almost all S and Cl in the non-volatile particles are from soluble materials. As the dry air ventilation removes gas materials such as HCl and HNO3, and because remnant liquid droplets (H2SO4) are unstable under the measurement environment (in vacuum at 25 °C), we can assume that any sea-salt modification during the sublimation is negligible (Oyabu et al., 2014). The S and Cl in the non-volatile particles are assumed to be from solid particles such as sulphate and chloride salts (Iizuka et al., 2012a). After considering the possible remaining compounds, we can assume that Na and S in a given particle came from Na2SO4, whereas Na and Cl came from NaCl. For other salts, Ca and S are assumed to come from CaSO4, Mg and S from MgSO4, Ca and Cl from CaCl2, and Mg and Cl from MgCl2. A similar assumption is also adapted for atmospheric aerosols (e.g. Hara et al., 2014). If S (or Cl) is found in particles without Na, Mg or Ca, we regard the S- (or Cl- containing particles as other, unidentified sulphate (or chloride) salts. When a particle has Na, S and Cl, the molar ratio of Na2SO4 and NaCl depends on those of S and Cl as follows: If [Na]<[S]+[Cl] (µeq), then [Na2SO4]=[S]/([S]+[Cl])×[Na] (µeq) and [NaCl]=[Cl]/([S]+[Cl])×[Na] (µeq). If instead [Na]>[S]+[Cl] (µeq), then [Na2SO4]=[S] (µeq) and [NaCl]=[Cl] (µeq).
The calculated uncertainty of the single-particle number and mass ratios follows the method described by Iizuka et al. (2009) and (2012b) respectively. The uncertainty of the number ratio is based on the assumption that the errors follow the Poisson distribution law. Over all samples, the average uncertainty of the number ratio is 5.2 %. For the mass ratio, the uncertainty is based on the coefficient of variation (CV) for each atomicity ratio, based on the average values and SDs of these 20 measurements. For example, the CVs of Na, S and Cl were 0.40, 0.39 and 0.45, respectively. The average uncertainty of the mass ratio Na2SO4 to NaCl is 8.1 % over all samples. For the spherical approximation, the calculated uncertainty for 95 % of the particles is below 0.20. For the ratio of Na2SO4 to NaCl, the average value of CV ratio over all samples is 0.281. The uncertainty values (5.1–28.1 %) are almost the same or less than those from ion concentrations measured using ion chromatography (i.e. 5–10 %).
3. Results and discussion
3.1. Chemical characteristics of soluble particles from coastal to inland regions in Antarctic snow
In going from the coast (ca. 1000 m a.s.l.) to inland (ca. 3800 m a.s.l.), the fraction of Cl-containing particles to total particles decreases and the fraction of S-containing particles increases (Fig. 2). This latter fraction remains consistent among all summer and multiyear samples. As most of the particles contain S or Cl, sulphate and chloride salts are major compounds of the non-volatile particles. For such particles having sulphate or chloride salt, Na is the major metal. This result shows that the major compounds of sulphate and chloride salts are Na2SO4 and NaCl, respectively.
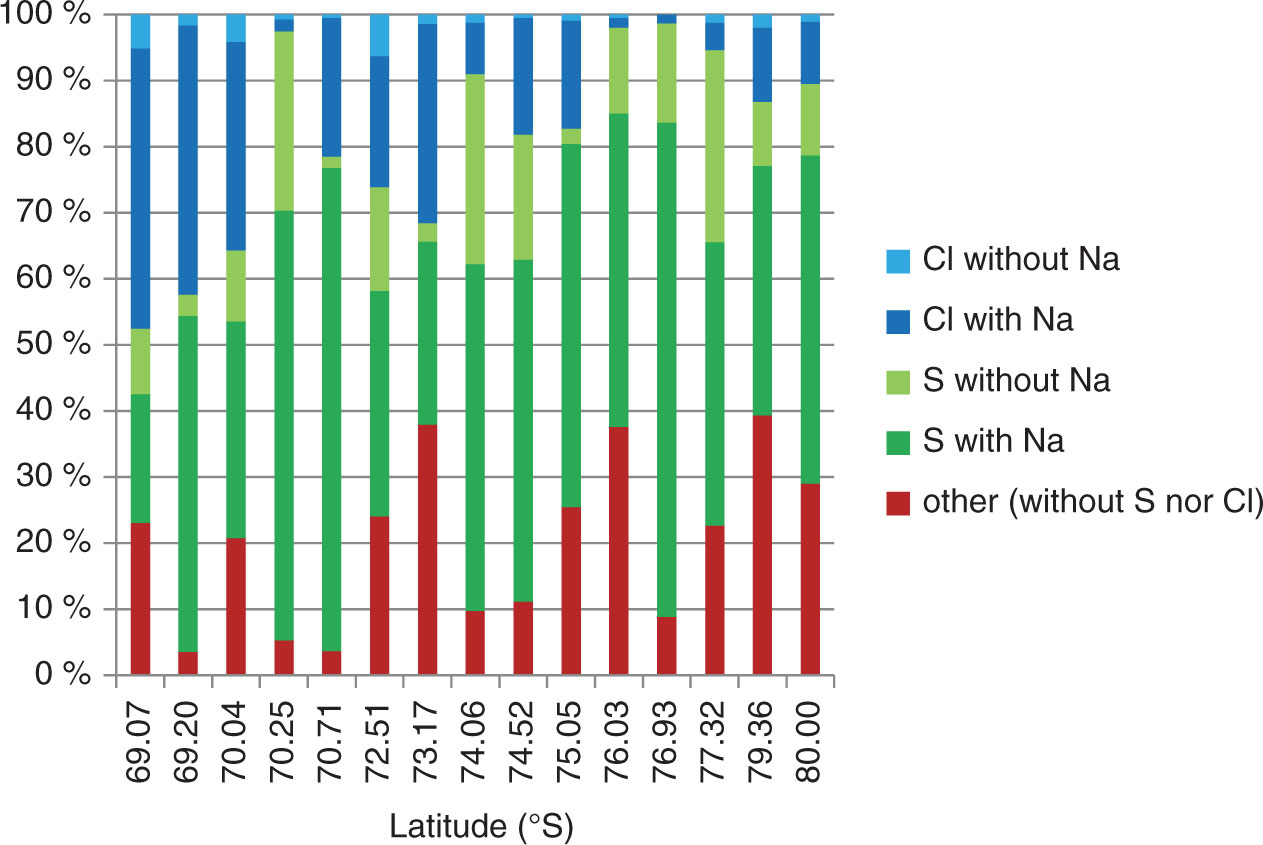
Fig. 2
Elemental distribution of non-volatile particles in surface snow. Each column shows the relative number of particles, at the labelled latitude, having chloride without sodium (light blue), sodium chloride (dark blue), sulphate without sodium (light green), sodium sulphate (dark green) and neither sulphate nor chloride (‘other’, red).
The particles labelled ‘other’ in Fig. 2 have neither S nor Cl. These other particles are likely to be mainly NaNO3 (see later discussion), whereas those that contain Si are likely silicate minerals.
From 69°S (coastal region) to 73°S (ca. 3000 m a.s.l.), about half of all salt-containing particles have NaCl. But from 74°S (ca. 3300 m a.s.l.) to 80°S (inland region), most salt-containing particles instead have Na2SO4 (Fig. 2). This result is consistent among all summer and multiyear samples. Thus, it suggests that, from the coast to inland, the sea-salt (NaCl) sulphatisation reaction (Legrand et al., 1988b) is as follows:
Consider now the ion concentrations at the same locations. Table 2 shows that the major ion species are Na+, Cl−, and from 69°S to 80°S. In agreement with the particle analyses, these ion results show that Na is the major metal and the other three metals are available in minor quantity. Also, the major ions are consistent with the major salts NaCl, Na2SO4 and NaNO3. The results are also consistent with Hara et al. (2014), who seldom found ammonium salts, instead found that some of the major aerosol compositions on the same traverse route are Na2SO4 and NaNO3. NaNO3 is thought to be formed by (Kerminen et al., 2000)
Table 2. Ion concentrations (Cl−, , , Na+; µmol L−1) and Cl−/Na+ ratio
H15102211.501.181.029.691.191.187.33H7211854.290.552.251.752.450.550.65Z219241.610.490.841.211.330.490.23Z3220600.940.570.730.521.800.260Mizuho Station22151.400.861.650.831.690.410NMD19628451.420.361.290.961.480.360.24MD27030631.540.712.600.831.850.420MD37033380.760.451.340.322.390.160MD4223431n.a.n.a.n.a.n.a.MD48035370.570.332.400.144.010.070MD59036841.730.541.510.951.820.470MD69037542.060.751.901.241.660.620Dome Fuji38032.090.801.291.271.640.640JARE54-02436781.870.831.290.872.160.430S80E40.536251.780.732.110.822.170.410
Thus, NaNO3 comes at the loss of NaCl. Because Cl−+ >> Na+ (Table 2), some of the Cl−, and form acids (HCl, H2SO4 and HNO3) and some form salts (NaCl, Na2SO4 and NaNO3).
Consider the Cl−/Na+ ratio. NaCl is the major component of sea salt, and H2SO4 originates from marine biological activity. NaCl and some H2SO4 in this area come from the Southern Ocean via the troposphere, whereas the remaining H2SO4 and HNO3 originate from the stratosphere, passing from inland to the coast (Suzuki et al., 2002). The concentration of Cl− until 70°S (ca. 2000 m a.s.l.) is larger than that of the other two anions (Table 2). In particular, the Cl−/Na+ ratio (1.19) of the 69°07′ S sample is almost the same as the sea-salt ratio (1.18). On the other hand, the Cl−/Na+ ratios of the other 14 inland samples are higher (Table 2). This suggests that most sea salts in these inland-snow samples had been modified to Na2SO4 or NaNO3.
3.2. Sea-salt modification of single particles from coastal to inland regions in Antarctic snow
To further examine sea-salt modification, consider the ternary diagrams of Na, Cl and S atomic ratios in single particles. The bottom-right diagram in Fig. 3 shows how we interpret the diagrams: the yellow circle marks the sea-salt ratio of the three elements. If sea salt reacts with nitric acid, the plot moves on the purple dotted line to the purple circle. The purple circle means that all Cl is lost and the particle consists only of NaNO3. In a similar way, if sea salt reacts with sulphuric acid, the plot moves on the blue dotted line to the blue circle. The blue circle means that the particle consists only of Na2SO4 without NaCl. Similarly, the green dotted line and circle represent the reaction that forms CH3SO3Na. Most of the particle compositions cluster near the purple or blue dotted lines and circles, indicating that the sea salt reacts to form mainly NaNO3 and Na2SO4.
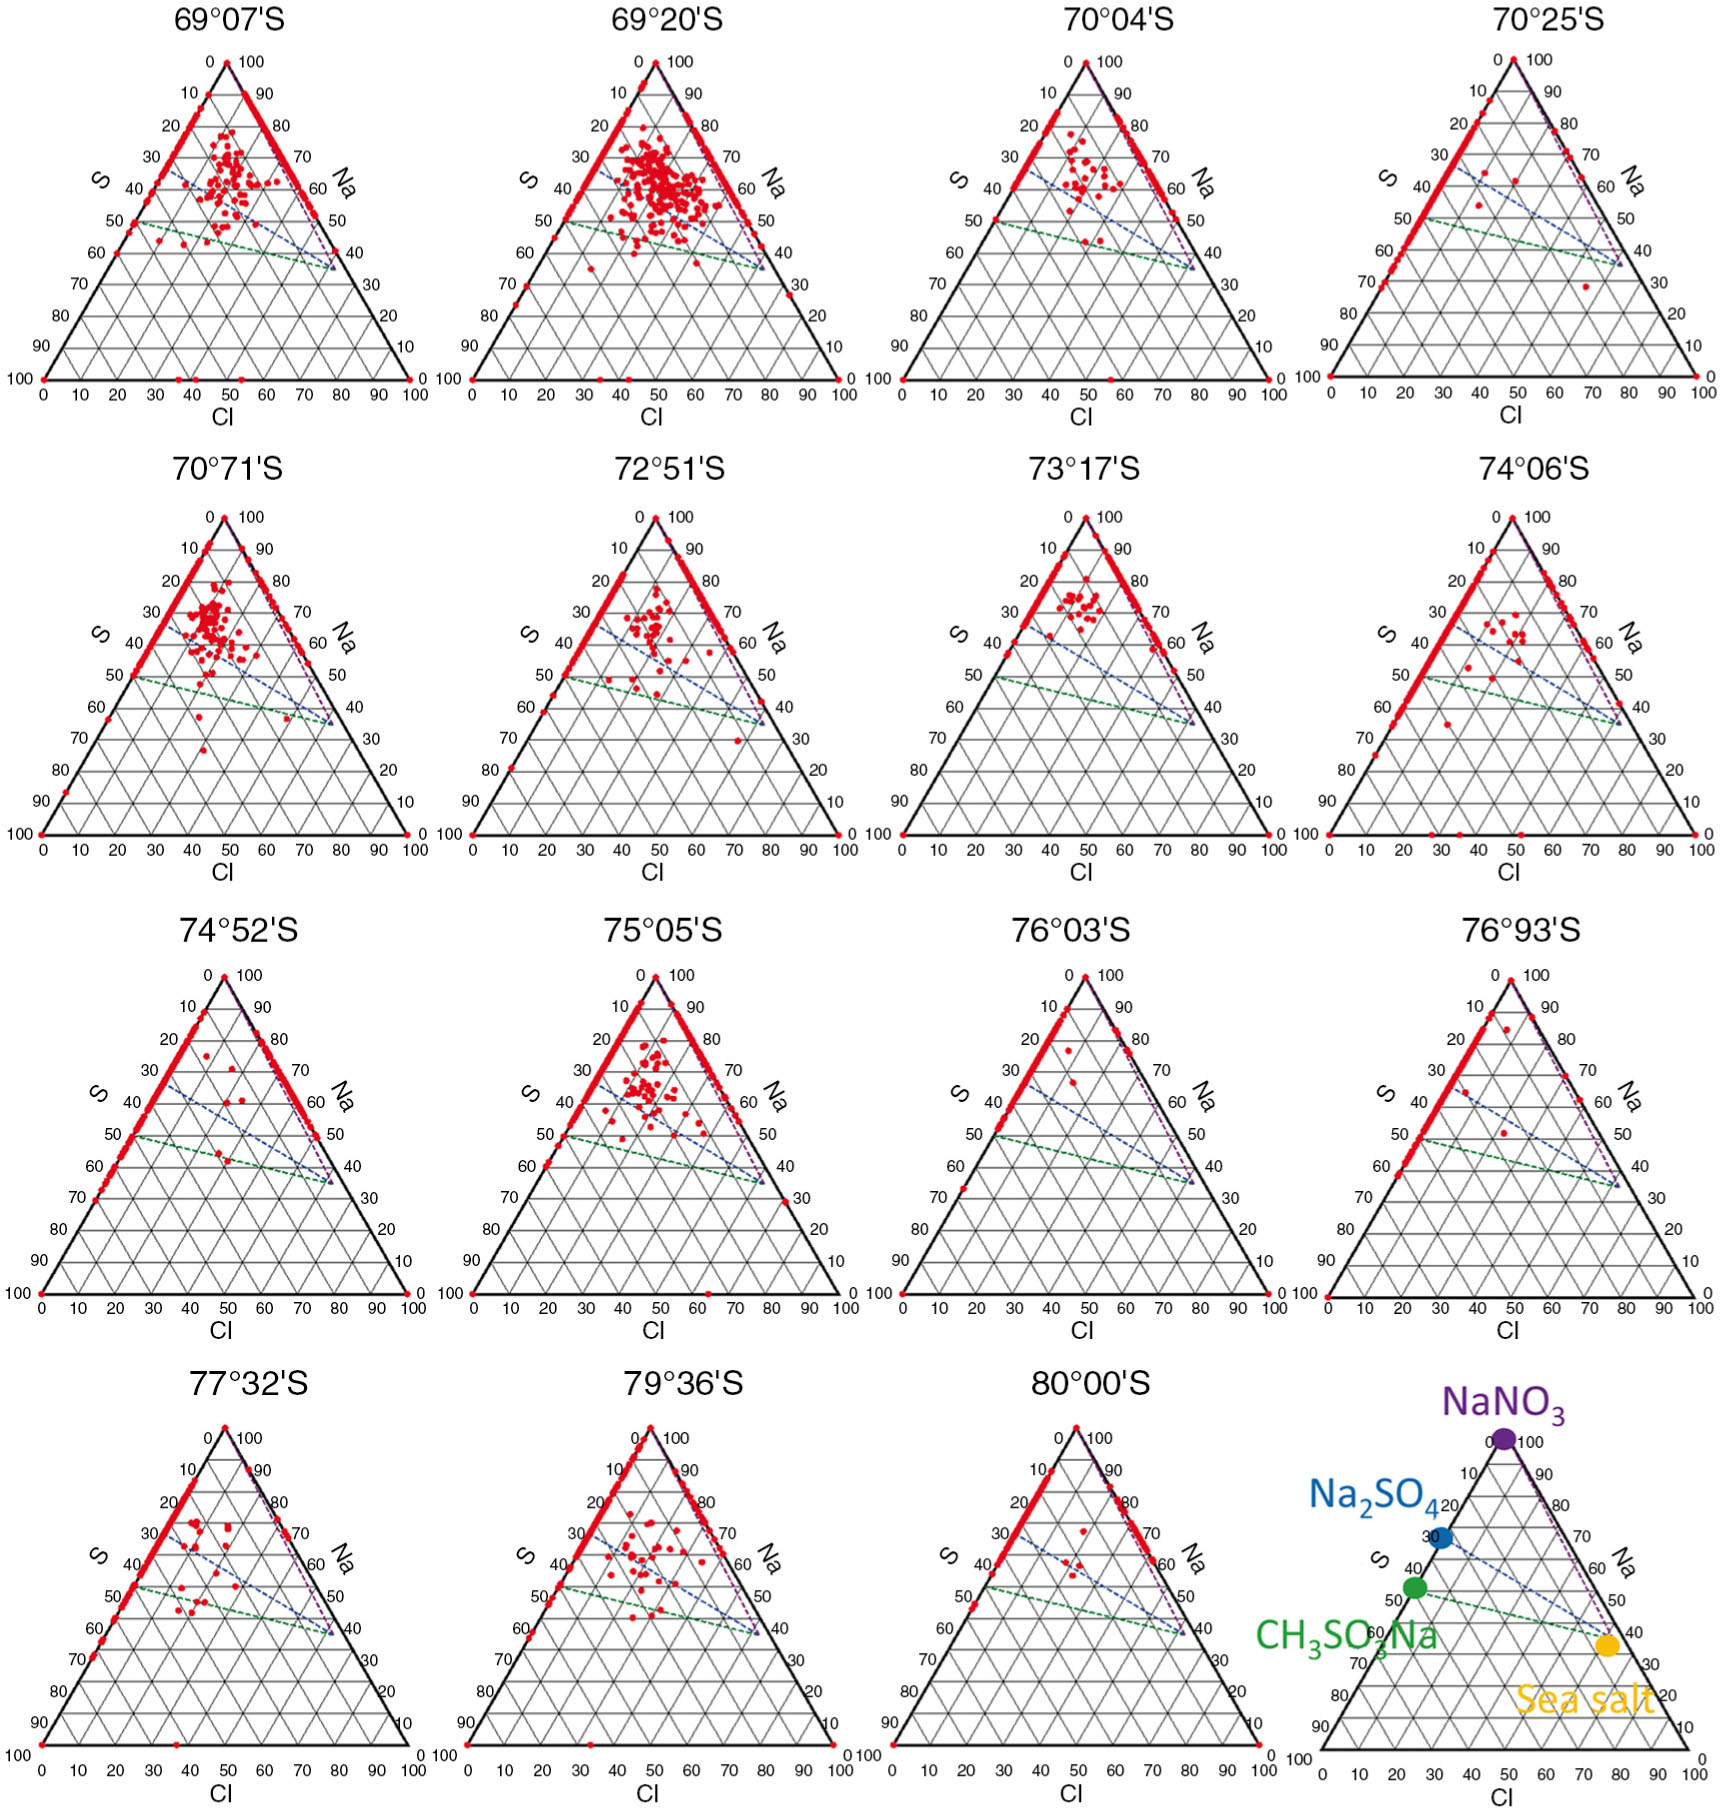
Fig. 3
Ternary plots of Na, Cl and S atomic ratios in non-volatile particles by the sublimation–EDS results. Latitude titles are marked as in Table 1. Yellow, purple, blue and green circles in the bottom-right diagram (right of the 80°S plot) denote the atomic ratios of bulk seawater, wholly Cl-depleted sea-salt particles with nitrates, wholly Cl-depleted sea-salt particles with sulphates and wholly Cl-depleted sea-salt particles with methane sulphonates, respectively.
The scatter in these ternary diagrams exceeds that from previous aerosol analyses on the same traverse route (Hara et al., 2014). Since only a limited number of particles are actually used for EDS, sample heterogeneity may have contributed to the observed scatter. Otherwise, the increase in scatter likely comes from the larger variability in particle trajectories. The previous aerosols were sampled in a short period and thus trace just one trajectory of sea salt in one air mass. In contrast, the present results come from snowpack, in which the snow composition comes from both snow precipitation and dry deposition after the snowfall. Moreover, the summer samples consist of several snowfall events, each one likely following a different trajectory. So, soluble salts in snowpack are considered to contain a range of aerosol compositions over a duration that includes various air masses.
Almost all particles containing Cl are sea-salt products. Even in the 69°07′ S sample, sea-salt modification occurs in many particles. In the 69°07′ S sample, the Cl−/Na+ ratio (1.19) is consistent with the sea-salt ratio. Nevertheless, the sea-salt particles in snow may react with acid (HNO3 or H2SO4) and retain the same Cl−/Na+ ratio. According to Hara et al. (2014), atmospheric aerosols mainly consist of sea salt in spring and mainly modified sea salt in summer. As the snow was sampled in late November (late spring), there are two possible reasons for the spring–summer difference. One is post-depositional effects may cause the difference; sea salt deposited at the 69°07′ S site and then acid (dry deposition) reacted with the deposited sea salt via reactions (1) and (2). As a result, the products are Na2SO4 (or NaNO3) and HCl with the sea-salt ratio of the Cl−/Na+. The second reason is if the two products of Na2SO4 (or NaNO3) and HCl deposit on the same level on snowpack, modified sea-salt particles can be obtained under the sea-salt ratio in bulk snowpack. It also may be a mix of the two reasons.
Below 3000 m a.s.l. (73°S), about half of the sea-salt particles reacted with nitric acid, whereas above 3300 m a.s.l. (74°S), the sea-salt particles instead mainly reacted with sulphuric acid (Fig. 4). Indeed, from 76°S to 77°S (near Dome Fuji at 3700 to 3800 m a.s.l.), almost all sea-salt particles reacted with sulphuric acid. This finding contrasts with Hara et al. (2014), who found that the inland sea-salt particles in atmospheric aerosol instead mainly reacted with nitric acid. The difference between these results may be due to (1), with snow, the acids can continually deposit, thus increasing in amount, and (2), after depositing in or on the snow, the nitric acid may volatilise via the equilibrium reaction 2NaNO3+H2SO4 → Na2SO4+2HNO3.
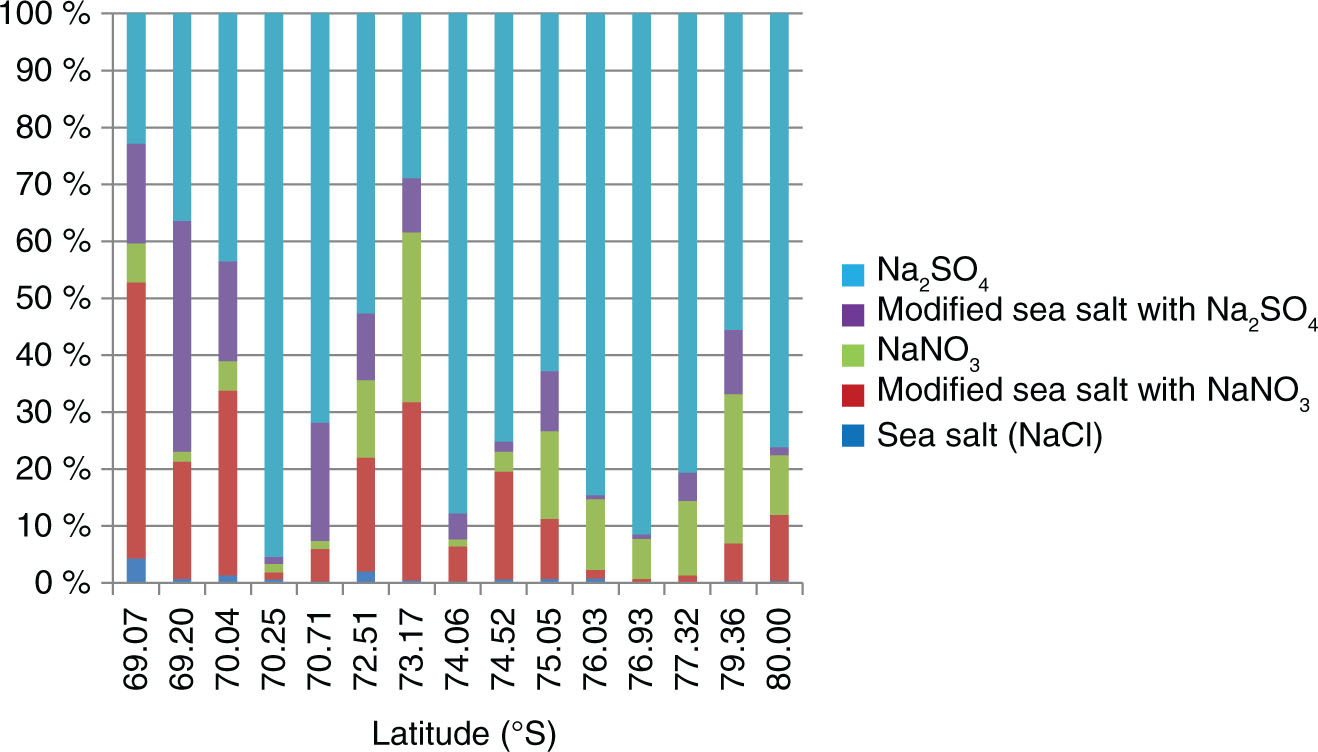
Fig. 4
Number fraction of Na compounds. From the same data as plotted in Fig. 3. Dark blue denotes sea salt. Light blue denotes wholly Cl-depleted sea-salt particles with sulphates and purple denotes partly Cl-depleted sea-salt particles with sulphates. Light green denotes wholly Cl-depleted sea-salt particles with nitrates and brown denotes partly Cl-depleted sea-salt particles with nitrates. The colour order in the data is the same as that in the legend.
Below 3000 m a.s.l. (<73°S), about half of the Na-containing particles partly change, gaining either Na2SO4 or NaNO3 (light blue and purple in Fig. 4). But further inland, above 3300 m a.s.l. (more than 74°S), the fraction with two Na compounds decreases to about one-tenth. Here, almost all Na-containing particles modify fully to either Na2SO4 or NaNO3 (dark blue and purple in Fig. 4) at the expense of NaCl. These results suggest that sea-salt modification occurs progressively on the Antarctic ice sheet as the salt moves inland, with the reactions becoming complete by 3300 m a.s.l. (74°S). As described above, sea-salt particles mainly reacted with sulphuric acid above 3300 m a.s.l. (more than 74°S). Therefore, Na2SO4 is a major soluble salt in snow of the inland region of Antarctica.
Concerning spatial correlations between ion species (Table 2), some are correlated along the entire traverse, and some are not. A plot of Na+ and Cl− (not shown) has a strong correlation r2, with r2 exceeding 0.90 (n=14) along the entire traverse. But for Na+ and , no correlation exists in the coastal region (from 69°S to 74°S), whereas a relatively low correlation of 0.69 (n=7) occurs in the inland area (from 74°S to 80°S). Thus, inland, the correlation between Na+ and is less than that between Na+ and Cl−. These trends agree with previous findings (e.g. Suzuki et al., 2002).
Na+ and Cl− are considered as having the same origin (sea salt; r2=1), and following eqs. (1) and (2), sea-salt modification increases linearly with the distance from coast to inland. Due to the linear modification through the traverse, the strong correlation between Na+ and Cl− remains even after the sea-salt modification on inland Antarctic snow. On the other hand, in the inland area, Na+ and are considered as having different origins. Moreover, the ion balance shows >Na+, indicating that H2SO4 exists. Nevertheless, despite these factors, most Na+ instead exists as Na2SO4. This finding suggests that using only the ion correlation does not predict the main chemical form in all cases.
3.3. Quantification of sea-salt sulphatisation from coastal to inland regions in Antarctic snow
Due to its importance in the inland region, we now focus on sea-salt sulphatisation by examining the NaCl/Na2SO4 ratios. With the sublimation–EDS method, we first estimate the mass of Na, Cl and S and then plot the resulting number and mole ratios of NaCl/Na2SO4. Figure 5 shows that, for each set of compounds, the mole ratio nearly equals the number ratio. The main factors that influence the calculated number and mole ratios are the atomic ratio and diameter of each particle. As the particle diameters vary, the equality of the two NaCl/Na2SO4 ratios may be due to the averaging over all the particles on a given filter sample. But regardless of the cause, the result shows that one can use the number ratio to estimate the mole (or mass) ratio of these compounds.
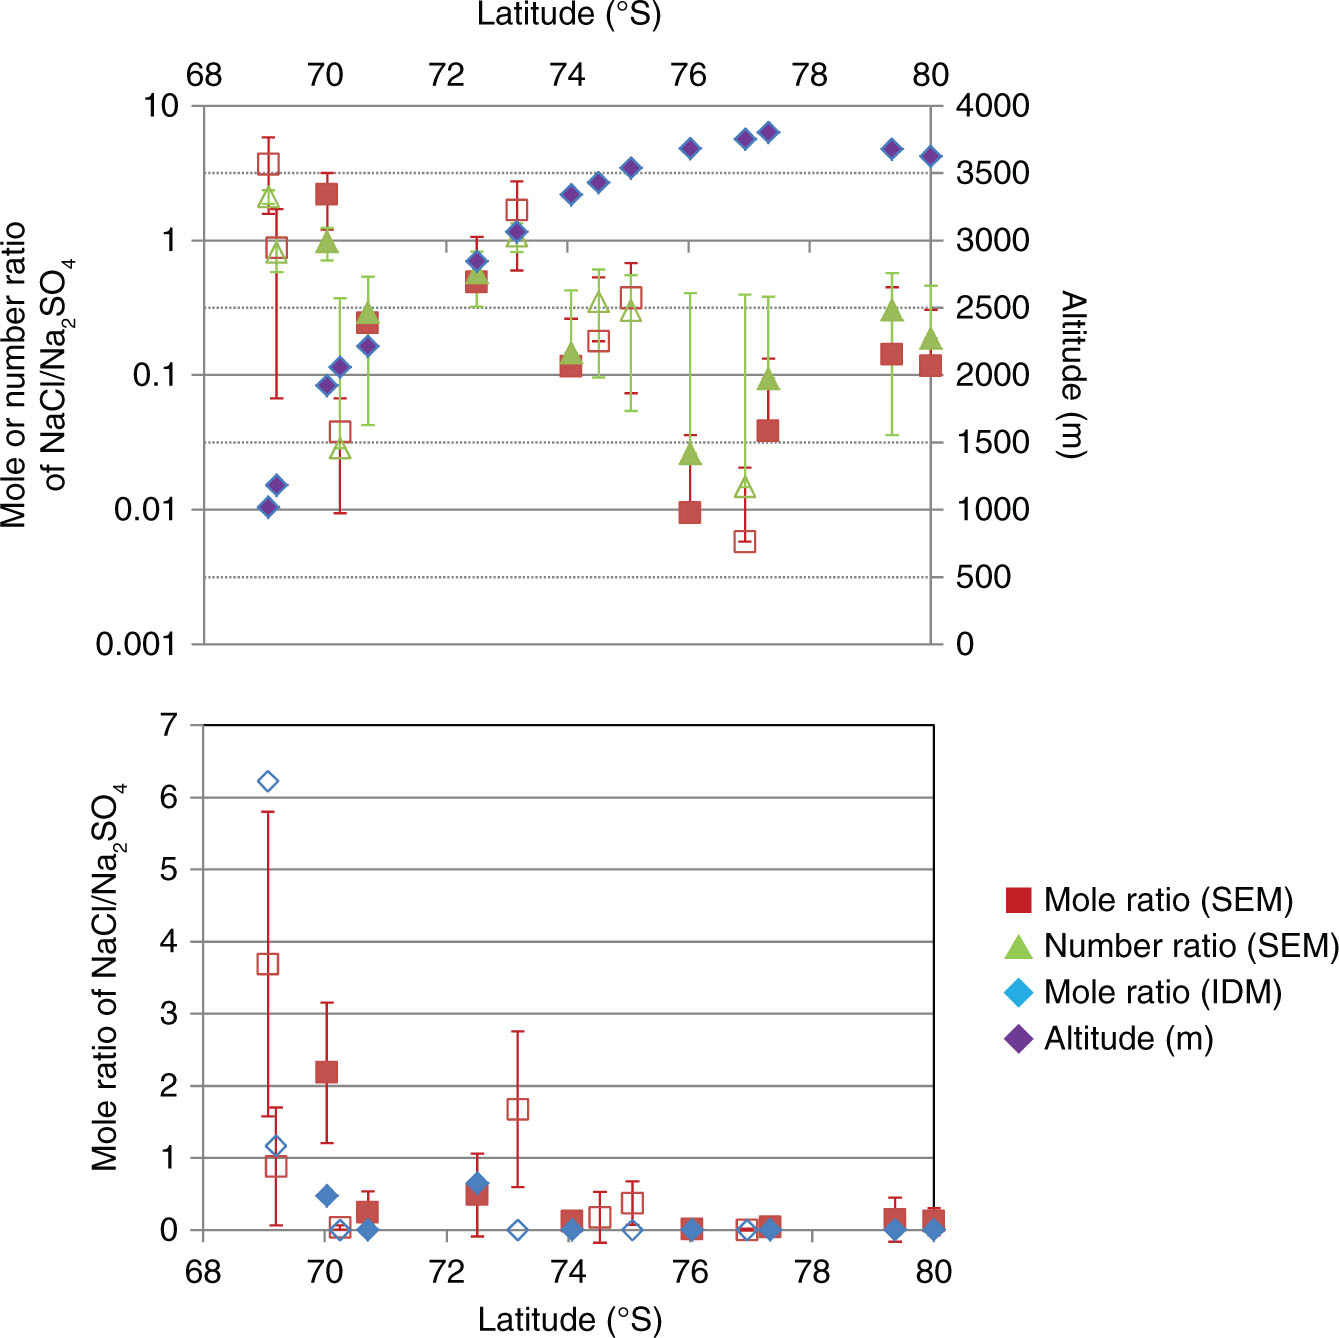
Fig. 5
Mole and number ratios of NaCl/Na2SO4 along the traverse by the ion-deducing method (IDM) and the sublimation–EDS method. Top plot is logarithmic and also shows the altitude (purple diamonds) along the traverse. The bottom plot is the same, except a normal, linear scale. Non-filled white boxes with coloured frame are for summer snow, whereas the filled coloured boxes mean multiyear snow.
This NaCl/Na2SO4 ratio is high in the coastal region and low in the inland region. If the sea salt is unmodified, the NaCl/Na2SO4 ratios of sea salt should be 39.1 and 14.7 for open sea and sea ice origins, respectively (Iizuka et al., 2012b). However, below 2000 m a.s.l. (from 69°S to 70°S), the mole ratio is much lower, ranging from 1 to 10, indicating that [NaCl] exceeds [Na2SO4]. Then, from about 2500 m a.s.l. (71°S), almost all mole ratios are below 1, indicating that [Na2SO4] exceeds [NaCl]. So, around 2000 to 2500 m a.s.l. (70°S to 71°S), the major components of soluble salt change from NaCl to Na2SO4. Above 3300 m a.s.l. (more than 74°S), most of the mole ratios are below 0.1, indicating that [Na2SO4] is more than 10 times higher than [NaCl]. In particular, above 3700 m a.s.l. near Dome Fuji (from 76°S to 77°S), the mole ratio is below 0.01, indicating that [Na2SO4] is more than 100 times higher than [NaCl]. These results show that sea-salt sulphatisation proceeds inland from the coast, changing 1000-fold between reactant NaCl and product Na2SO4. The lowest ratio, being near the peak of the ice sheet, suggests that the sulphatisation depends on the altitude of the ice sheet. The peak in altitude may be a region of downflow from the stratosphere to the troposphere, a downflow that brings sulphur compounds from the stratosphere (e.g. Delmas and Boutron, 1980; Legrand and Delmas, 1986). Past research shows that winter snow in this region contains more Na+ and Cl−, but less than the summer snow (e.g. Iizuka et al., 2004; Hoshina et al., 2014). We did not detect such a winter–summer difference, as the multiyear samples were consistent with the summer samples. This consistency may arise from a post-depositional effect of sea-salt sulphatisation in winter snow. But to test this idea, winter precipitation and surface snow along the same or similar route would need to be analysed.
We previously proposed the IDM to determine the concentration of salt compounds for the Dome Fuji ice core (Iizuka et al., 2008). How well does it work along the present traverse? Table 2 shows [NaCl] and [Na2SO4], and Fig. 5 shows the mole ratio of NaCl/Na2SO4 by the IDM. The IDM assumes that Na+ more readily combines with than with Cl−. As a result, NaCl should be negligible where the equivalent []>[Na+] is inland from 70°S. However, the particle analysis with the sublimation–EDS method detects some NaCl in this inland region. We have found that the sea-salt sulphatisation proceeds in the area below 3000 m a.s.l. (from 70°S to 73°S), yet some NaCl remains, suggesting that the IDM assumption does not apply well to this area. Another area with this same issue is the Talos Dome site. Holocene ice at Talos Dome has a certain amount of NaCl yet is mismatched with the IDM (Iizuka et al., 2013). Thus, like the Talos Dome site, the IDM method might not accurately determine sea-salt sulphatisation in the coastal region.
On the other hand, the inland area above 3300 m a.s.l. (more than 74°S), the sublimation–EDS method gives [NaCl]/[Na2SO4] values below 0.1, indicating less discrepancy between sublimation–EDS and IDM. This means that IDM can be applied inland and suggests that almost all Na+ does not form NaCl. Similarly, Holocene ice in the Dome Fuji ice core has negligible NaCl, yet closely matches the IDM (Iizuka et al., 2012a, 2012b; Oyabu et al., 2014). Like the Dome Fuji site, the IDM method seems to accurately determine sea-salt sulphatisation in the inland region.
Why is ~3300 m a.s.l. (74°S) the threshold latitude at which sea-salt sulphatisation becomes complete? Stohl and Sodemann (2010) suggested a greater likelihood, compared to a subpolar region, of air from the stratosphere reaching the lowest 500 m above the surface in the Antarctic Plateau during summer and autumn. We find that has a minimum near 3300 m a.s.l. (74°S; see Table 2). The minimum likely occurs here because this area lies away from both the coastal source of H2SO4 and the stratospheric source in the Antarctic Plateau (above 3700 m a.s.l.) (Suzuki et al., 2003). The sea-salt sulphatisation should proceed in the area from 1000 to 3300 m a.s.l. (69°S to 74°S), due to the high levels of tropospheric , then becoming complete from 3300 to 3800 m a.s.l. (74°S to 80°S), where additional enters from the stratosphere. In fact, the [NaCl]/[Na2SO4] values are lowest at the Antarctic Plateau (Fig. 5), where the contribution of stratospheric materials is highest (e.g. tritium concentration as shown in Kamiyama et al., 1989). This additional may accelerate the sea-salt sulphatisation. The 3300 m a.s.l. corresponds to a transition of snow surfaces between smooth (inland plateau type) and rough (katabatic wind zones) (Ageta et al., 1989). The surface snow type may reflect an effective territory of chemicals from the stratosphere. Further study is needed to test this hypothesis; for example, using winter measurements of the area and other areas.
4. Summary
We have analysed the ion concentrations and chemical composition of soluble salts in surface snow on the Antarctic ice sheet within 39°E to 45°E and 69°S to 80°S during summer traverse expedition 2012/2013. Our findings are as follows:
The Cl/Na ratio (1.19) in the coastal locations was consistent with the sea-salt ratio. Nevertheless, even in the coast sample, the sea salt reacted with acids. This means that even if the Cl−/Na+ ratio in bulk snow equals the sea-salt ratio, the sea-salt particles in snow may react with acid (HNO3 or H2SO4).
The IDM does not apply to the coastal area from 1000 to 3300 m a.s.l. (from 69°S to 74°S) because sea-salt sulphatisation proceeds, and yet a significant amount of NaCl remains. On the other hand, the IDM can be applied in the inland region from 3300 to 3800 m a.s.l. (from 74°S to 80°S) where nearly all Na+ forms Na2SO4 and NaNO3 compounds.
We propose a hypothesis for why 3300 m (74°S) is the threshold at which sea-salt sulphatisation becomes complete. The sulphatisation proceeds from 1000 to 3300 m a.s.l. (from 69°S to 74°S) due to the nearby source of tropospheric and becomes nearly complete from 3300 to 3800 m a.s.l. (from 74°S to 80°S) where there exists a relatively high level of stratospheric . To test this hypothesis, further studies are needed.
5. Acknowledgements
We thank the logistic and sampling inland traverse team of JARE54, 54th Japanese Antarctic Research Expedition. The paper was significantly improved as a result of comments by two anonymous referees and handling by Scientific Editor Dr. K. Hämeri, to whom we are greatly indebted. This study is a part of the Science Program of JARE. This study was supported by grant numbers 16K12573, 26257201 and 26610147 provided by the Ministry of Education, Culture, Sports, Science and Technology (MEXT) and Japan's Society for the Promotion of Science (JSPS), and also by a Grant for Joint Research Program of the Institute of Low Temperature Science, Hokkaido University. It was supported by National Institute of Polar Research under MEXT.