
Table 1. Instrumentation package of the ultralight aircraft D-MIFU
[i] The CN counter (CPC) used in the 2012 flights (TSI 3010, 10 nm threshold) was replaced in 2013 against a GRIMM CPC4 counter (4.5 nm threshold). The aethalometer, a prototype model, AE33 Avio is a loan from aerosol d.o.o. Ljubljana, Slovenia, and replaces the older AE42 portable aethalometer since June 2014.
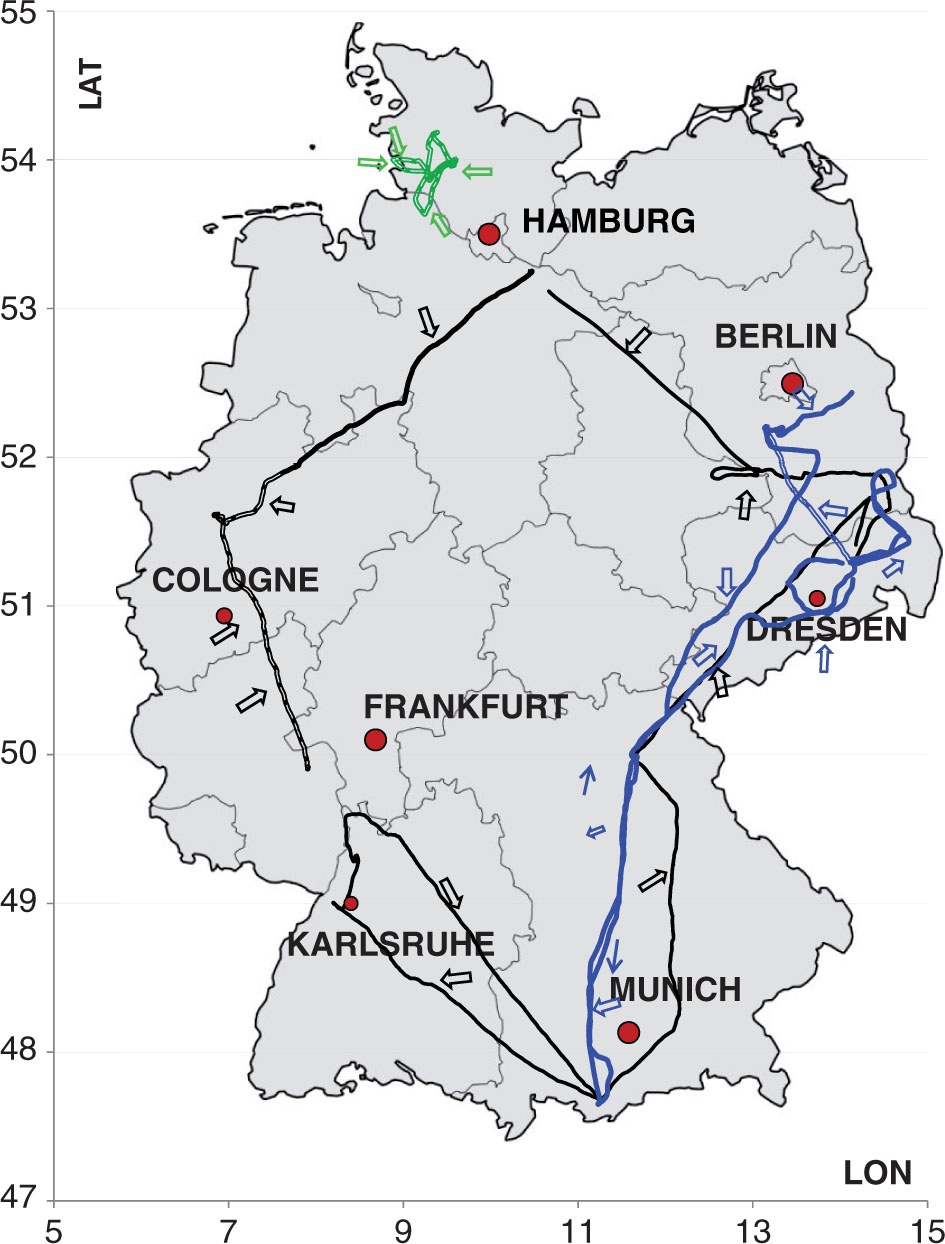
Fig. 1
Flight tracks and main wind directions (arrows) for the individual flight sections. Black lines indicate flights in April–May 2012, green lines flights along the coastline in September 2013 and blue lines flights in June 2014.
Table 2. Summary of flights, weather conditions and measured aerosol data. Ultrafine aerosols are given as maximum and background concentrations as well as geometrical mean diameter. Fine particles are shown as number of particles >300 nm cm−3. The fraction of time column indicates how long particle number concentrations >15 000 cm−3 were encountered
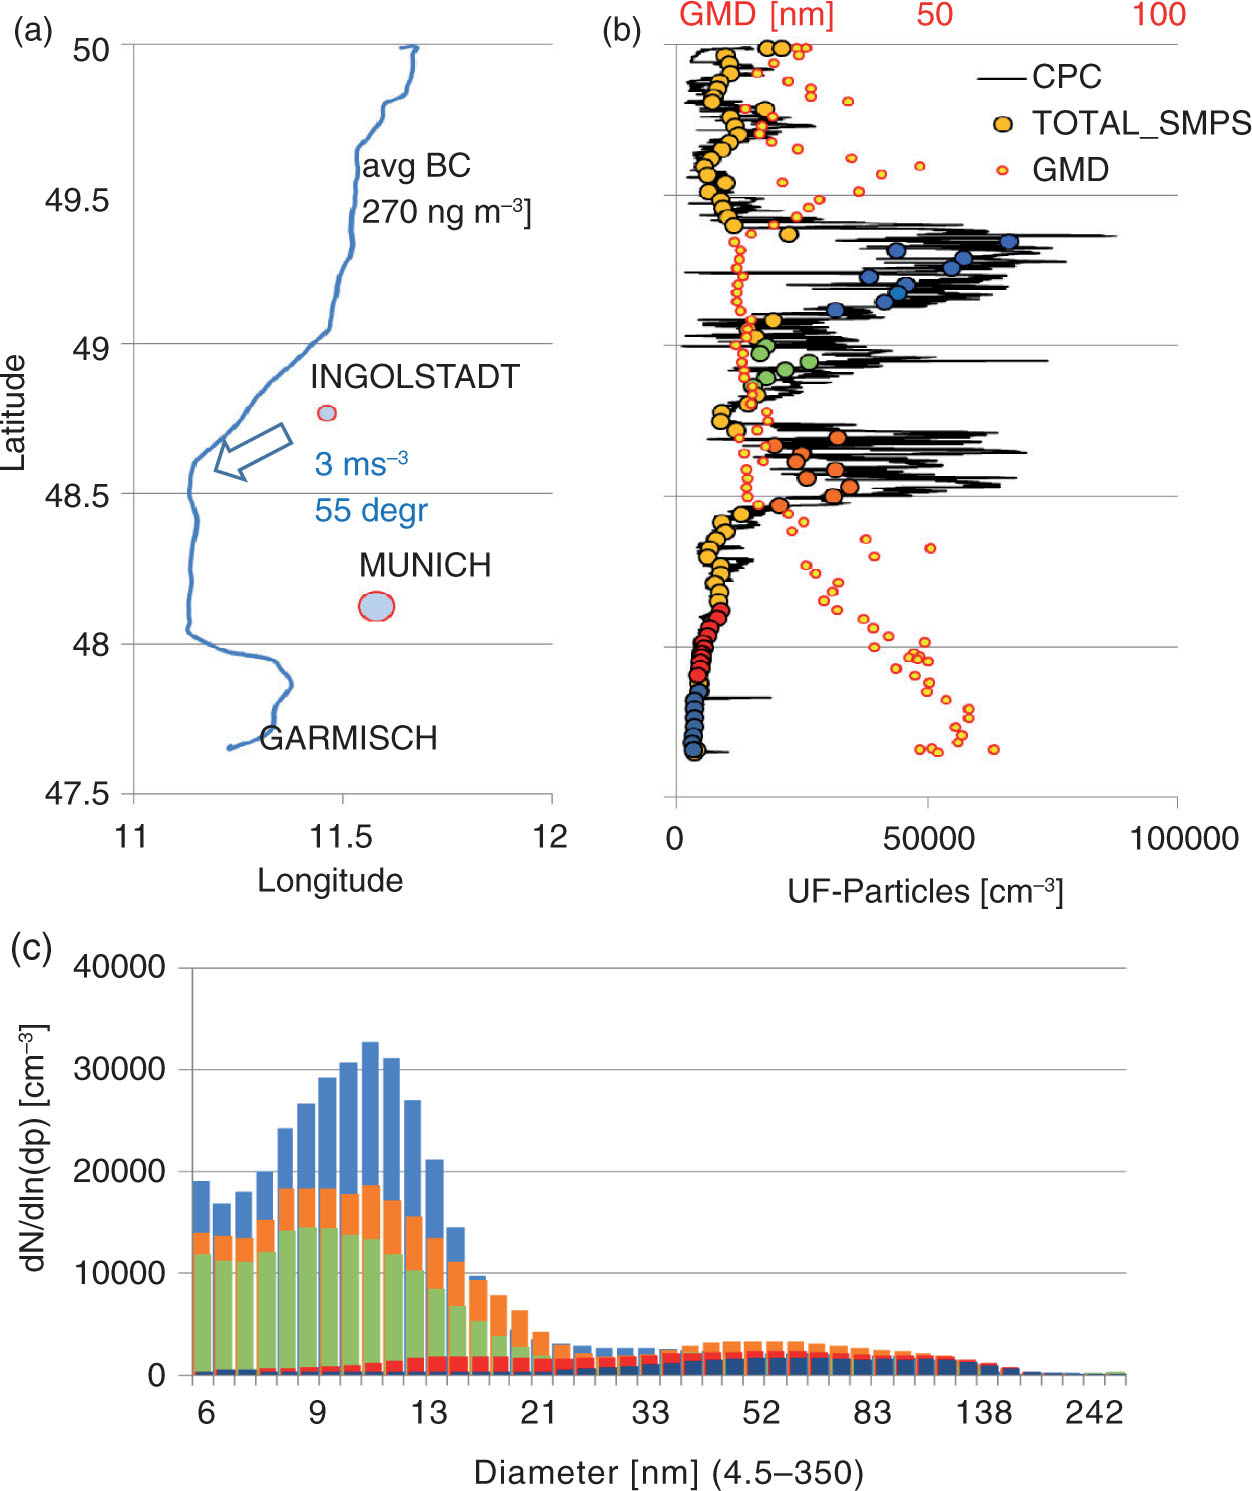
Fig. 2
Flight path, particle number concentration of the CPC (black lines and the SMPS (filled circles) and geometric mean diameter (yellow/red small circles) between Bayreuth and Ohlstadt under northeasterly winds (16.6.2014). The upper panel also shows the position of the cities of Ingolstadt (refineries, 13 0000 population) and Munich (~1.5 million population). Size distributions (lower panel) are colour coded according to upper panel SMPS data.
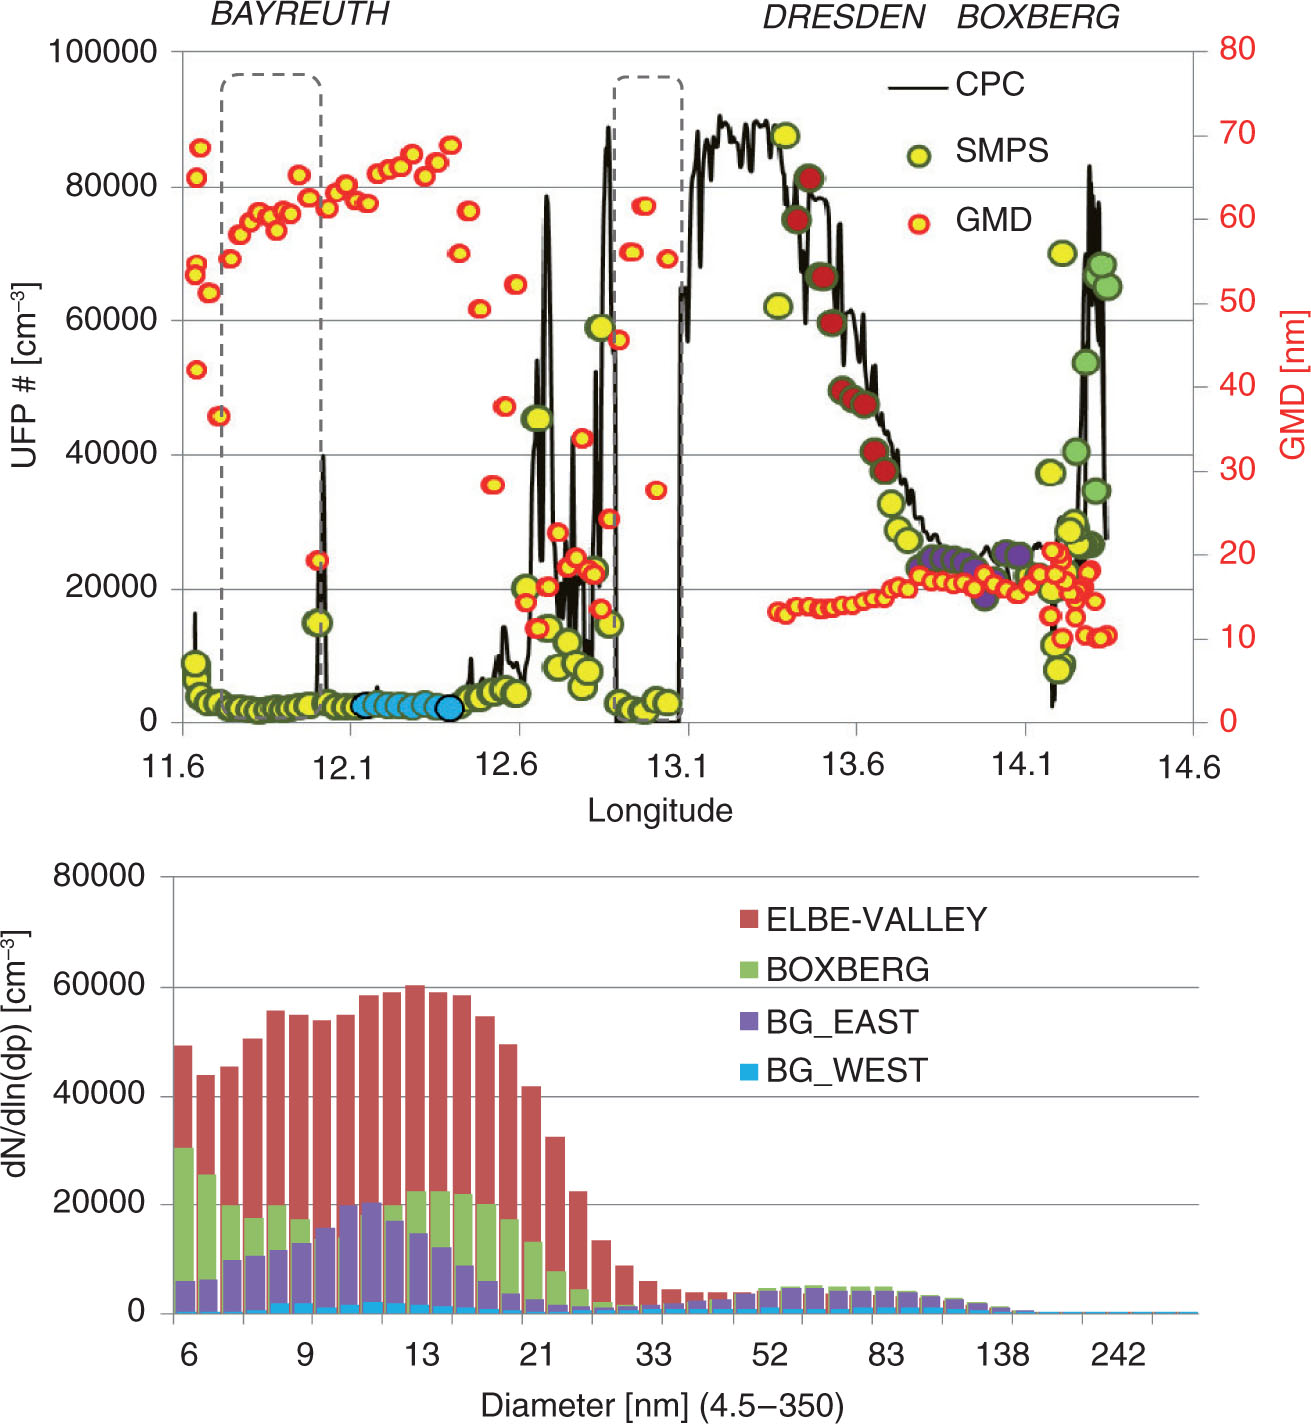
Fig. 3
Upper panel: Number concentrations measured with the particle counter (TSI 3010) and the SMPS (yellow dots) as well as the GMD derived from the SMPS measurements during a flight from Bayreuth to Kamenz, ~40 km northeast of Dresden on April 28, 2012. Dotted lines, measurements above the PBL. The lower panel shows the averaged size distributions as colour coded in the upper panel. Enhanced background east (BG_EAST) of the Elbe Valley with signatures of uncharacterised fresh emissions.
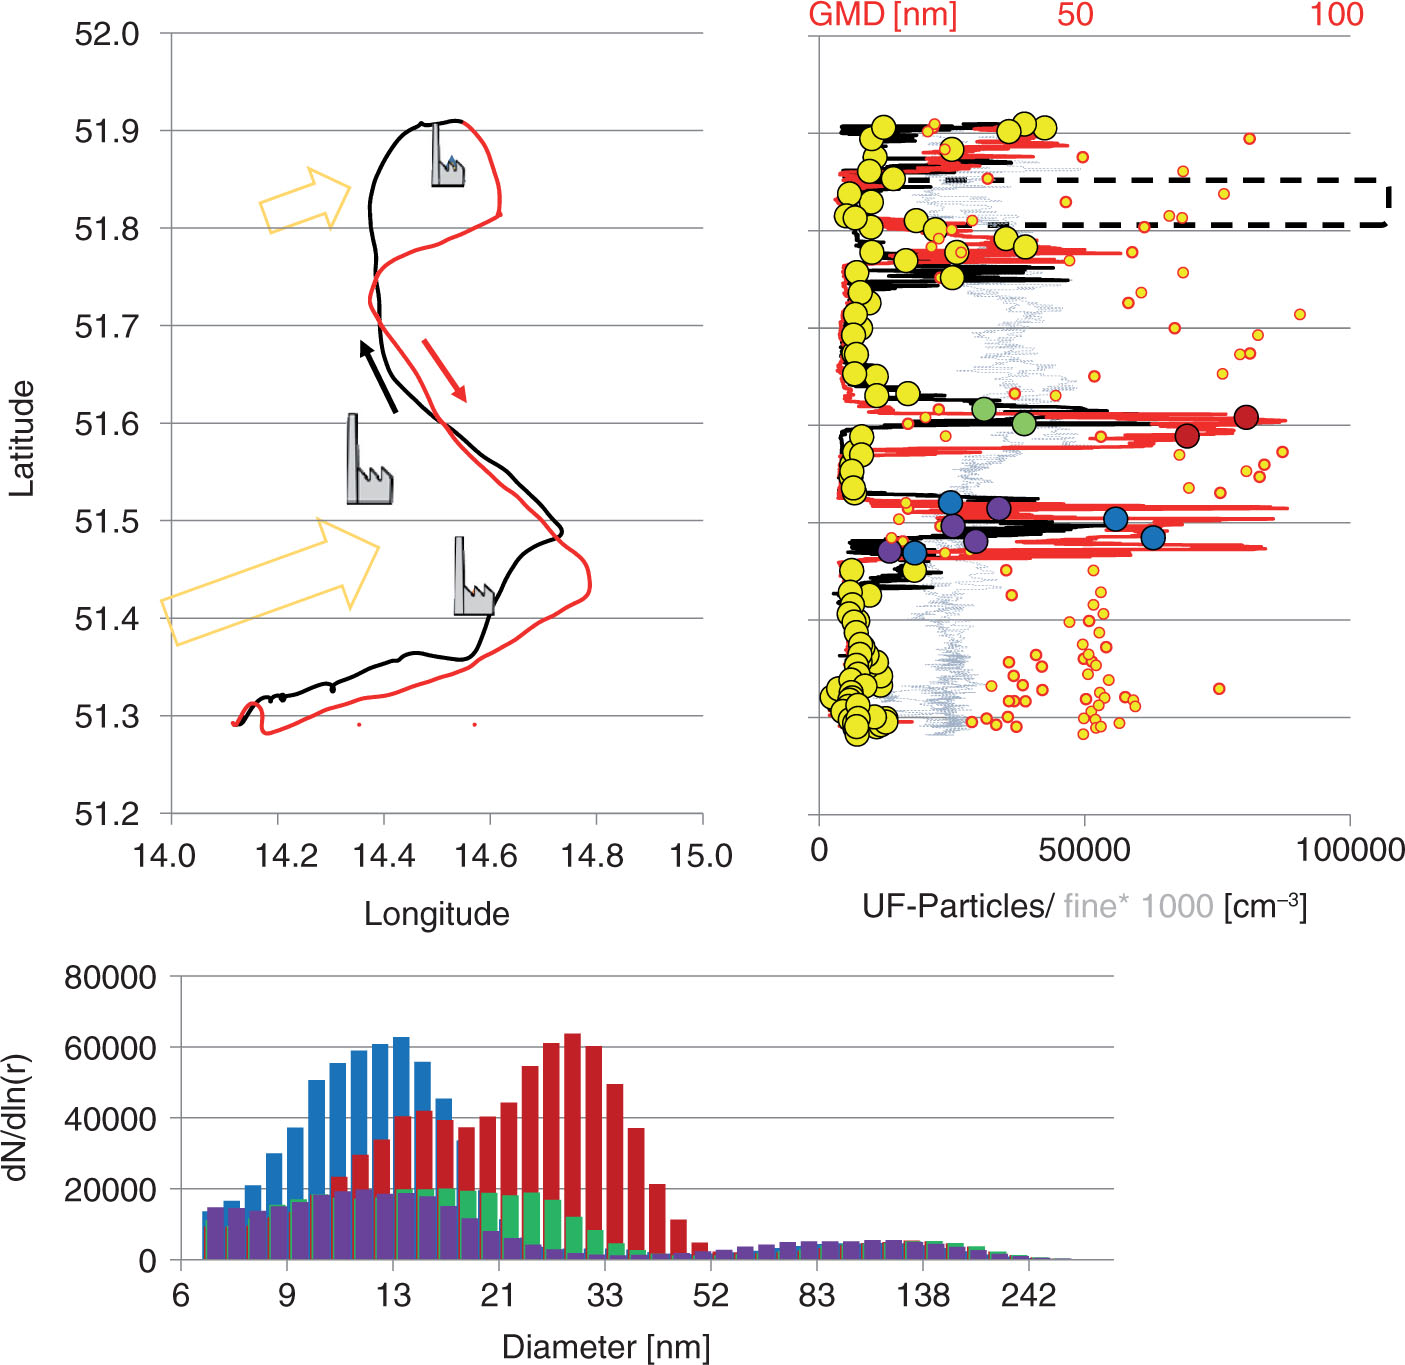
Fig. 4
Flight path, particle number concentrations and GMD (red/yellow dots) about 1 h downwind of the power stations Spremberg and Boxberg along the Polish border and circling Jänschwalde under southwesterly advection (June 8, 2014) upper panel, red lines the south–north pattern, black lines the return flight. Winds were declining from 4 m s−1 in the south to <2 m s−1 in the north. Red and black the ultrafine particles, the grey dotted line the number concentration of fine (visible) particles >300 nm×1000. The black dotted line marks an ascent above the PBL. Size distributions (lower panel) colour coded according upper panel SMPS.
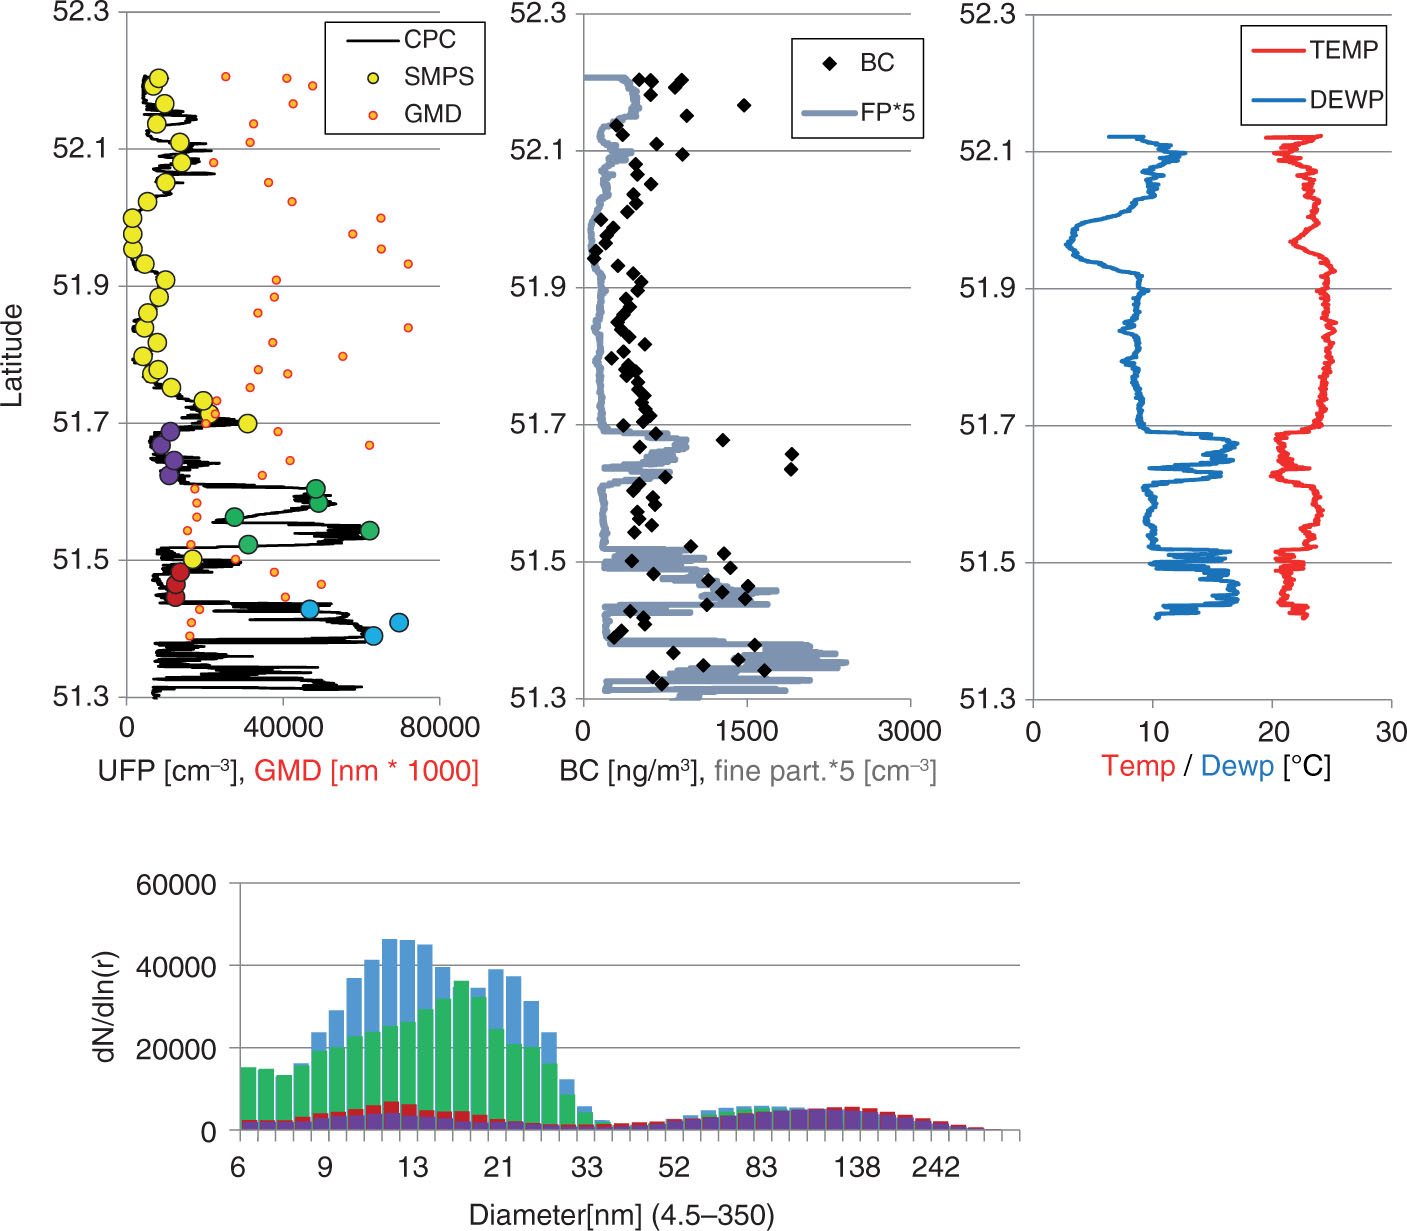
Fig. 5
Particle number concentrations of CPC/SMPS and OPC (FP) as well as black carbon (BC), temperature and dewpoint and size distributions (lower panel) measured during the flight from Kamenz to Berlin (Schönhagen, EDAZ) (June10, 2014). High total mass (fine particles>300 nm) in the PBL is correlated to high BC and high dewpoint in the humid boundary layer capped by a strong inversion. Above the PBL, clear sky and high ultrafine particle number concentrations dominate.
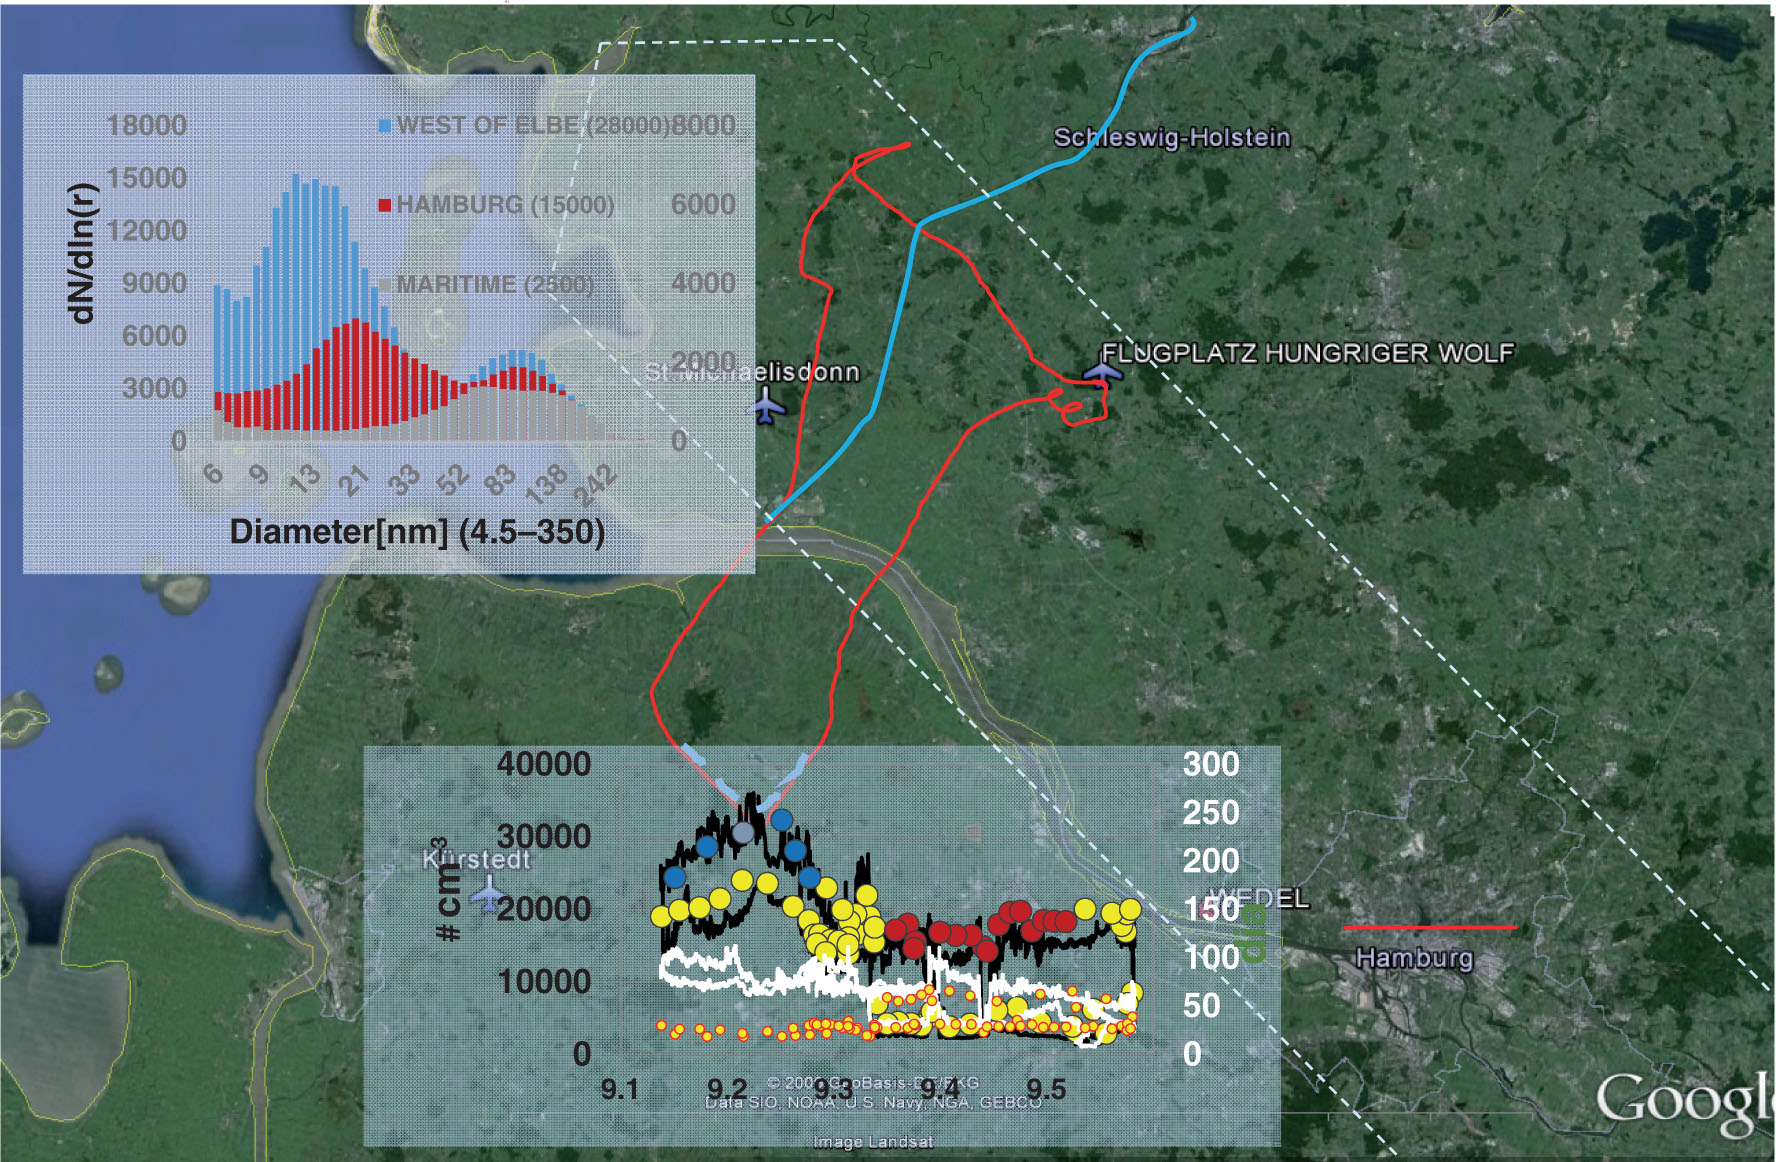
Fig. 6
Particle number concentrations and size distributions west of the River Elbe and north (downwind) of Hamburg. The blue line is the ship channel connecting Northern and Baltic Sea. Highest number concentrations were found in air masses bypassing Hamburg ~30 km to the west. Size distributions correspond to fill colour of the SMPS total counts, polluted conditions left, maritime background right scale.
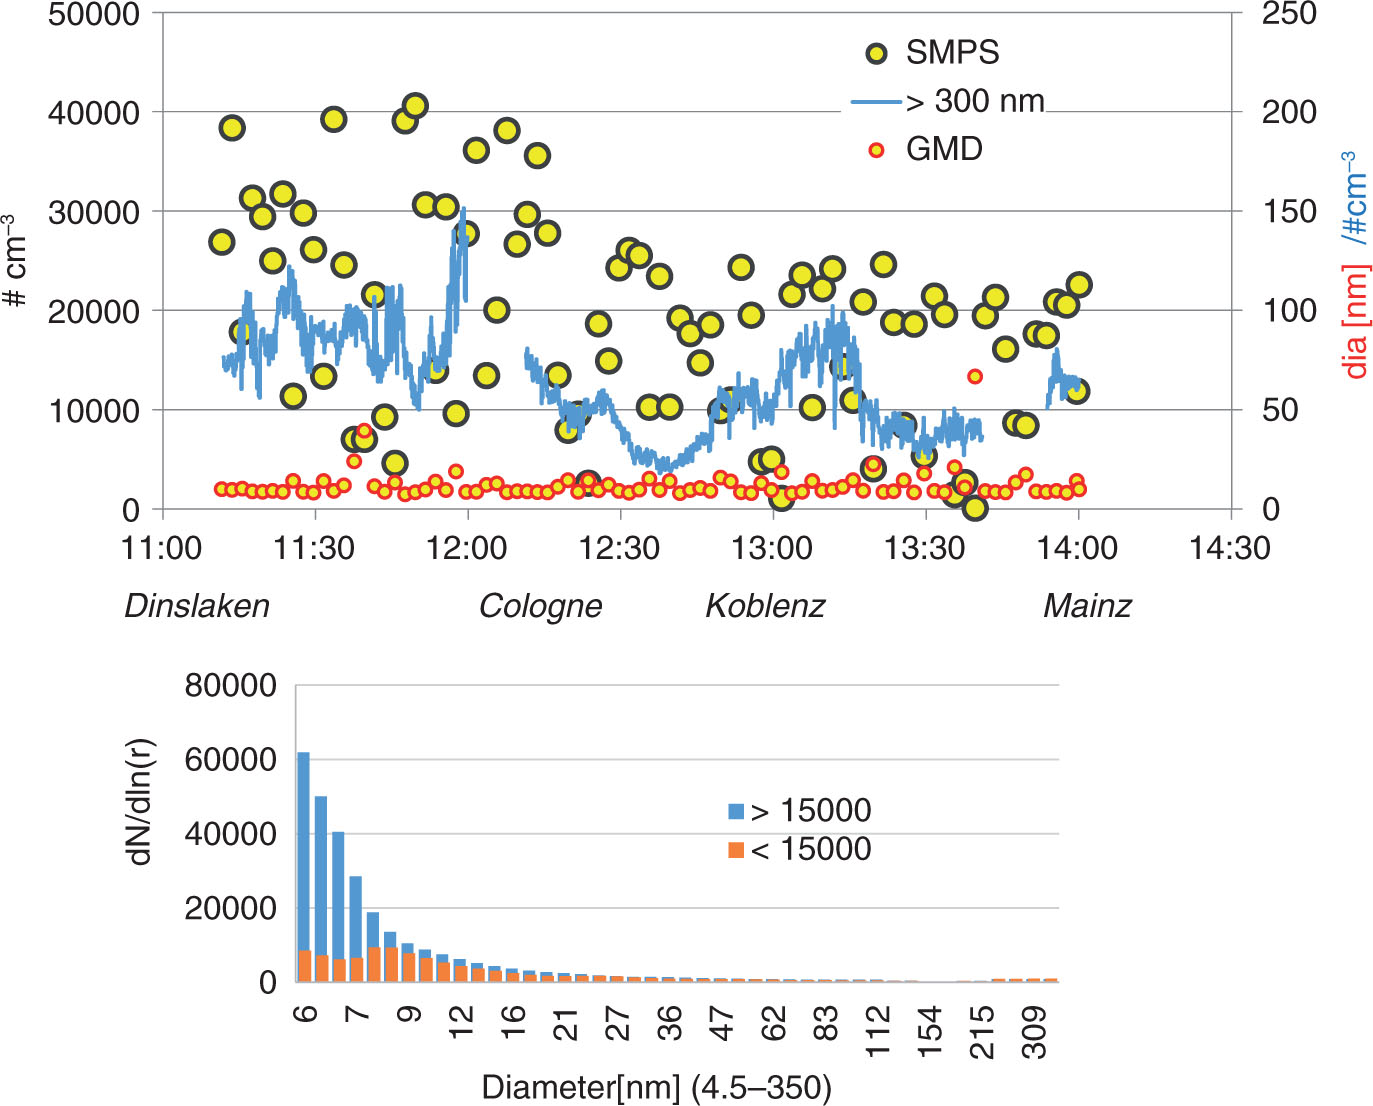
Fig. 7
Particle number concentrations, fine particles>300 nm (in blue), GMD and size distributions from the SMPS for the flight from Dinslaken to Mainz under totally overcast (8/8) conditions.
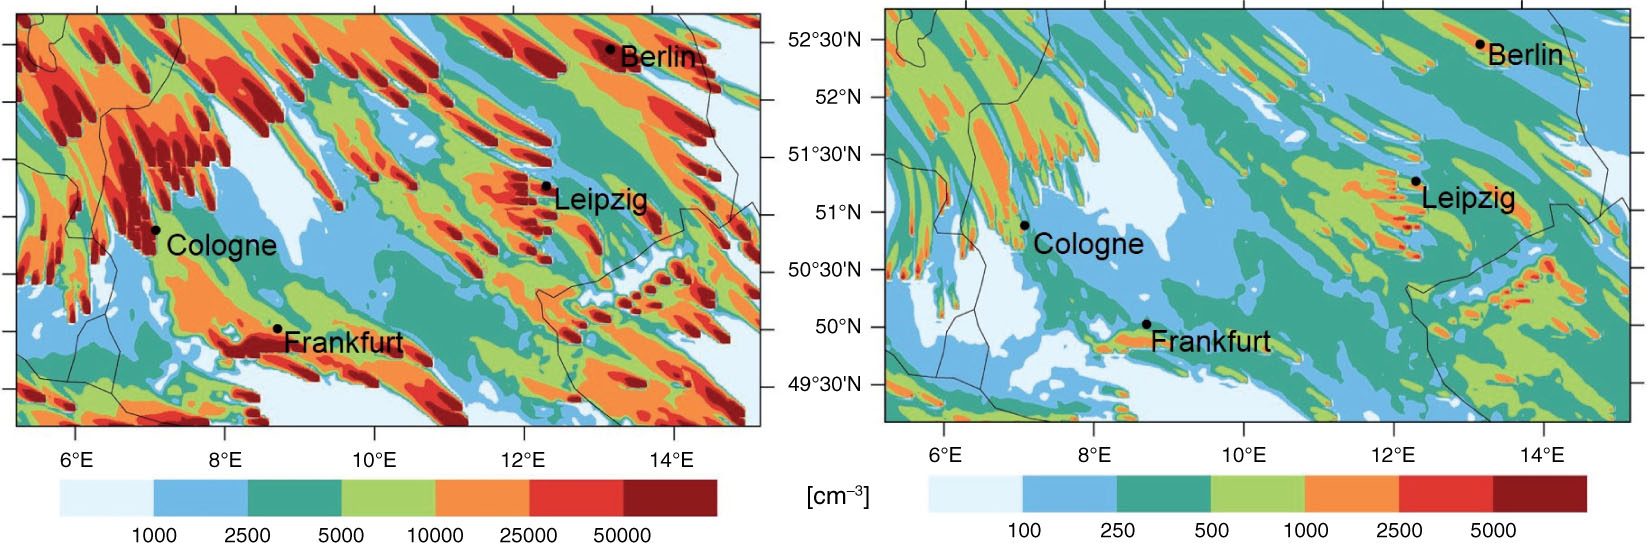
Fig. 8
Spatial distribution of Aitken mode particles from primary emissions by combustion power plants over Germany according to COSMO-ART modelled with AerCoDe (right panel) and based on measured (left panel) ultrafine particle emissions for southeasterly winds. The model was run for winter (November) overcast conditions to suppress secondary gas-to-particle conversion within the plume.