
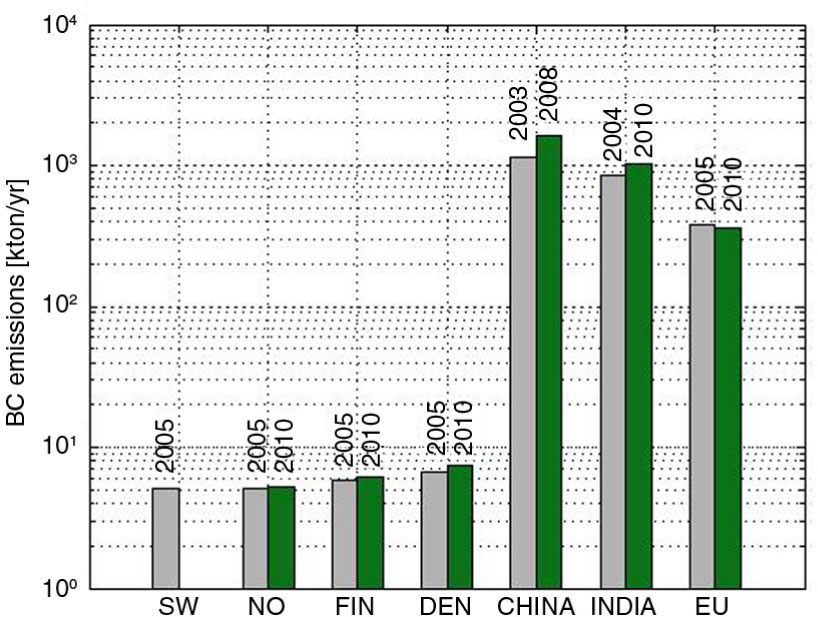
Fig. 1
Comparison of BC emissions from DFNS, EU and the world's largest emitters – China and India.
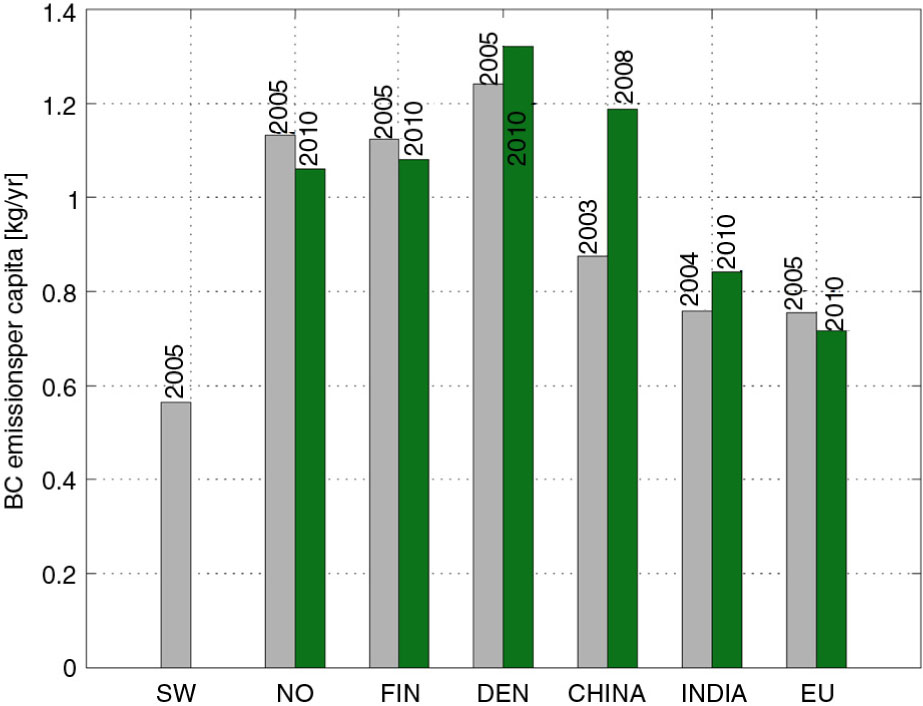
Fig. 2
Comparison of per capita BC emissions from DFNS, EU and the world's largest emitters – China and India.
Table 1. Description of the albedo schemes
[i] The CONTROL experiment uses the albedo scheme listed in the first column. CTRALB uses the snow age factor F a from the second column while the ALB experiment undergoes all the modifications entered in the second column.
[ii] a ice is the snow albedo on ice, a min =0.6 (minimum snow on ice albedo), a max =0.8 (maximum snow in ice albedo), T s is surface temperature, T m =273.15 K (snow melting temperature), T u =T m −1 ° (upper limit for a T calculations), a bcr is the albedo reductions of BC from eq. (1), a sn is the albedo over land, a snm =0.95 (maximum albedo of fresh snow in the visible range), F am =0.2 (maximal rel. reduction of snow albedo by ageing in the visible range), F a is the snow age factor, a sna =0.4 (maximal relative reduction of snow absorption by large solar zenith angle), a snaf is the snow-albedo angle factor, a snmin =0.15 [minimum albedo for (dirty) snow], z z is the zenith angle, z af =2 (factor in solar zenith angle dependence of snow albedo), r 1 is the grain growth effect, is the additional effect near and at freezing of melt water, r d is the effect of dirt and soot and sn Δt is the snow fall per time step.
Table 2. Measurement sites used in this study
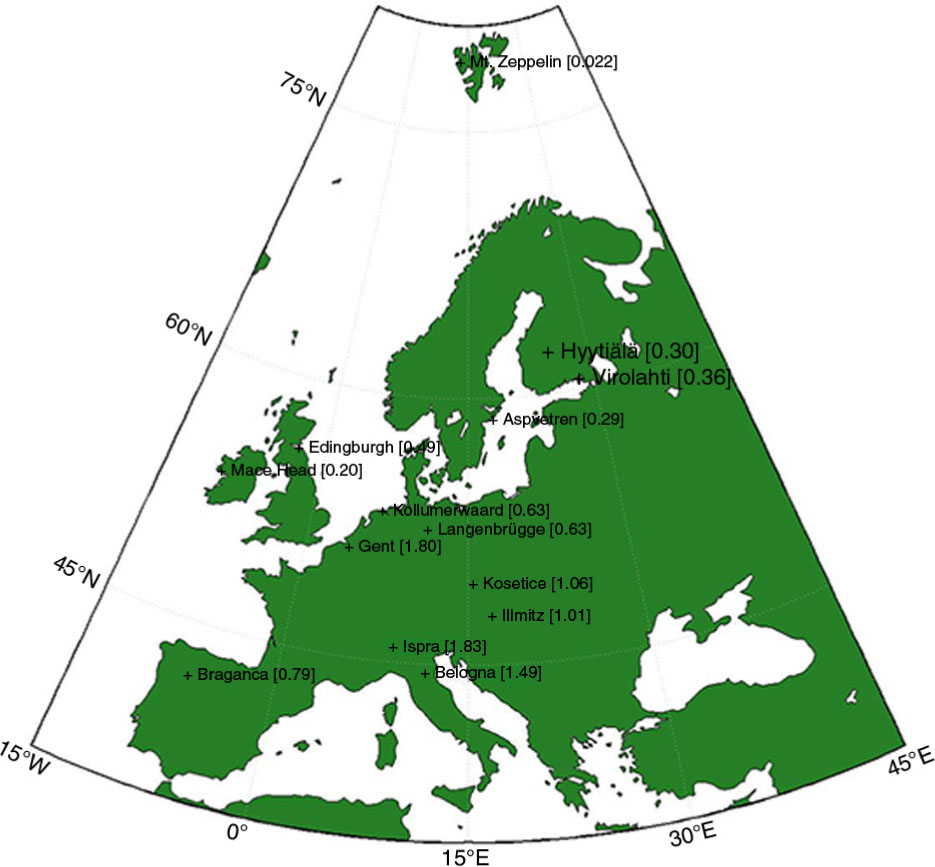
Fig. 3
The location of the measurement sites. The numbers between the brackets represents the mean surface BC concentration for the entire measurement period.
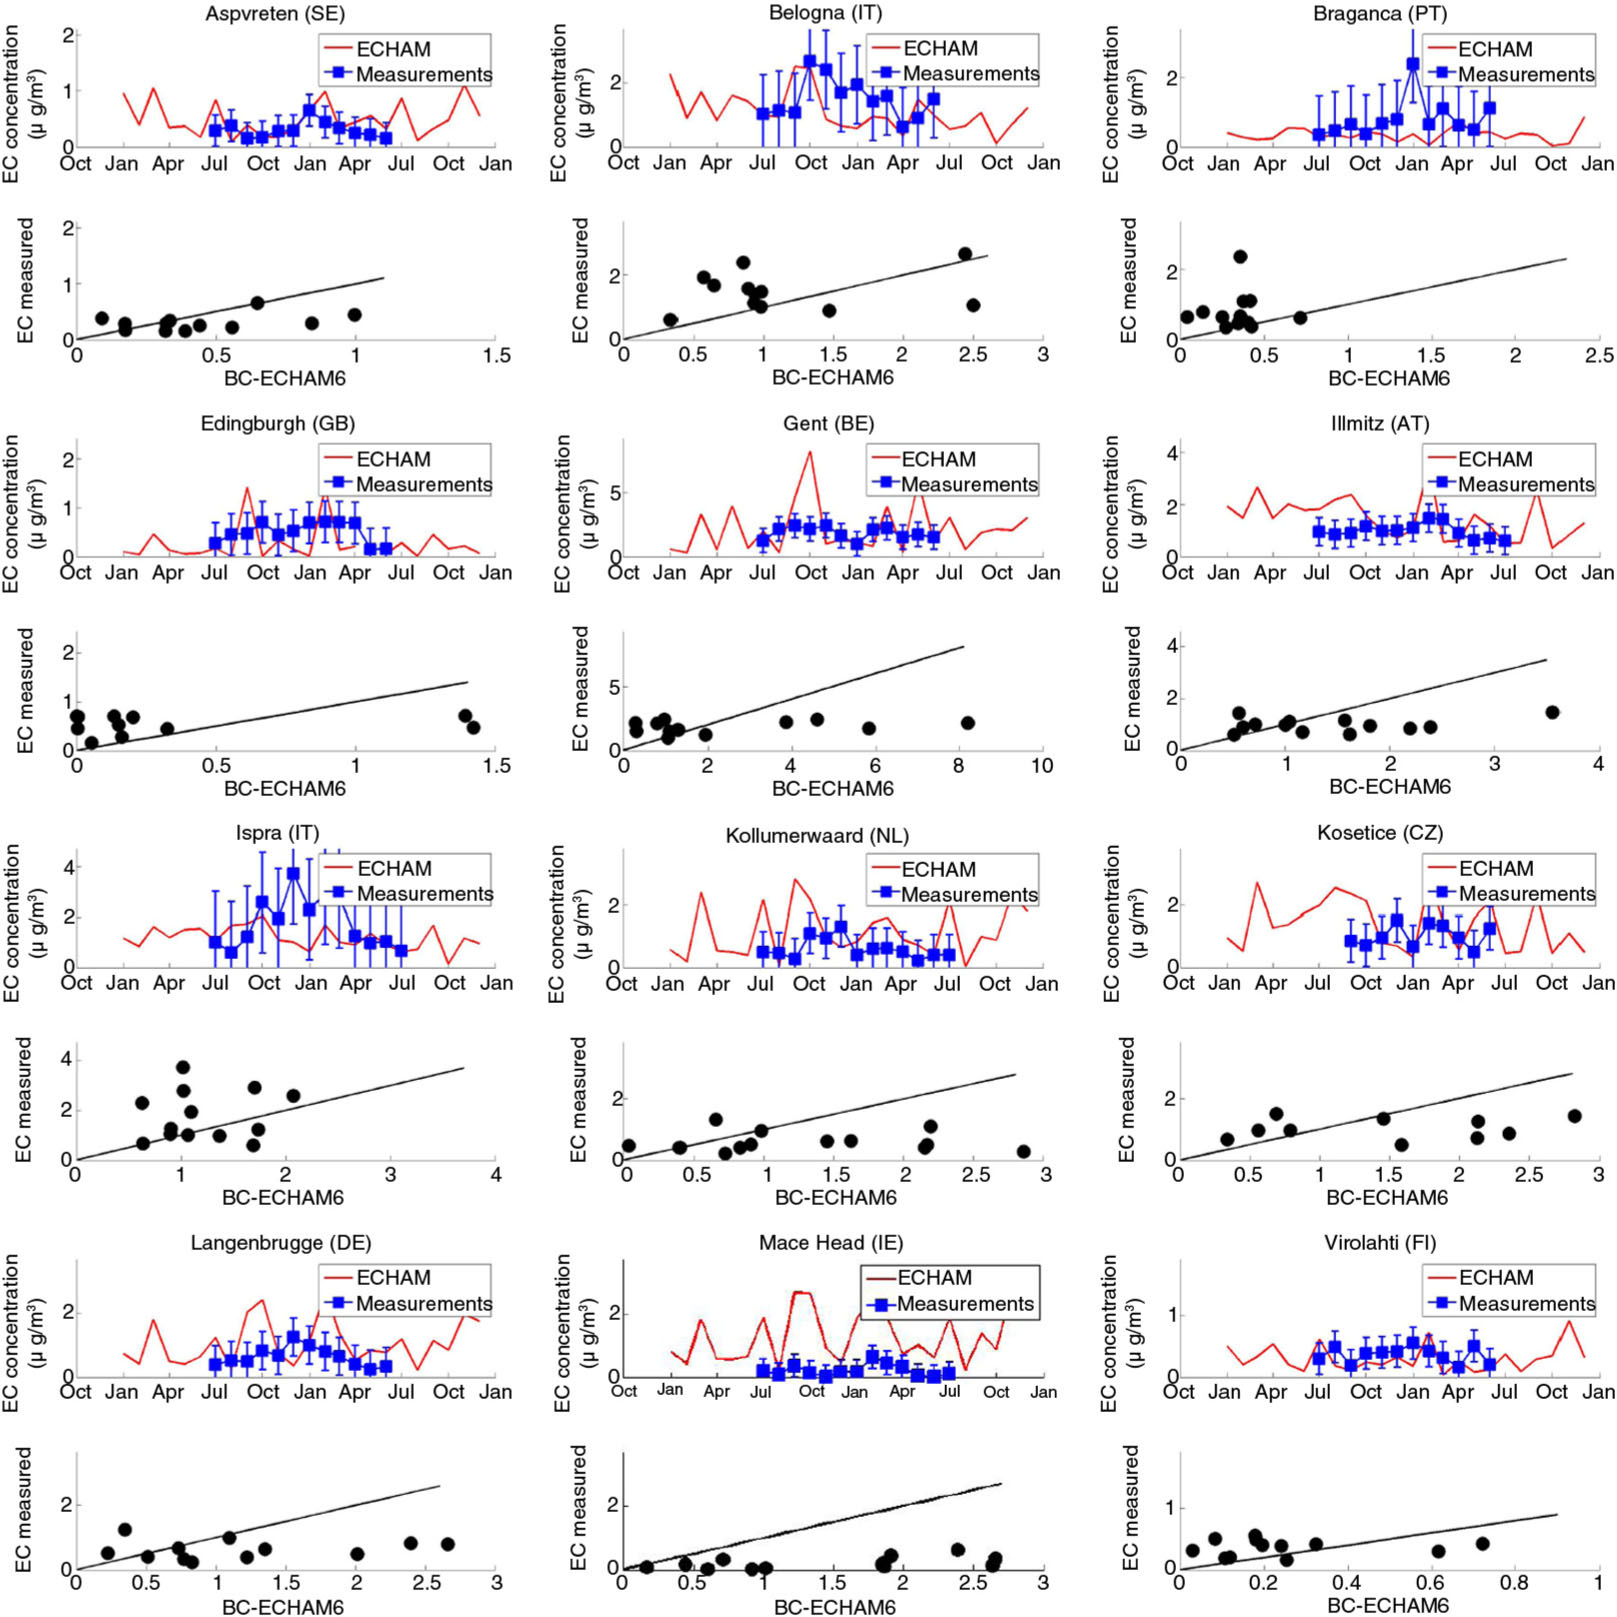
Fig. 4
Time series and scatter plots of monthly means of measured (blue square) and modelled (red line) BC surface concentrations from July 2002 to July 2003. The error bars represent the 2x standard deviation. The 1:1 line is drawn for clarity.
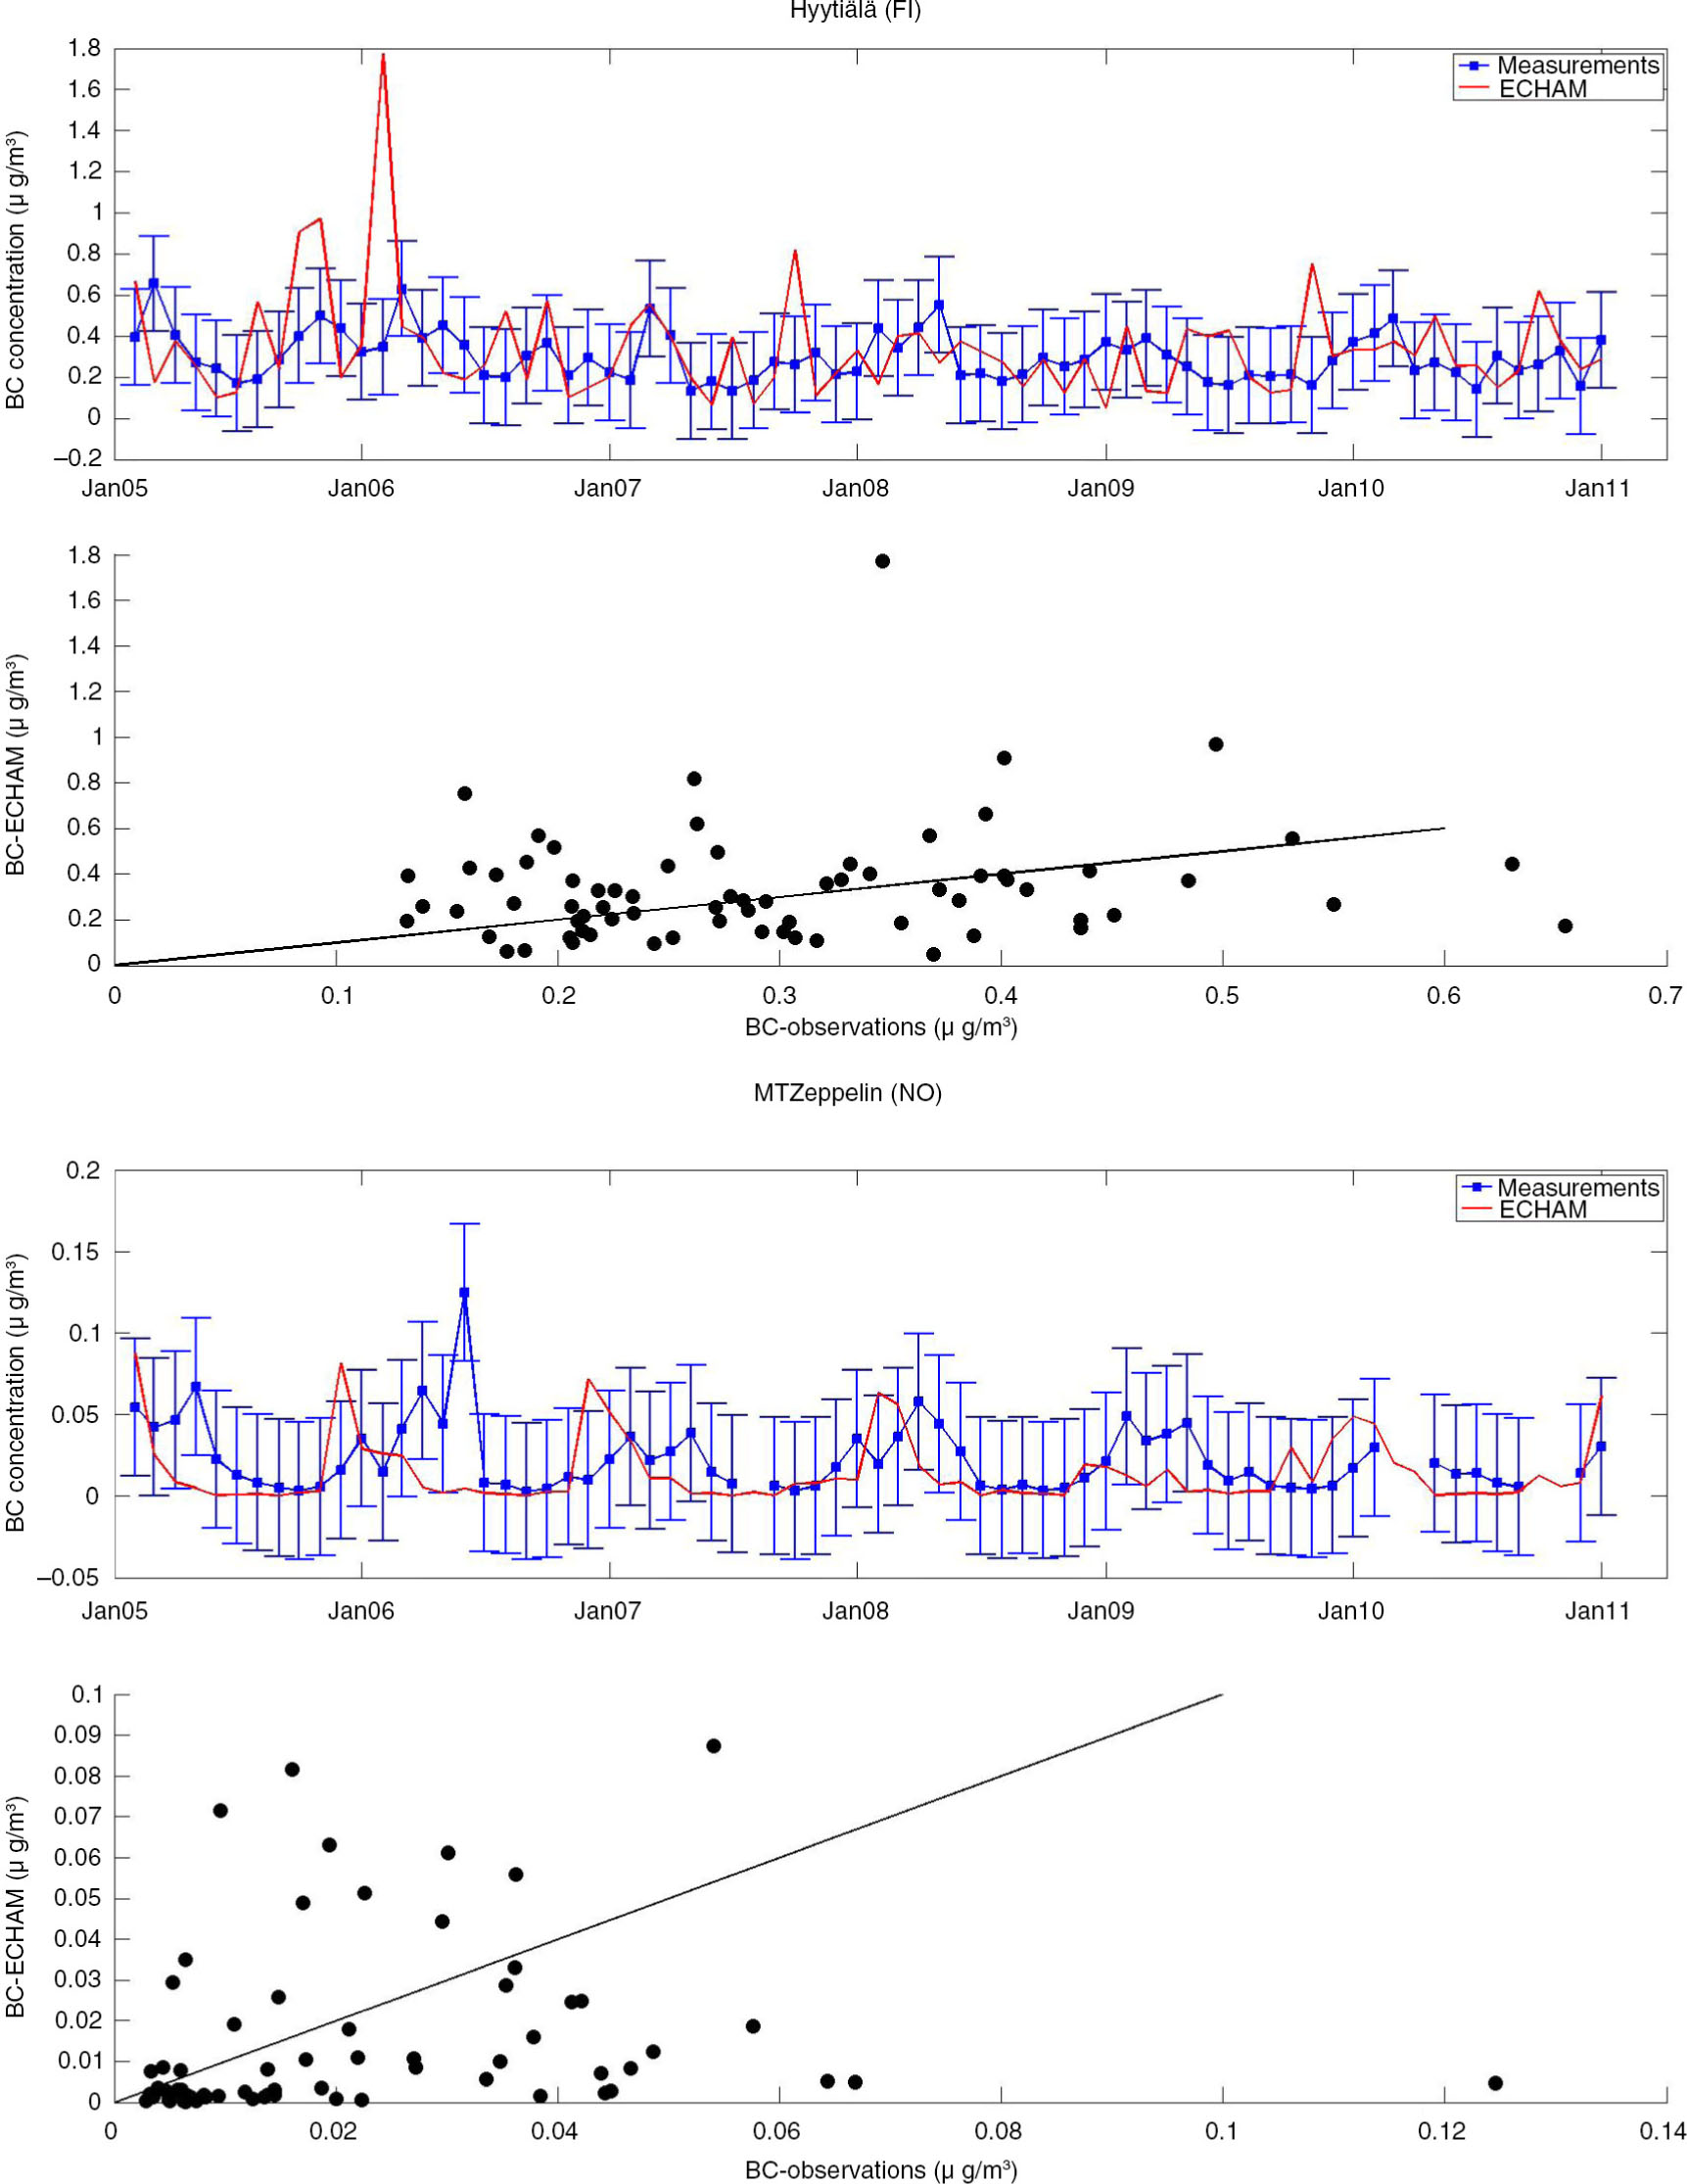
Fig. 5
Time series and scatter plots of monthly means of measured (blue square) and modelled (red line) BC surface concentrations from January 2005 to December 2010. The error bars represent the 2x standard deviation. The 1:1 line is drawn for clarity.
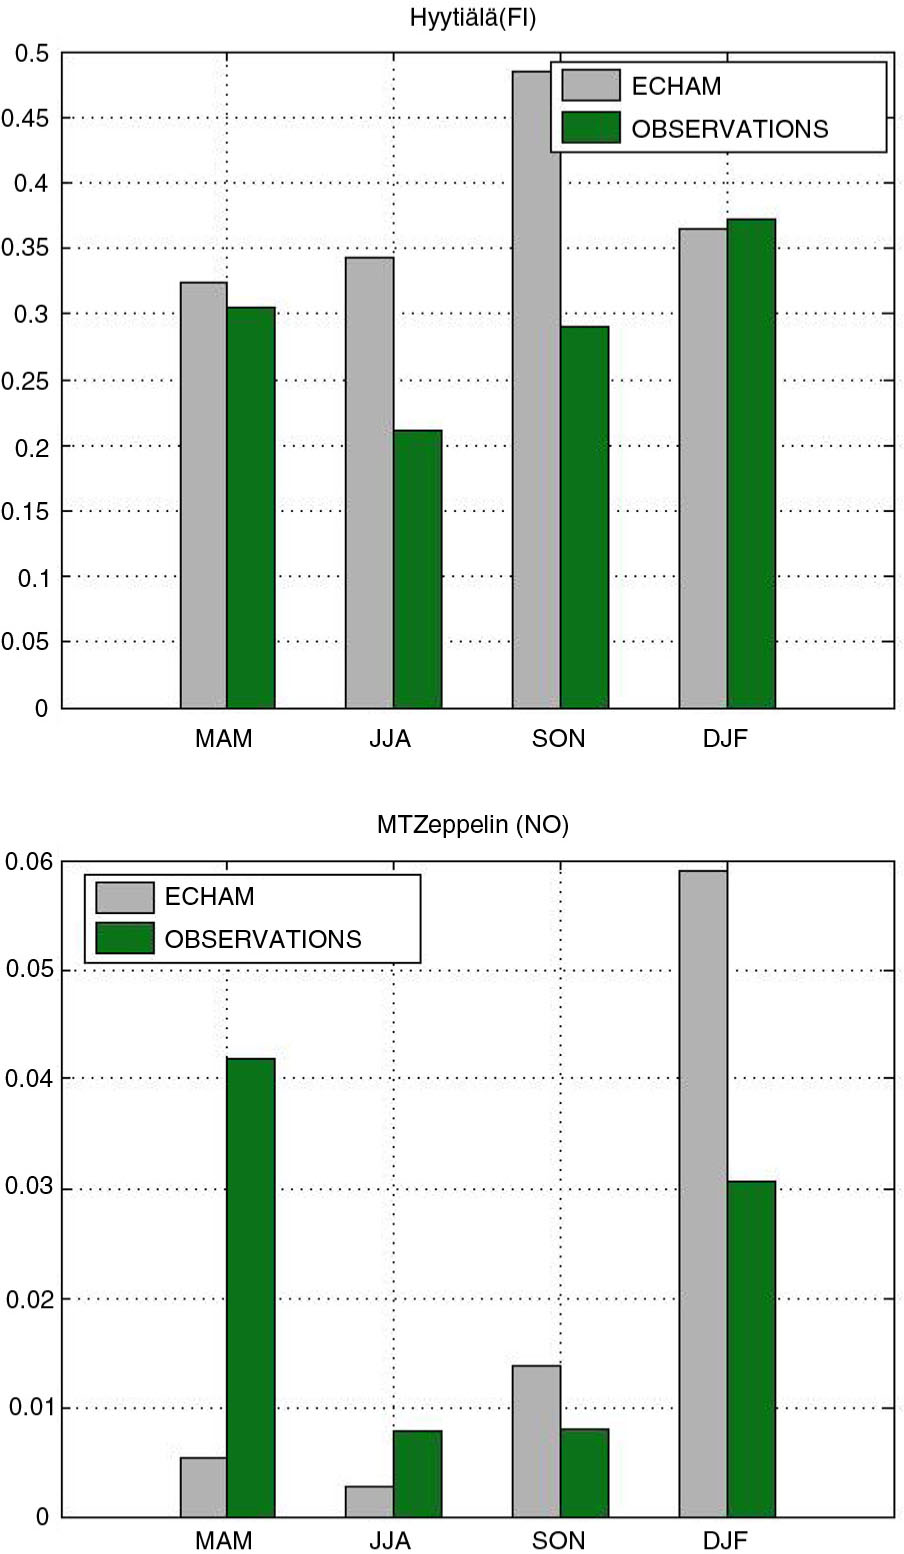
Fig. 6
Observed and modelled seasonal mean BC surface concentrations (µg/m3) in Hyytiälä in the upper panel and Zeppelin Mountain in the lower panel (DJF=Dec–Feb, MAM=Mar–May, JJA=Jun–Aug, SON=Sep–Nov).
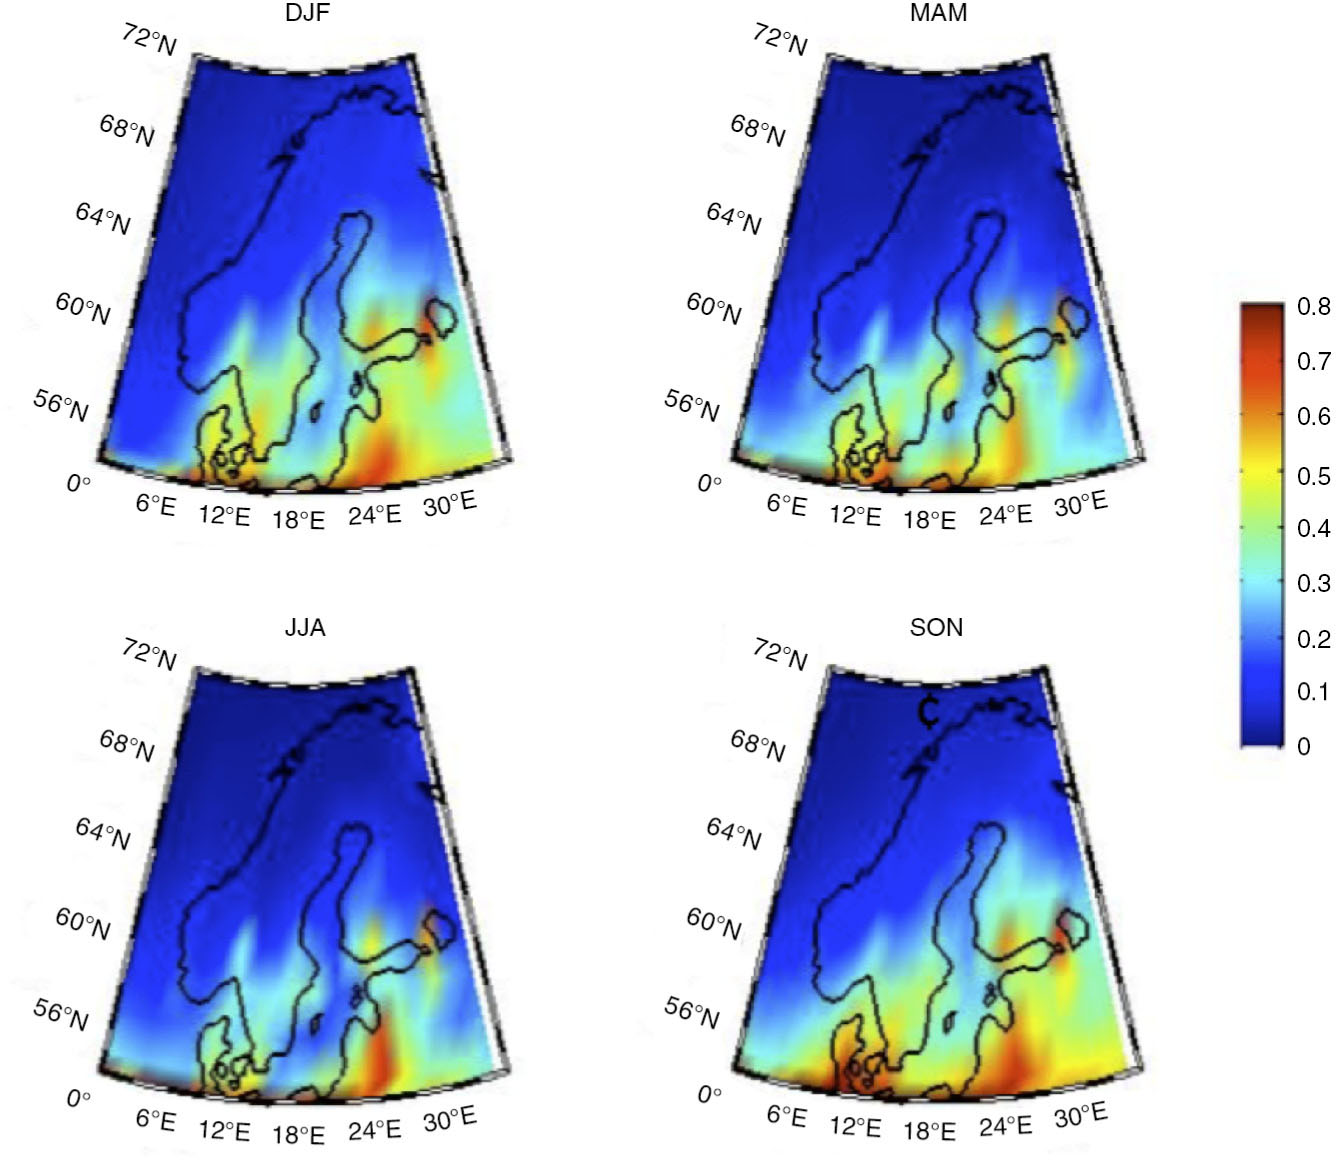
Fig. 7
Spatial distribution of BC surface concentrations seasonal mean (µg/m3) (DJF=Dec–Feb, MAM=Mar–May, JJA=Jun–Aug, SON=Sep–Nov).
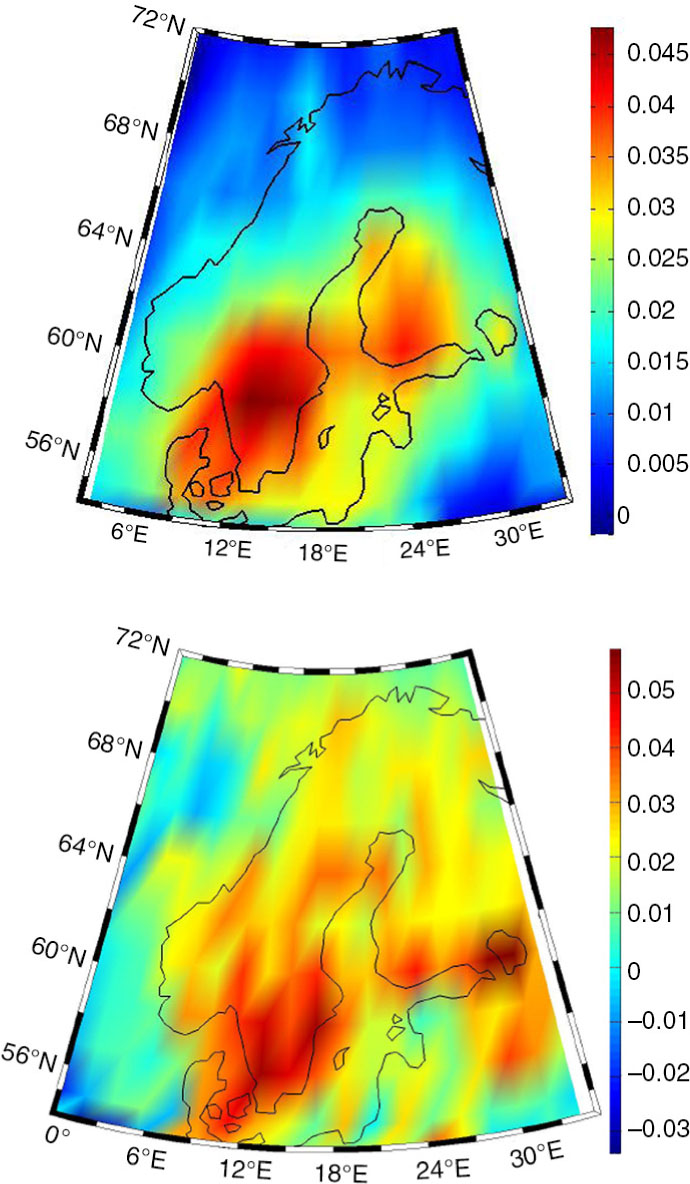
Fig. 8
Twelve years mean TOA clear-sky (upper) and total-sky (lower) BC radiative forcing over DFNS (W/m2) from the ΔBCDFNS0 experiment where the BC anthropogenic emissions in DFNS area have been set to zero.
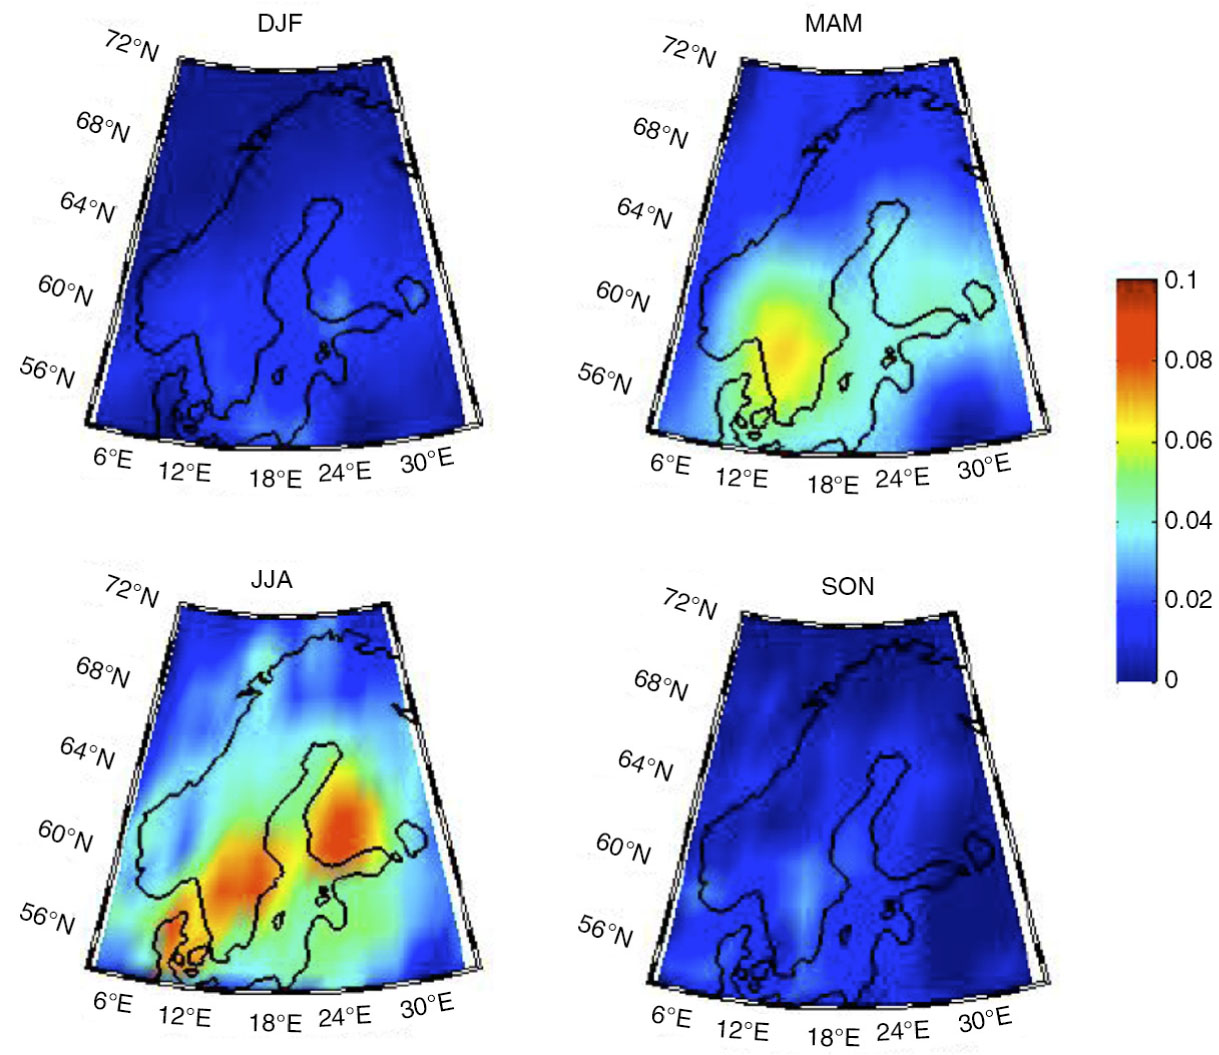
Fig. 9
Seasonal TOA SW clear-sky BC radiative forcing over DFNS (W/m2 from the ΔBCDFNS0 experiment where the BC anthropogenic emissions in DFNS area have been set to zero). (DJF=Dec–Feb, MAM=Mar–May, JJA=Jun–Aug, SON=Sep–Nov).
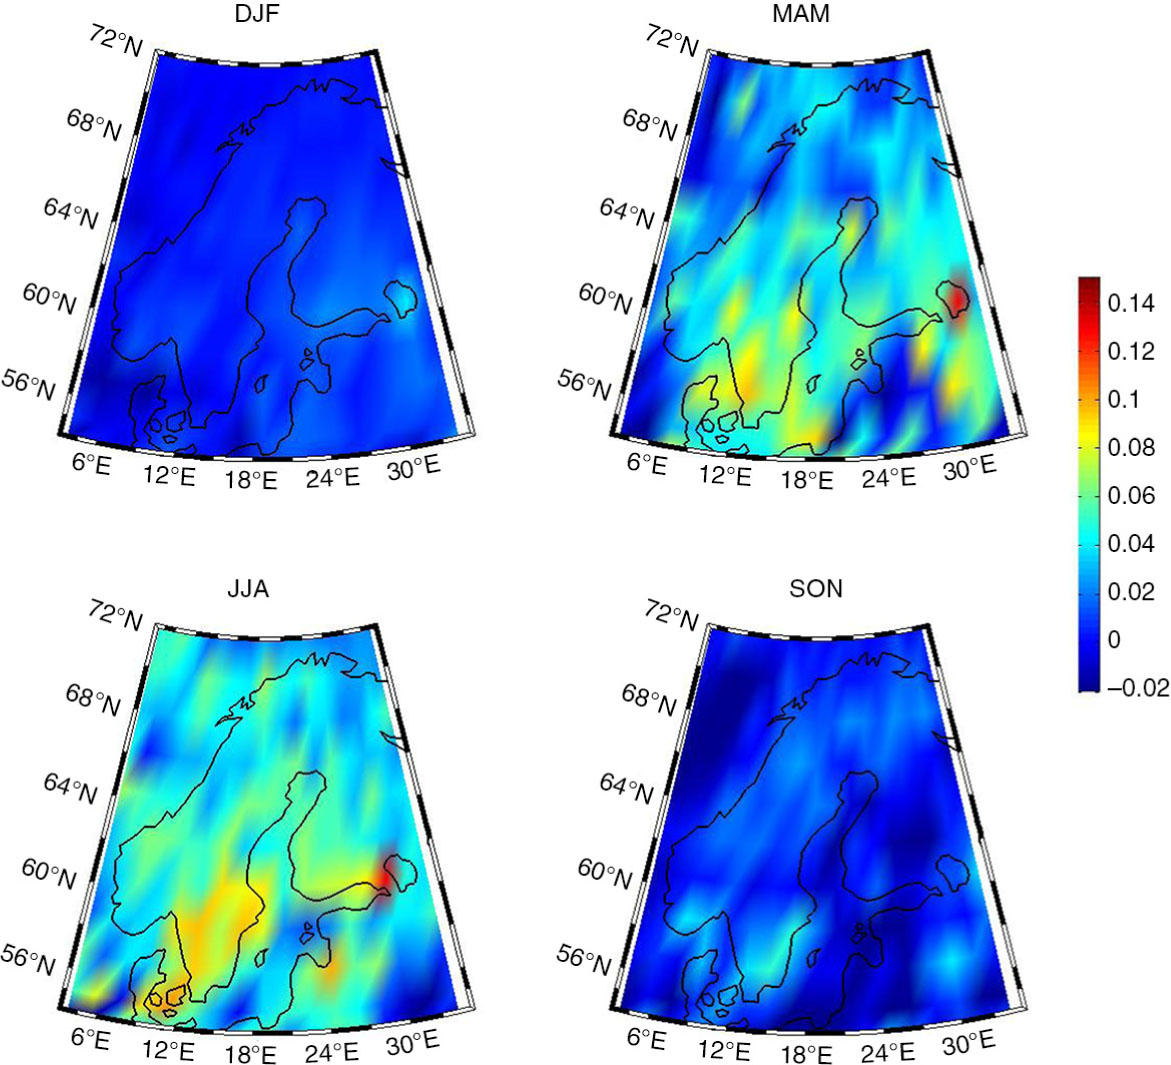
Fig. 10
Seasonal TOA SW total-sky BC radiative forcing over DFNS (W/m2 from the ΔBCDFNS0 experiment where the BC anthropogenic emissions in DFNS area have been set to zero). (DJF=Dec–Feb, MAM=Mar–May, JJA=Jun–Aug, SON=Sep–Nov).
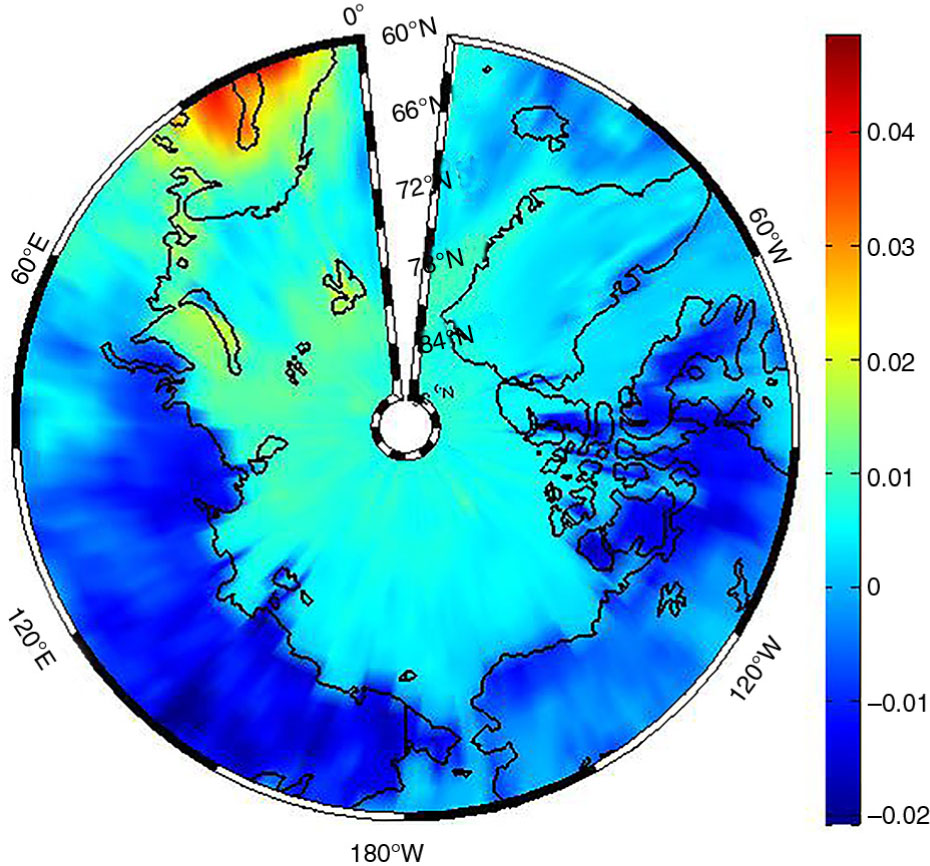
Fig. 11
TOA SW clear-sky BC radiative forcing over Arctic (W/m2) from the ΔBCDFNS0 experiment where the BC anthropogenic emissions in DFNS area have been set to zero.
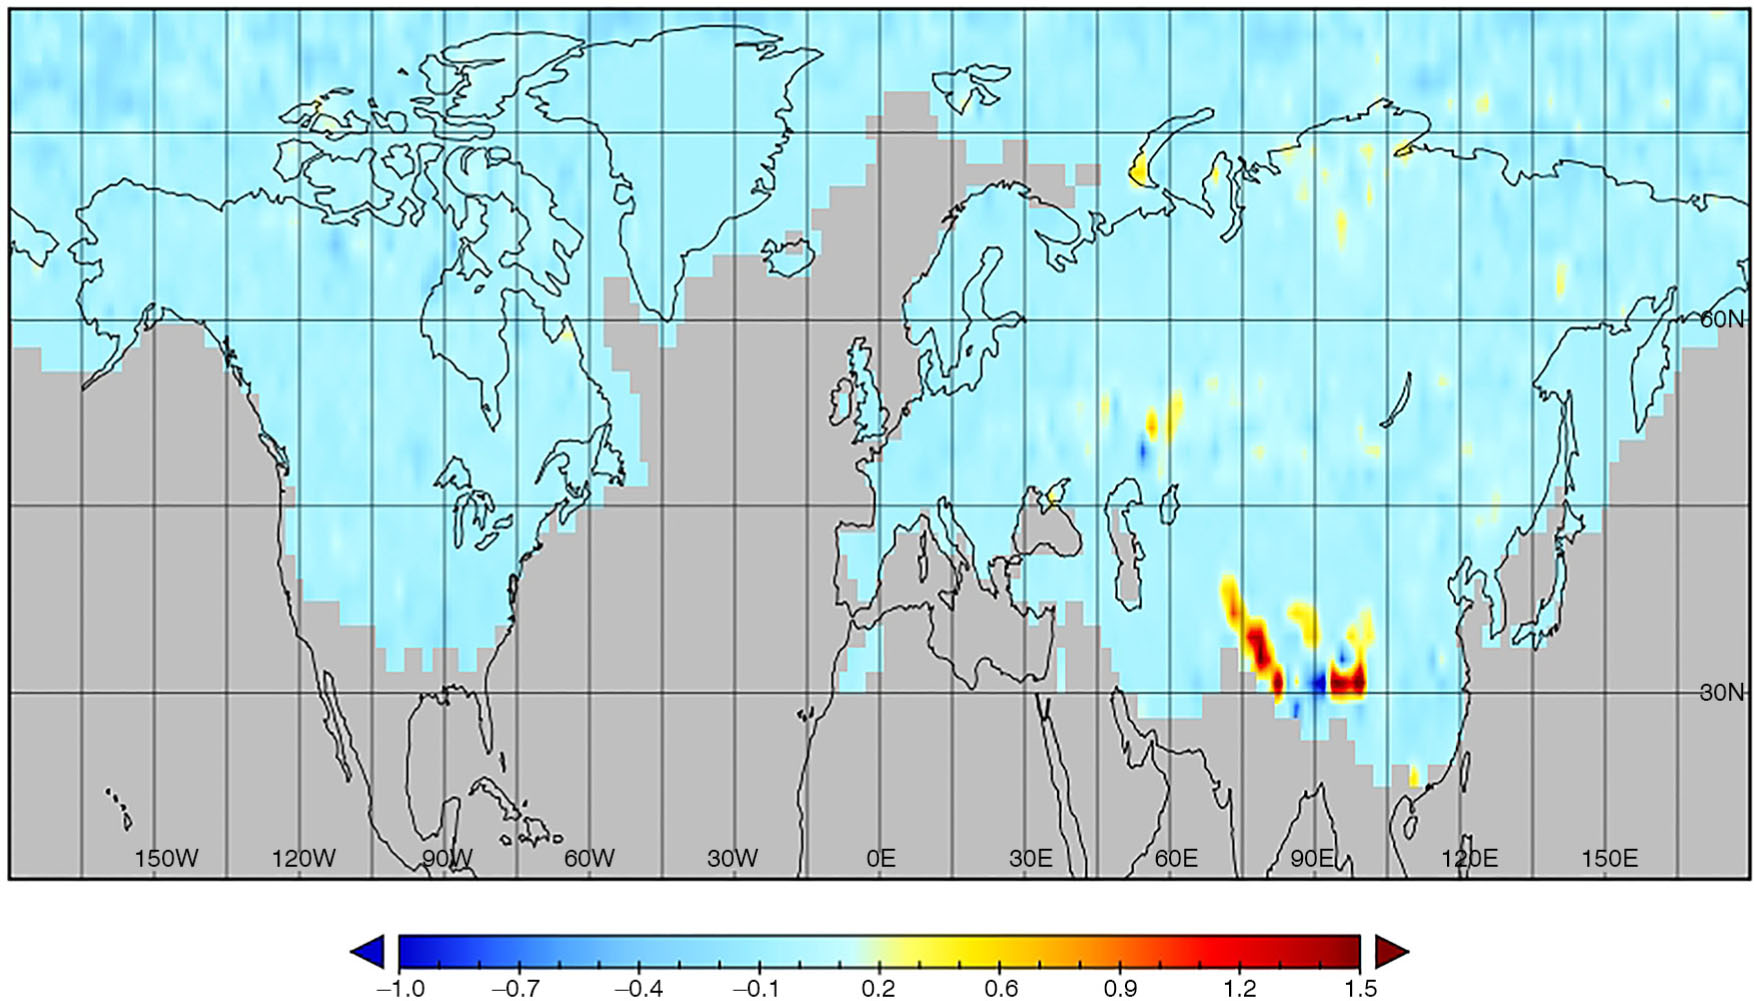
Fig. 12
BC in snow and ice forcing (W/m2) averaged over 12 yr (2000–2011) from the ΔALB experiment.
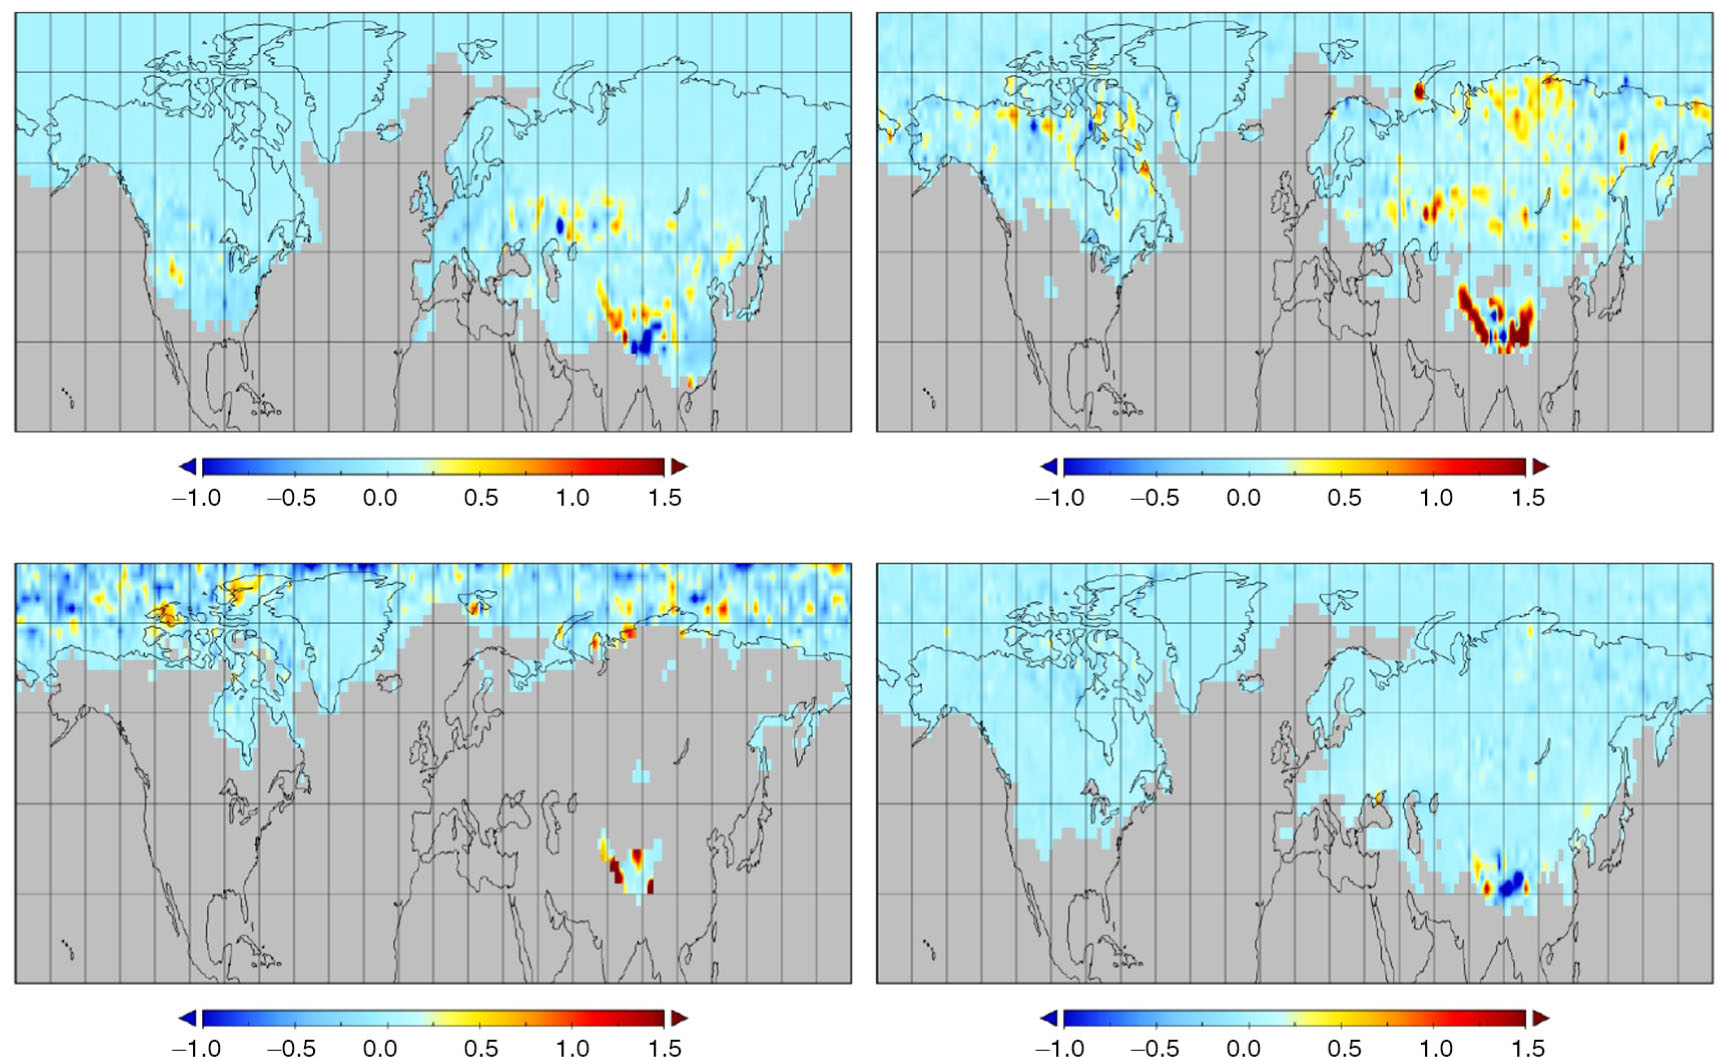
Fig. 13
Seasonal BC in snow and ice forcing (W/m2) averaged over 12 yr (2000–2011) from the ΔALB experiment (DJF = Dec–Feb, MAM = Mar–May, JJA = Jun–Aug, SON = Sep–Nov).
Table 3. Mean SW clear-sky (CS), total-sky (TS) and BC-in-snow (BCs) radiative forcing (mW/m2) from ΔBCDFNS0, ΔBCA, ΔALB and ALBDFNS0 experiments over DFNS, Arctic and at global level