
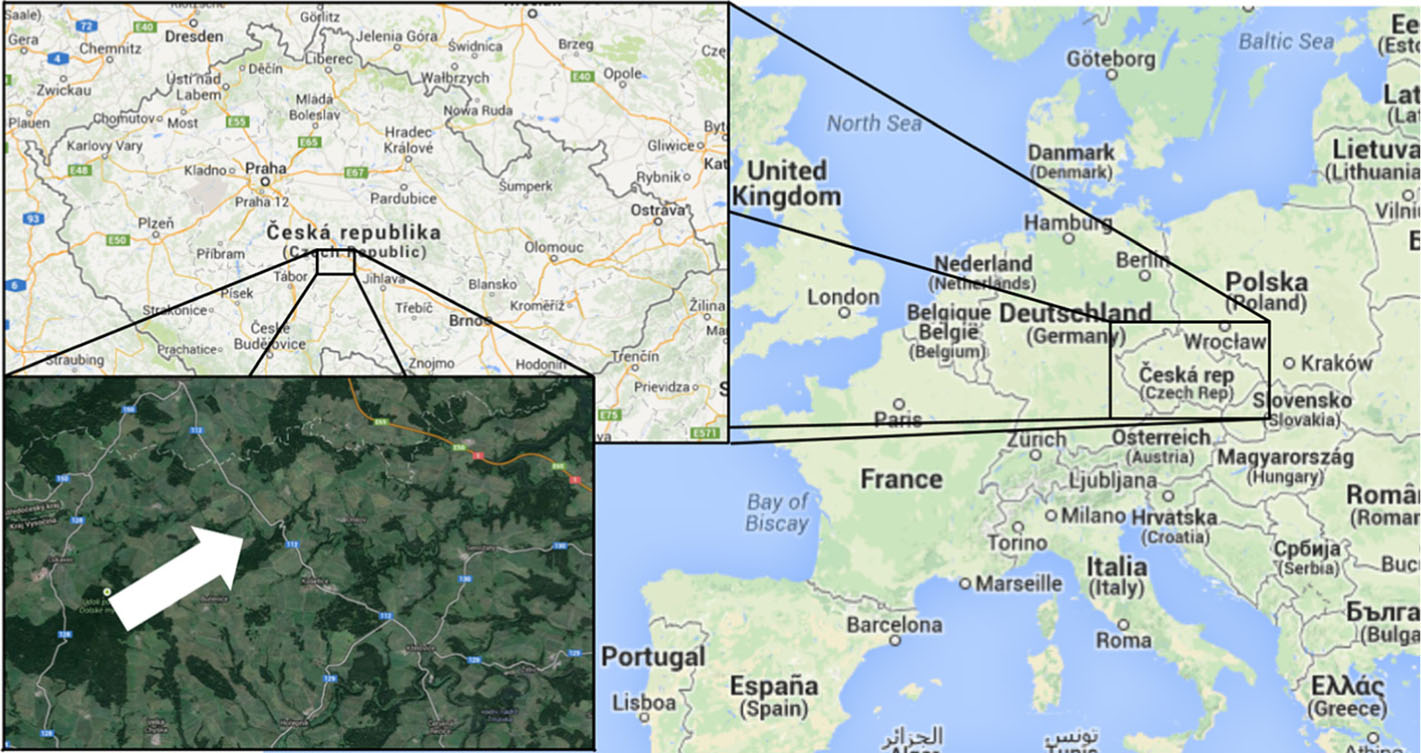
Fig. 1
Observatory Košetice geographical position. (Maps taken from www.maps.google.com/)
Table 1. The number of recorded events, numbers of the respective 5-minute SMPS scans, and averaged duration of the phenomena (with their WMO codes) used in this study
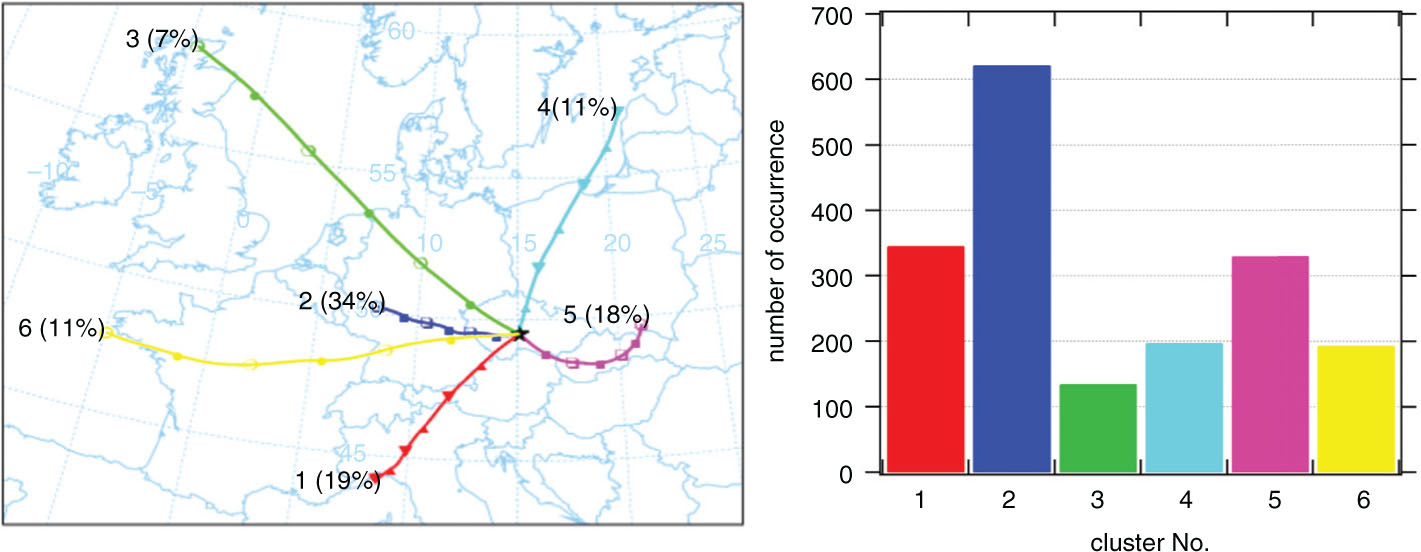
Fig. 2
Left: Means of the six air mass clusters coming to the Košetice observatory. The markers denote 6-hour time intervals. Right: number of occurrence of trajectories in individual clusters during the 5-year measurement period.
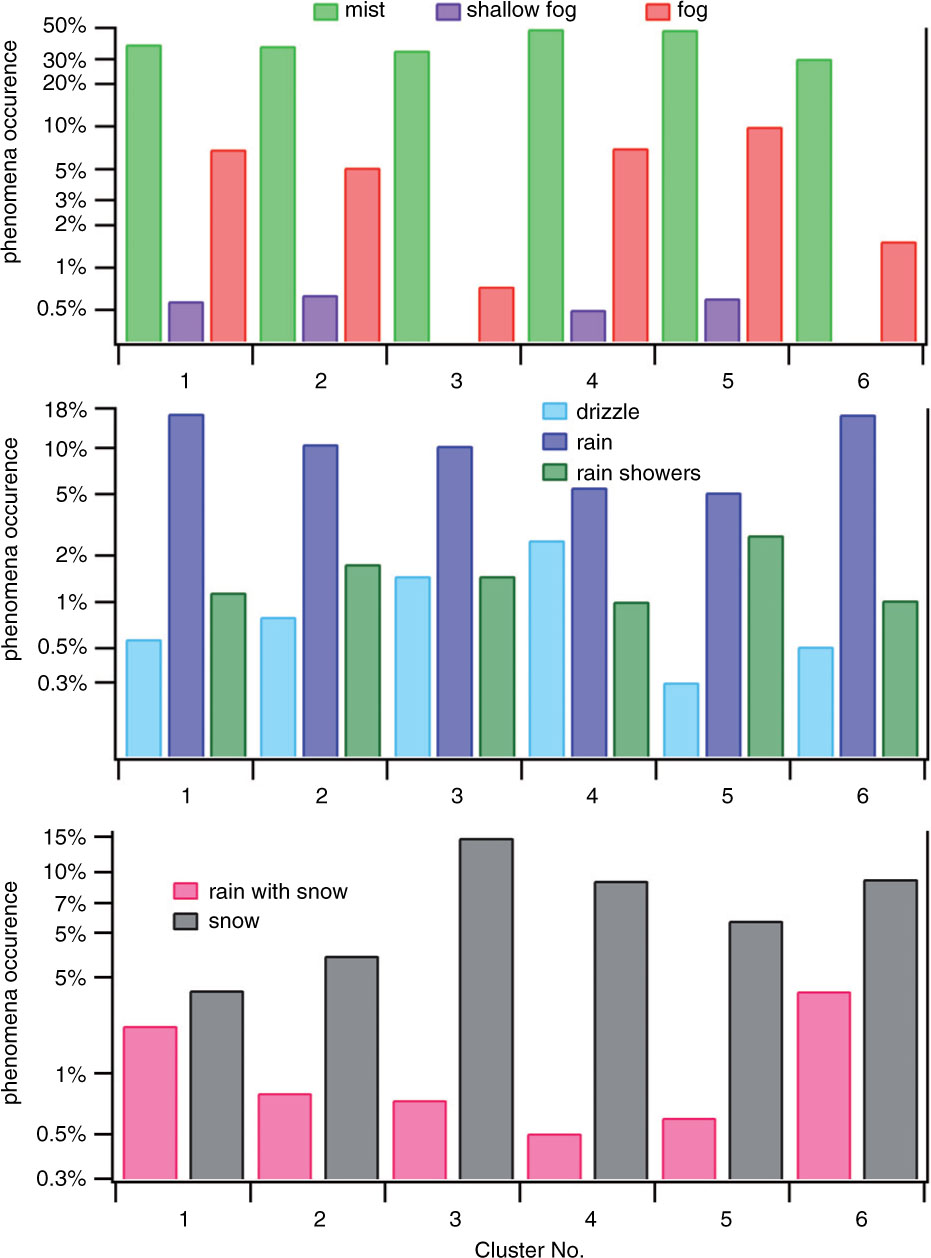
Fig. 3
Number of occurrences of individual phenomena during air masses coming from the six clusters. Top: number of occurrences of mist, fog and shallow fog. Middle: number of occurrences of drizzle, rain and rain showers. Bottom: number of occurrences of snow and rain with snow.
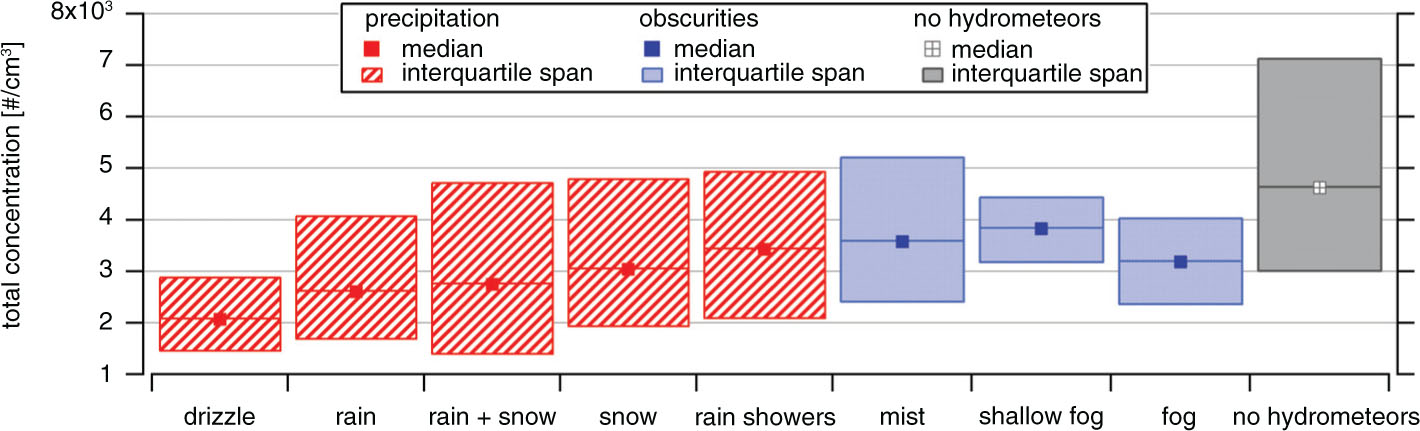
Fig. 4
Box plots of the total number concentration of AA measured during individual meteorological phenomena and during periods without the presence of hydrometeors. The marker shows the median, and the box indicates the interquartile span.
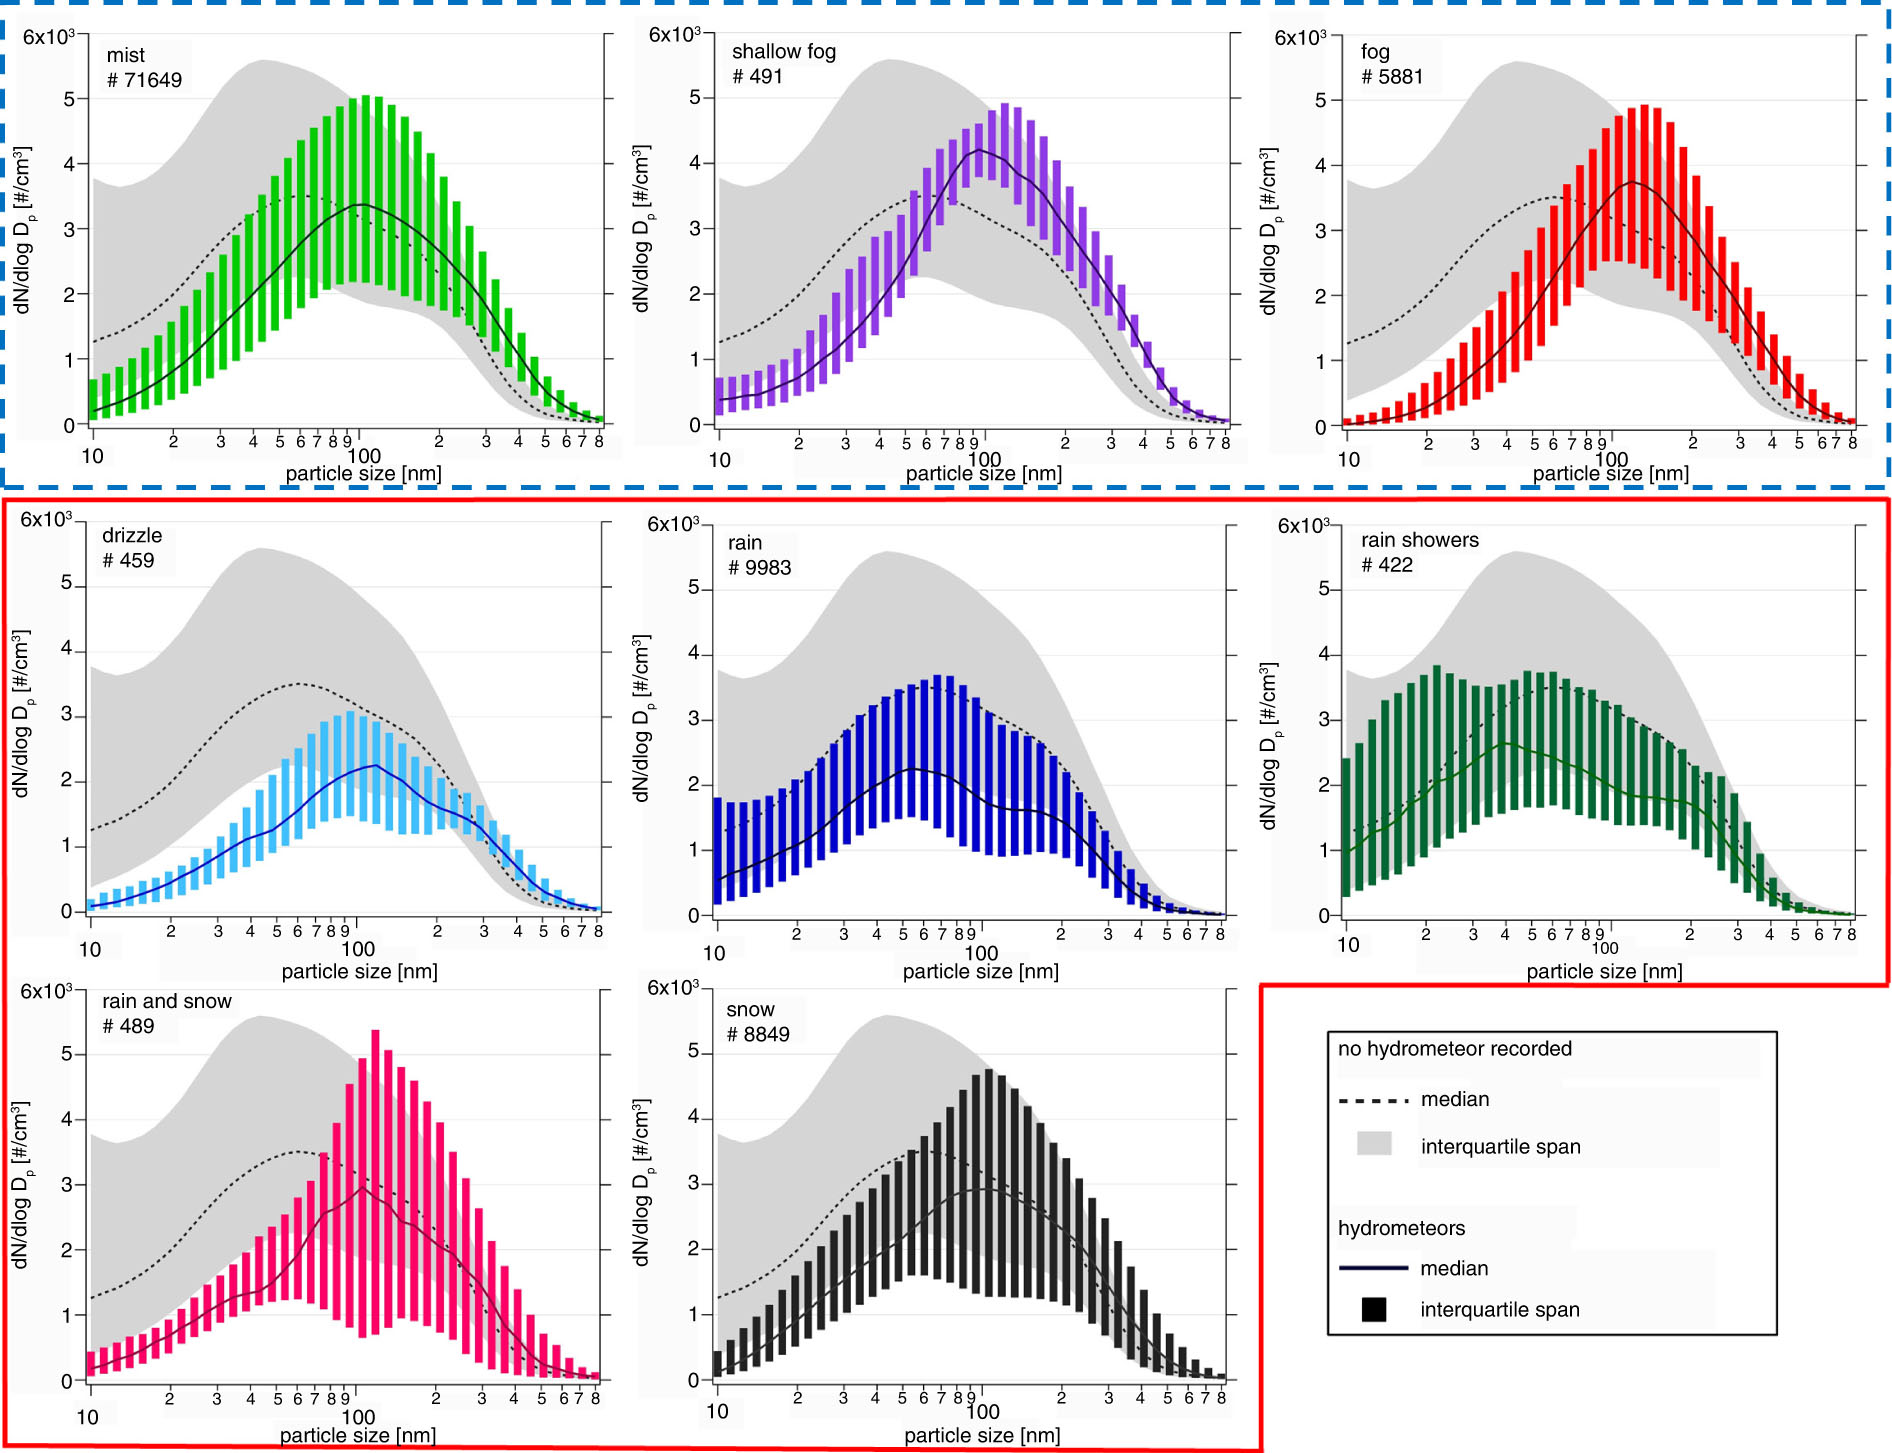
Fig. 5
Median (lines) and interquartile span (bars) of typical spectra during individual meteorological phenomena, as compared to the typical spectrum recorded without any hydrometeor (grey area). Obscurities are in the first row, highlighted with a blue dashed rectangle; precipitations are highlighted with the red solid line. The number (#) is the number of averaged SMPS spectra.
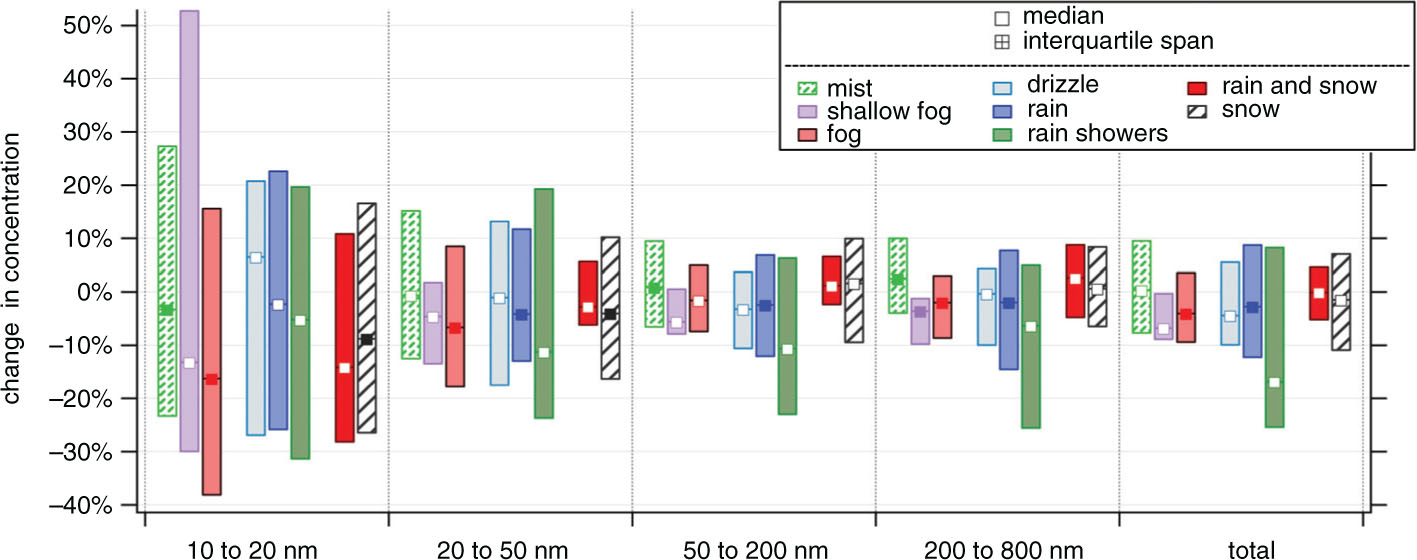
Fig. 6
The box plot of change in concentrations after the appearance of obscurities, and both liquid and solid precipitation in individual cumulative size intervals. The markers denote the median of the change, box boundaries denote the 1st and 3rd quartiles, and the size of the boxes indicates the value of the interquartile span. The filled markers denote a statistically significant change.
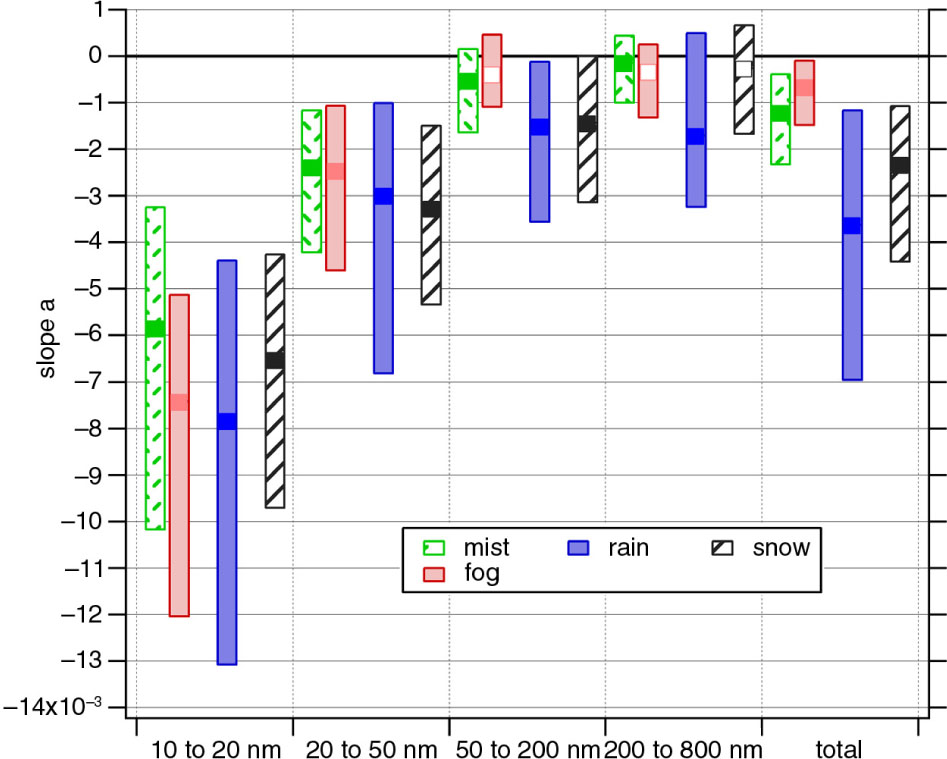
Fig. 7
The dependence of medians (markers) and interquartile span (bars) of the change of cumulative concentrations in time on particle size classes for individual obscurities and precipitation. A statistically significant change is denoted with filled markers.
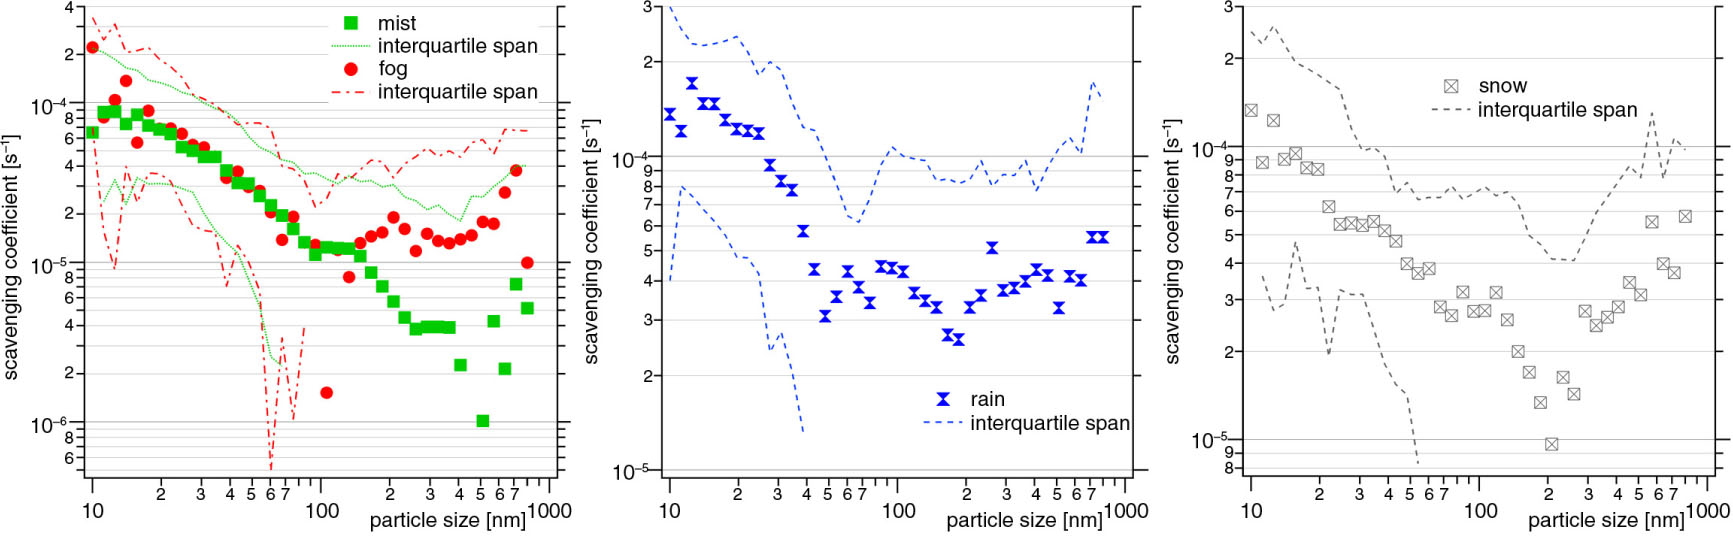
Fig. 8
The size-dependent scavenging coefficient of meteorological phenomena. Left: obscurities; middle: rain; right: snow. The markers stand for the median; the area between lines (1st and 3rd quartiles) shows the interquartile span. The negative values of the 1st quartile are not shown in the plot.
Table 2. Scavenging coefficients in the size range from 10 to 800 nm (5th–95th percentile) for obscurities and precipitation, as compared to other studies