
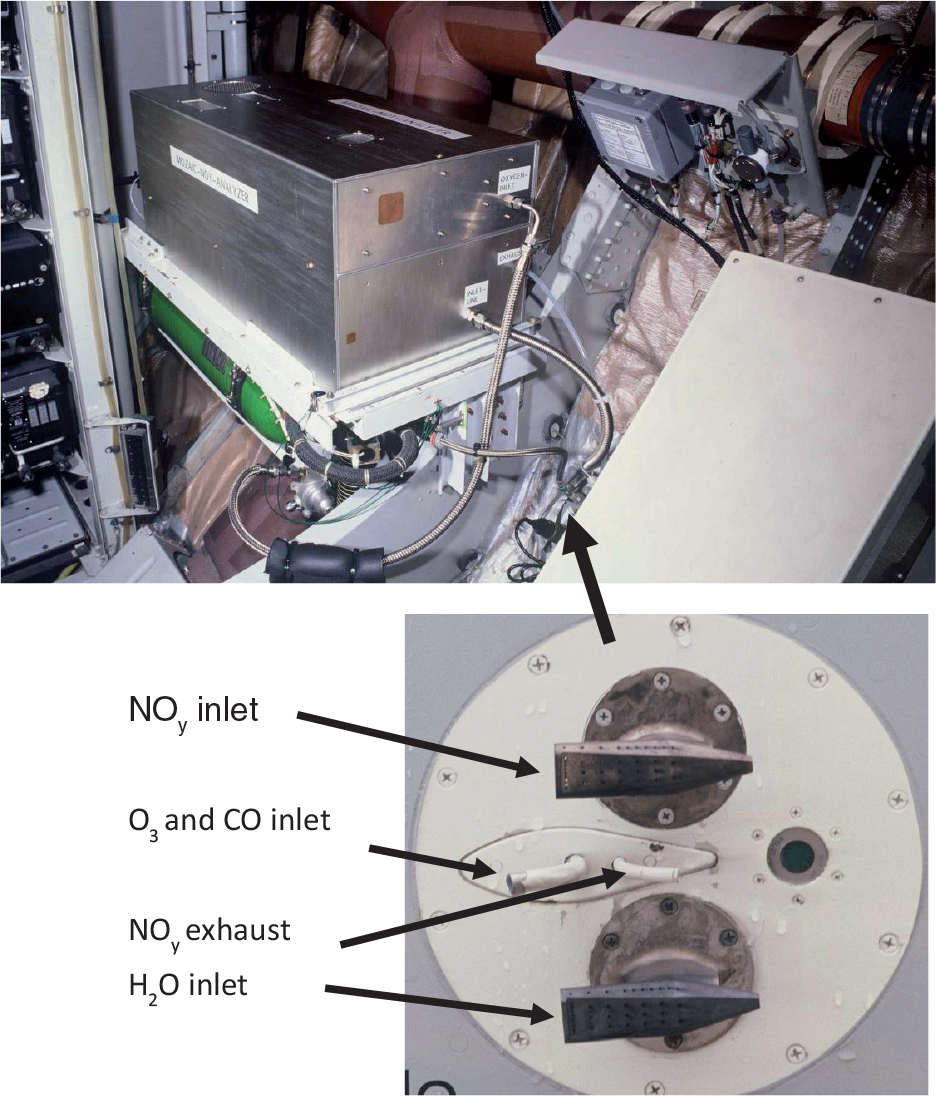
Fig. 1
MOZAIC NOy instrument installed in the avionic bay of the Airbus A340–300 D-AIGI operated by Lufthansa. The lower part shows the MOZAIC Inlet Plate with the different inlet probes, mounted at the fuselage of the aircraft. The fat arrow denotes the position of the inlet plate inside the aircraft.
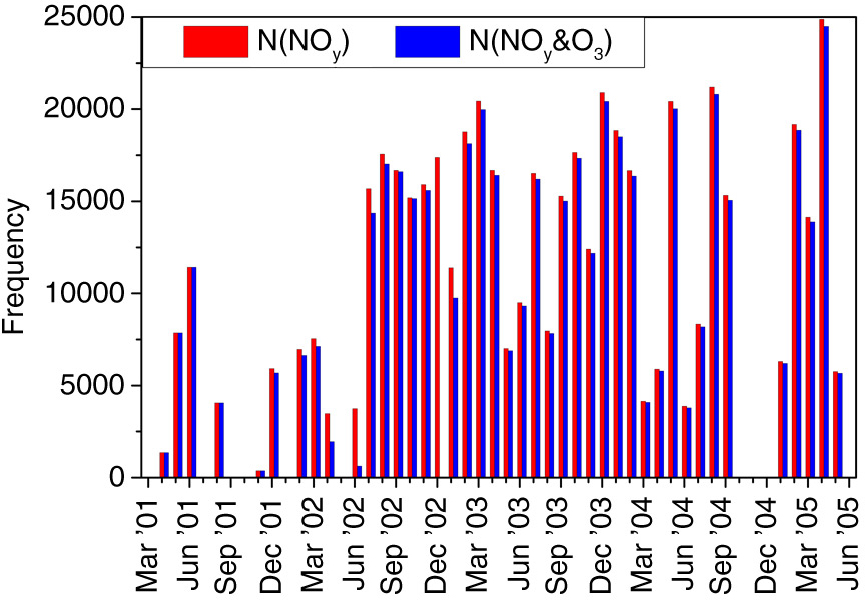
Fig. 2
Time series of the number of NOy measurements (1 min averages) obtained per month (red bars) and the number of concurrent NOy and O3 measurements (blue bars).
Table 1. Flight statistics for the MOZAIC NOy instrument
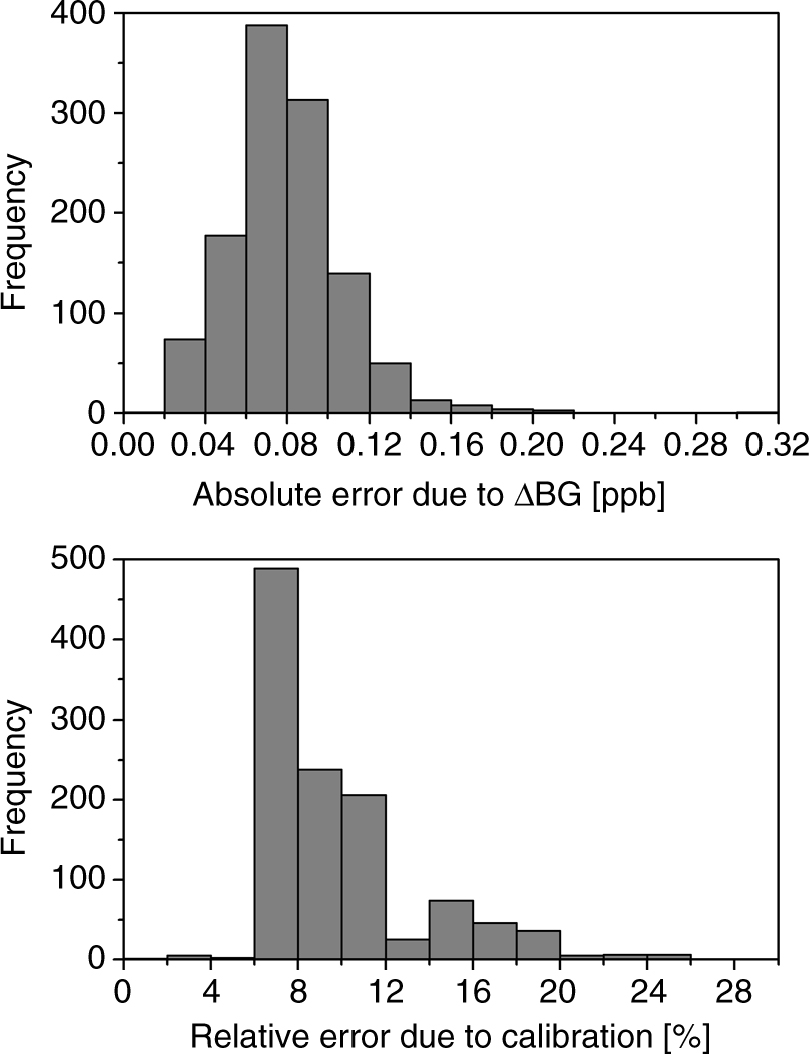
Fig. 3
Frequency distributions of the relevant contributions to the overall uncertainty calculated from all flights with valid NOy data. Lower panel: uncertainties in calibration, i.e., sqrt((ΔS/S)2+(ΔE/E)2); upper panel: uncertainty of the artefact NOy signal, ΔBG.
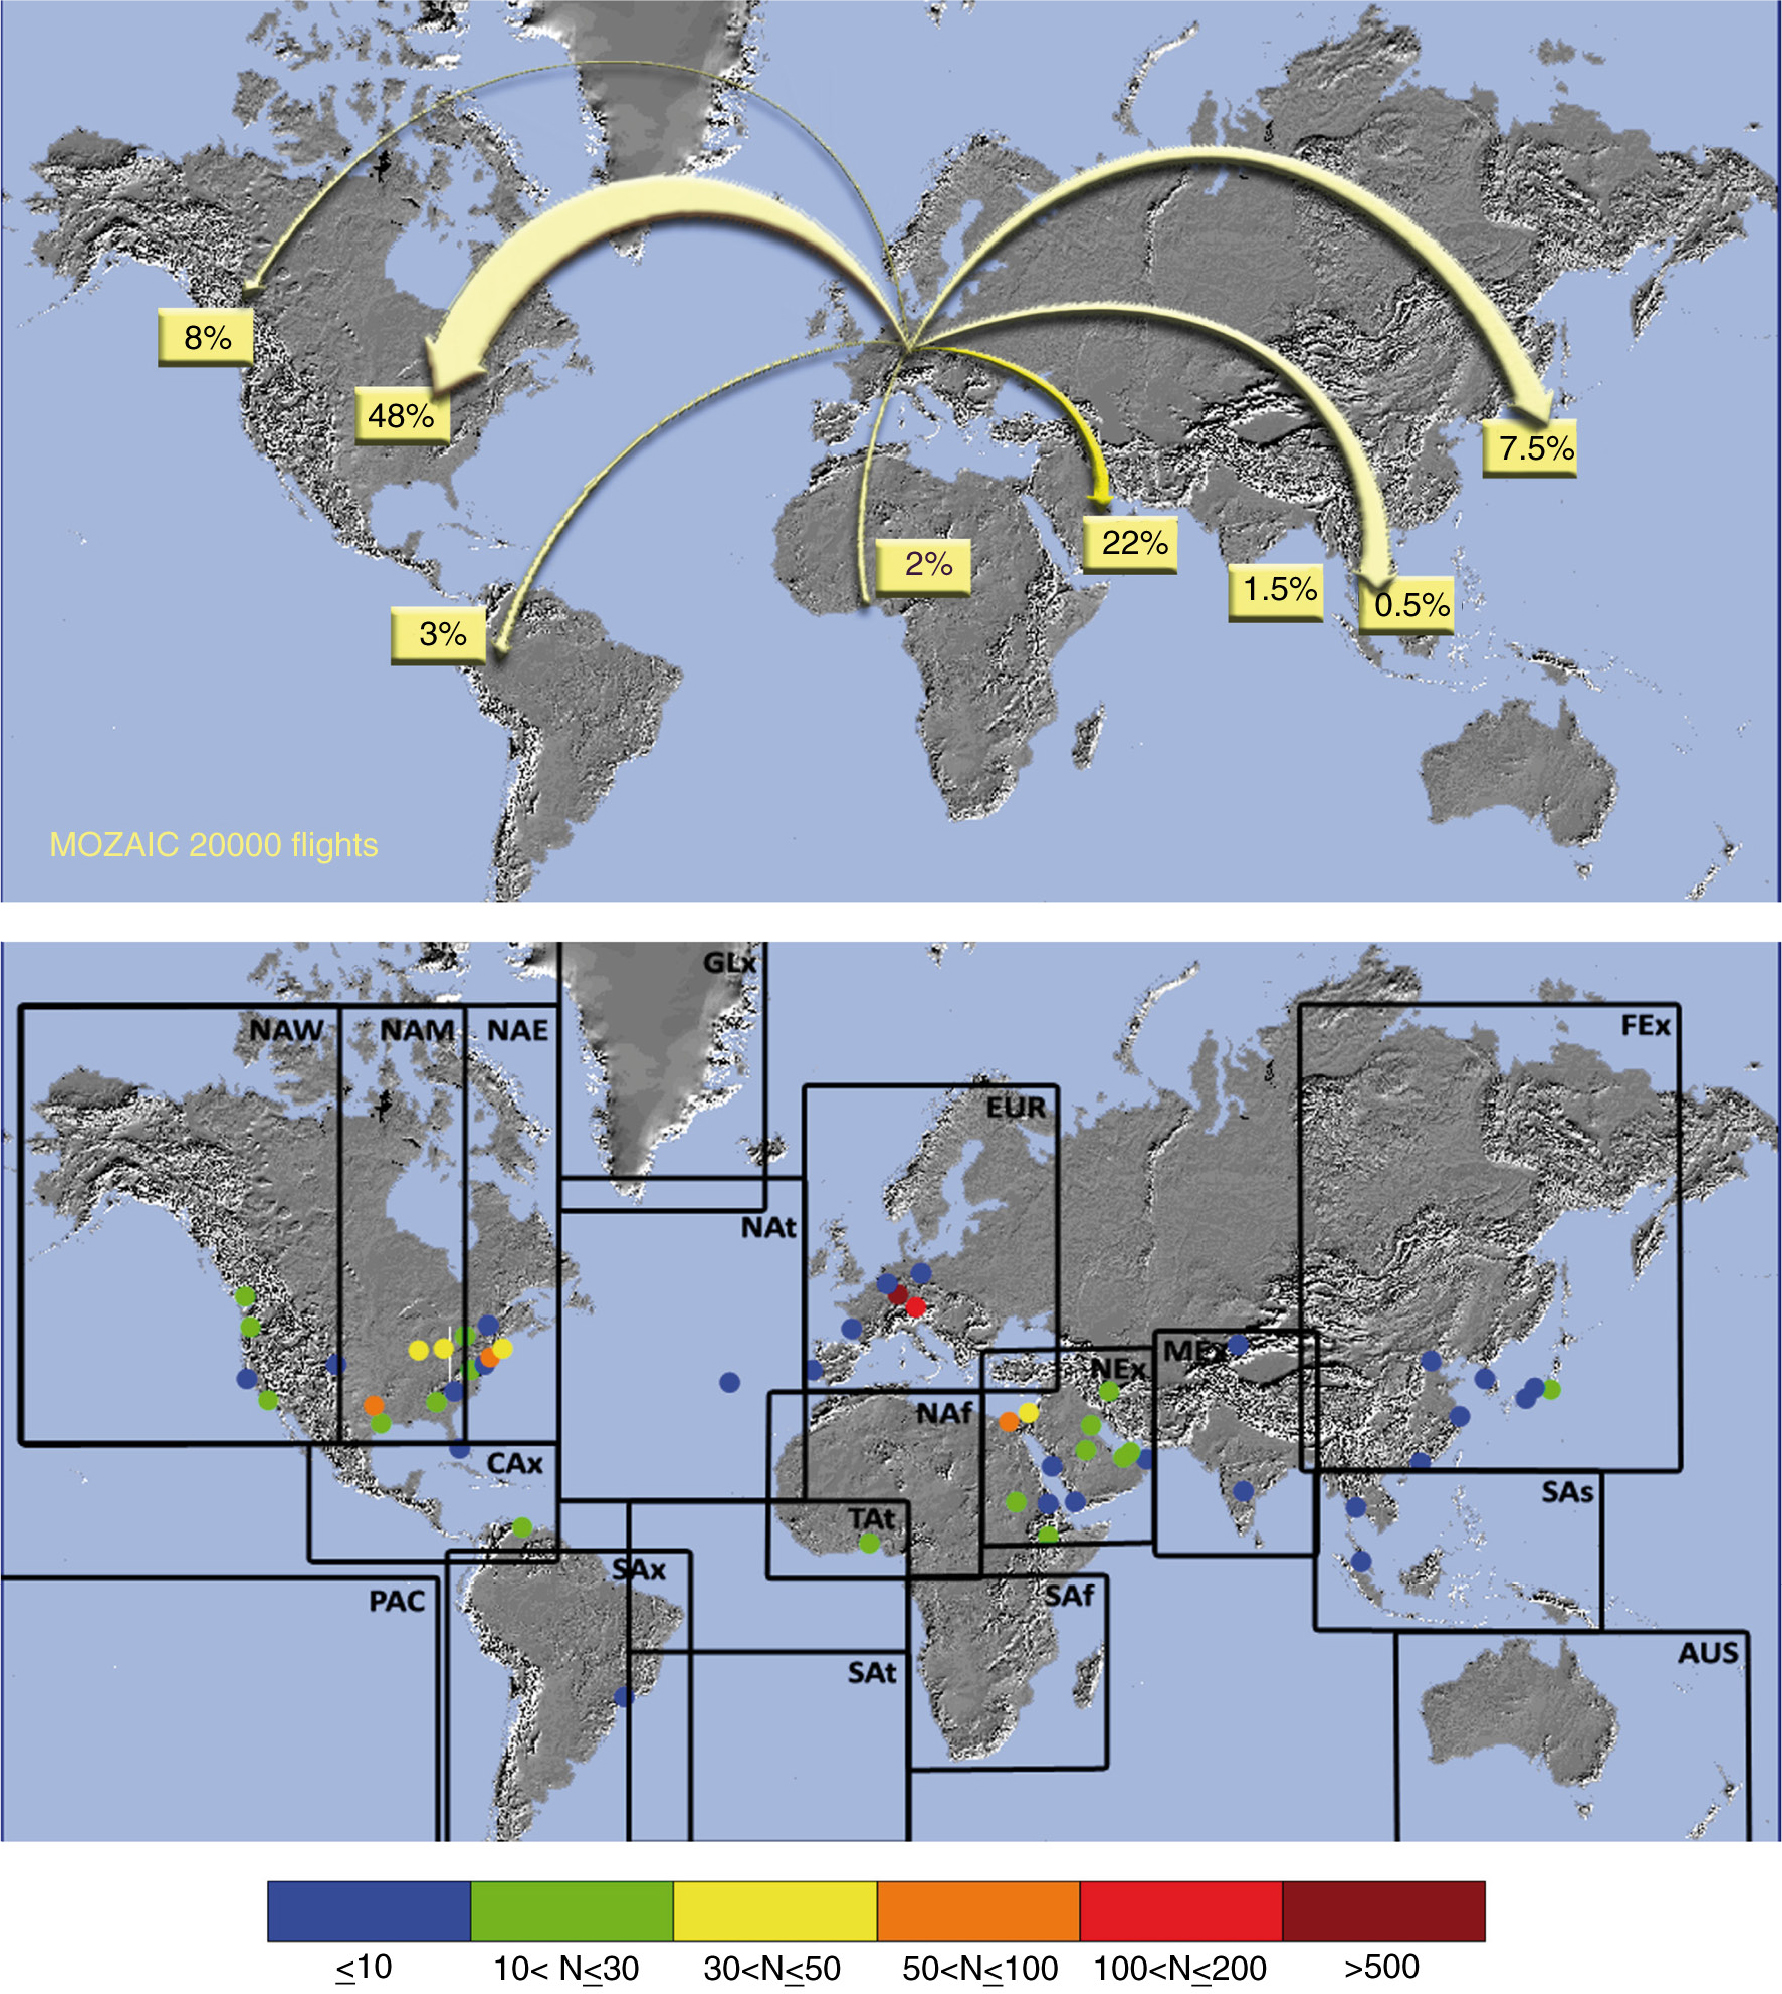
Fig. 4
Upper panel: geographical distribution of flights with NOy measurements. Lower panel: airports with NOy profiles and definition of regions used in the analysis. The colour bar denotes the number of profiles collected over the different airports.
Table 2. Availability of MOZAIC NOy data and vertical profiles in the different geographical regions defined in Fig. 4
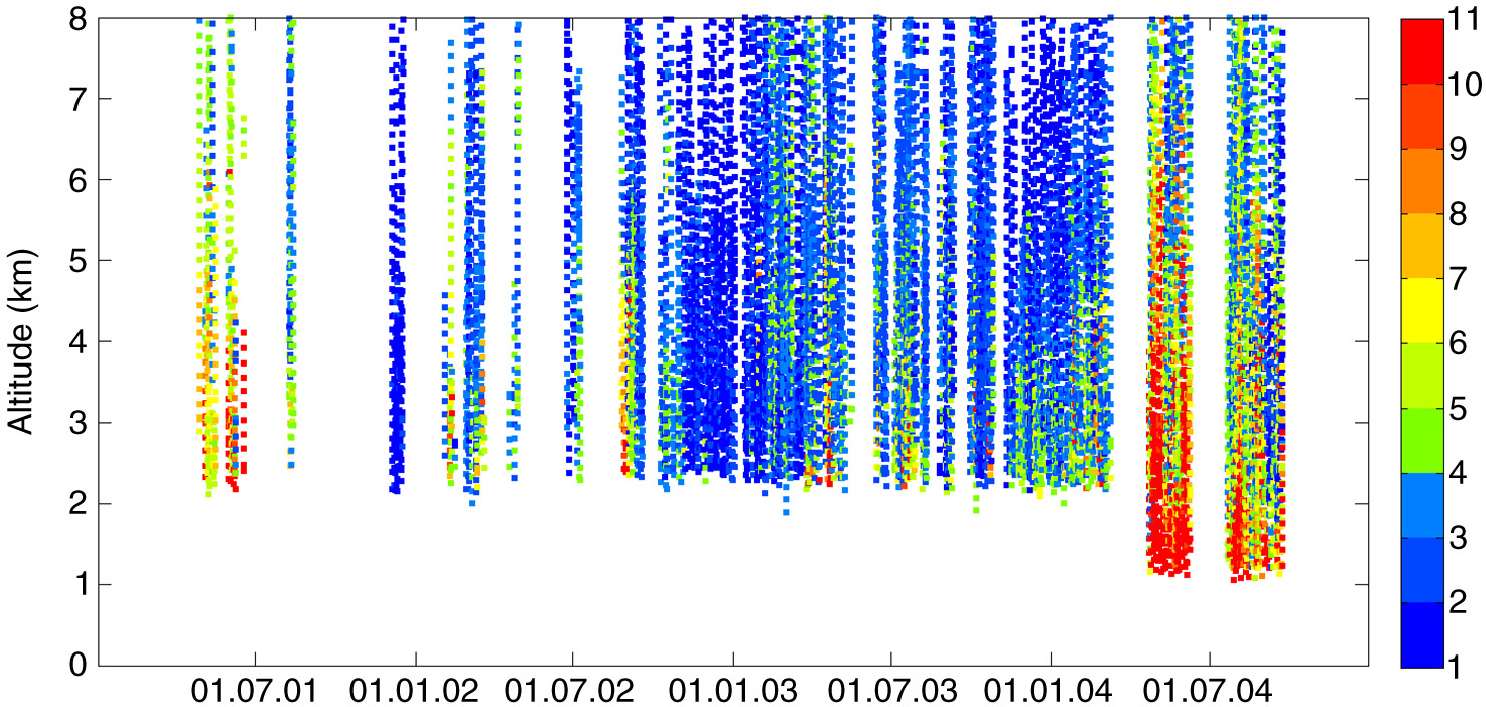
Fig. 5
Vertical profiles of NOy over Frankfurt. The lower boundary is determined by the pressure at which the instrument is switched into stand-by (initially at 800 hPa, changed to 900 hPa in April 2004). Colour bar: NOy mixing ratio in ppb.
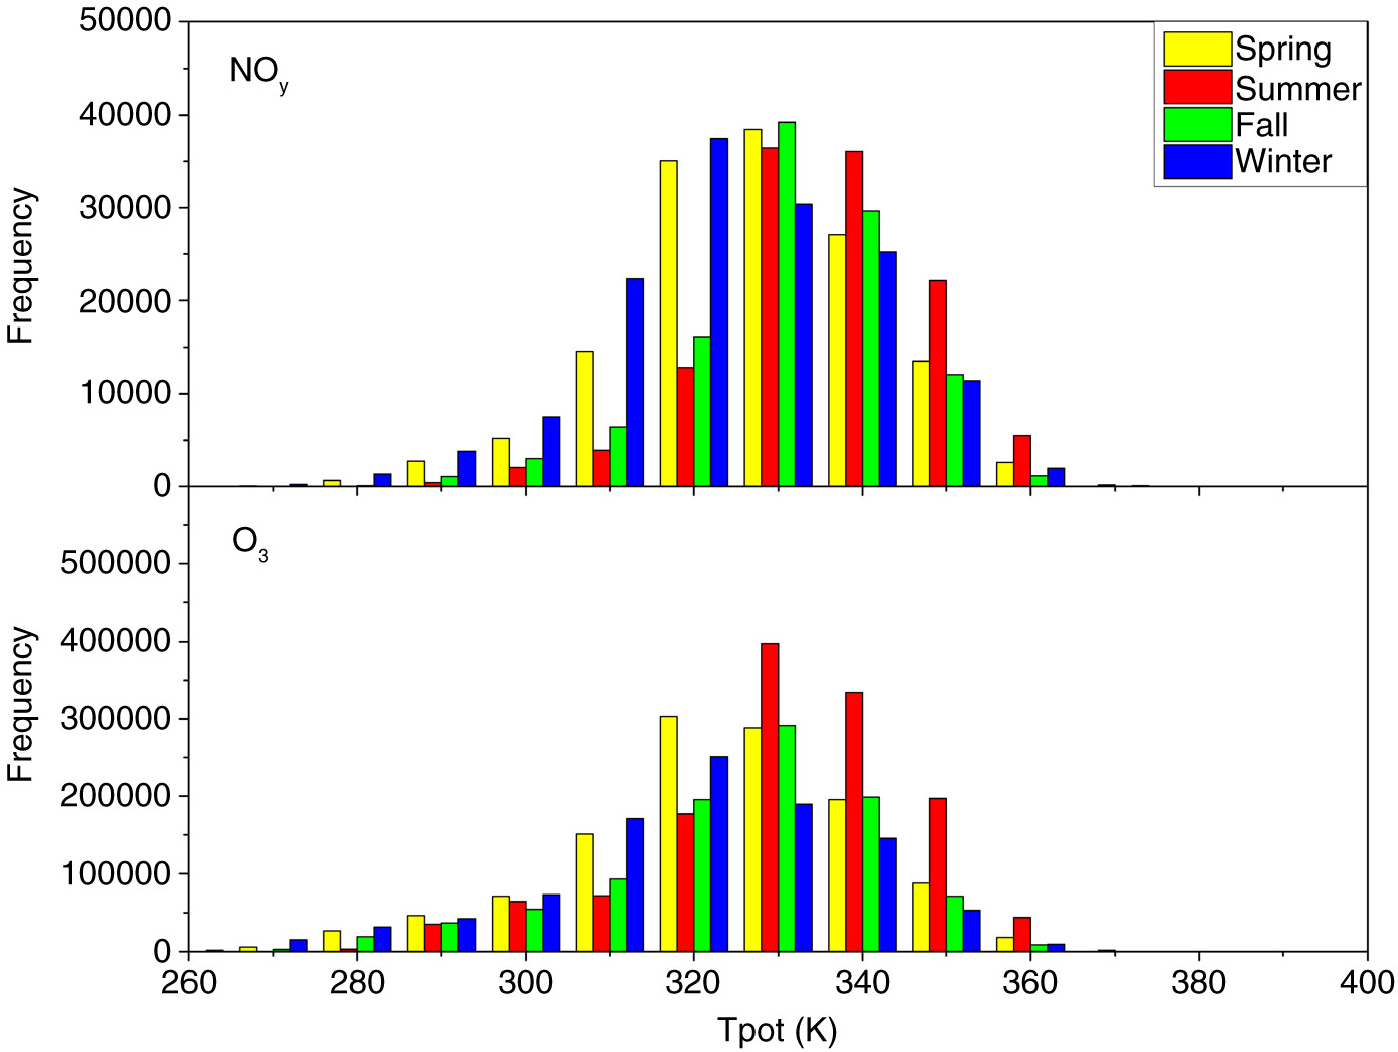
Fig. 6
Frequency distribution of NOy and O3 as a function of potential temperature (T pot) for each season (spring: MAM; summer: JJA; fall: SON; winter: DJF).
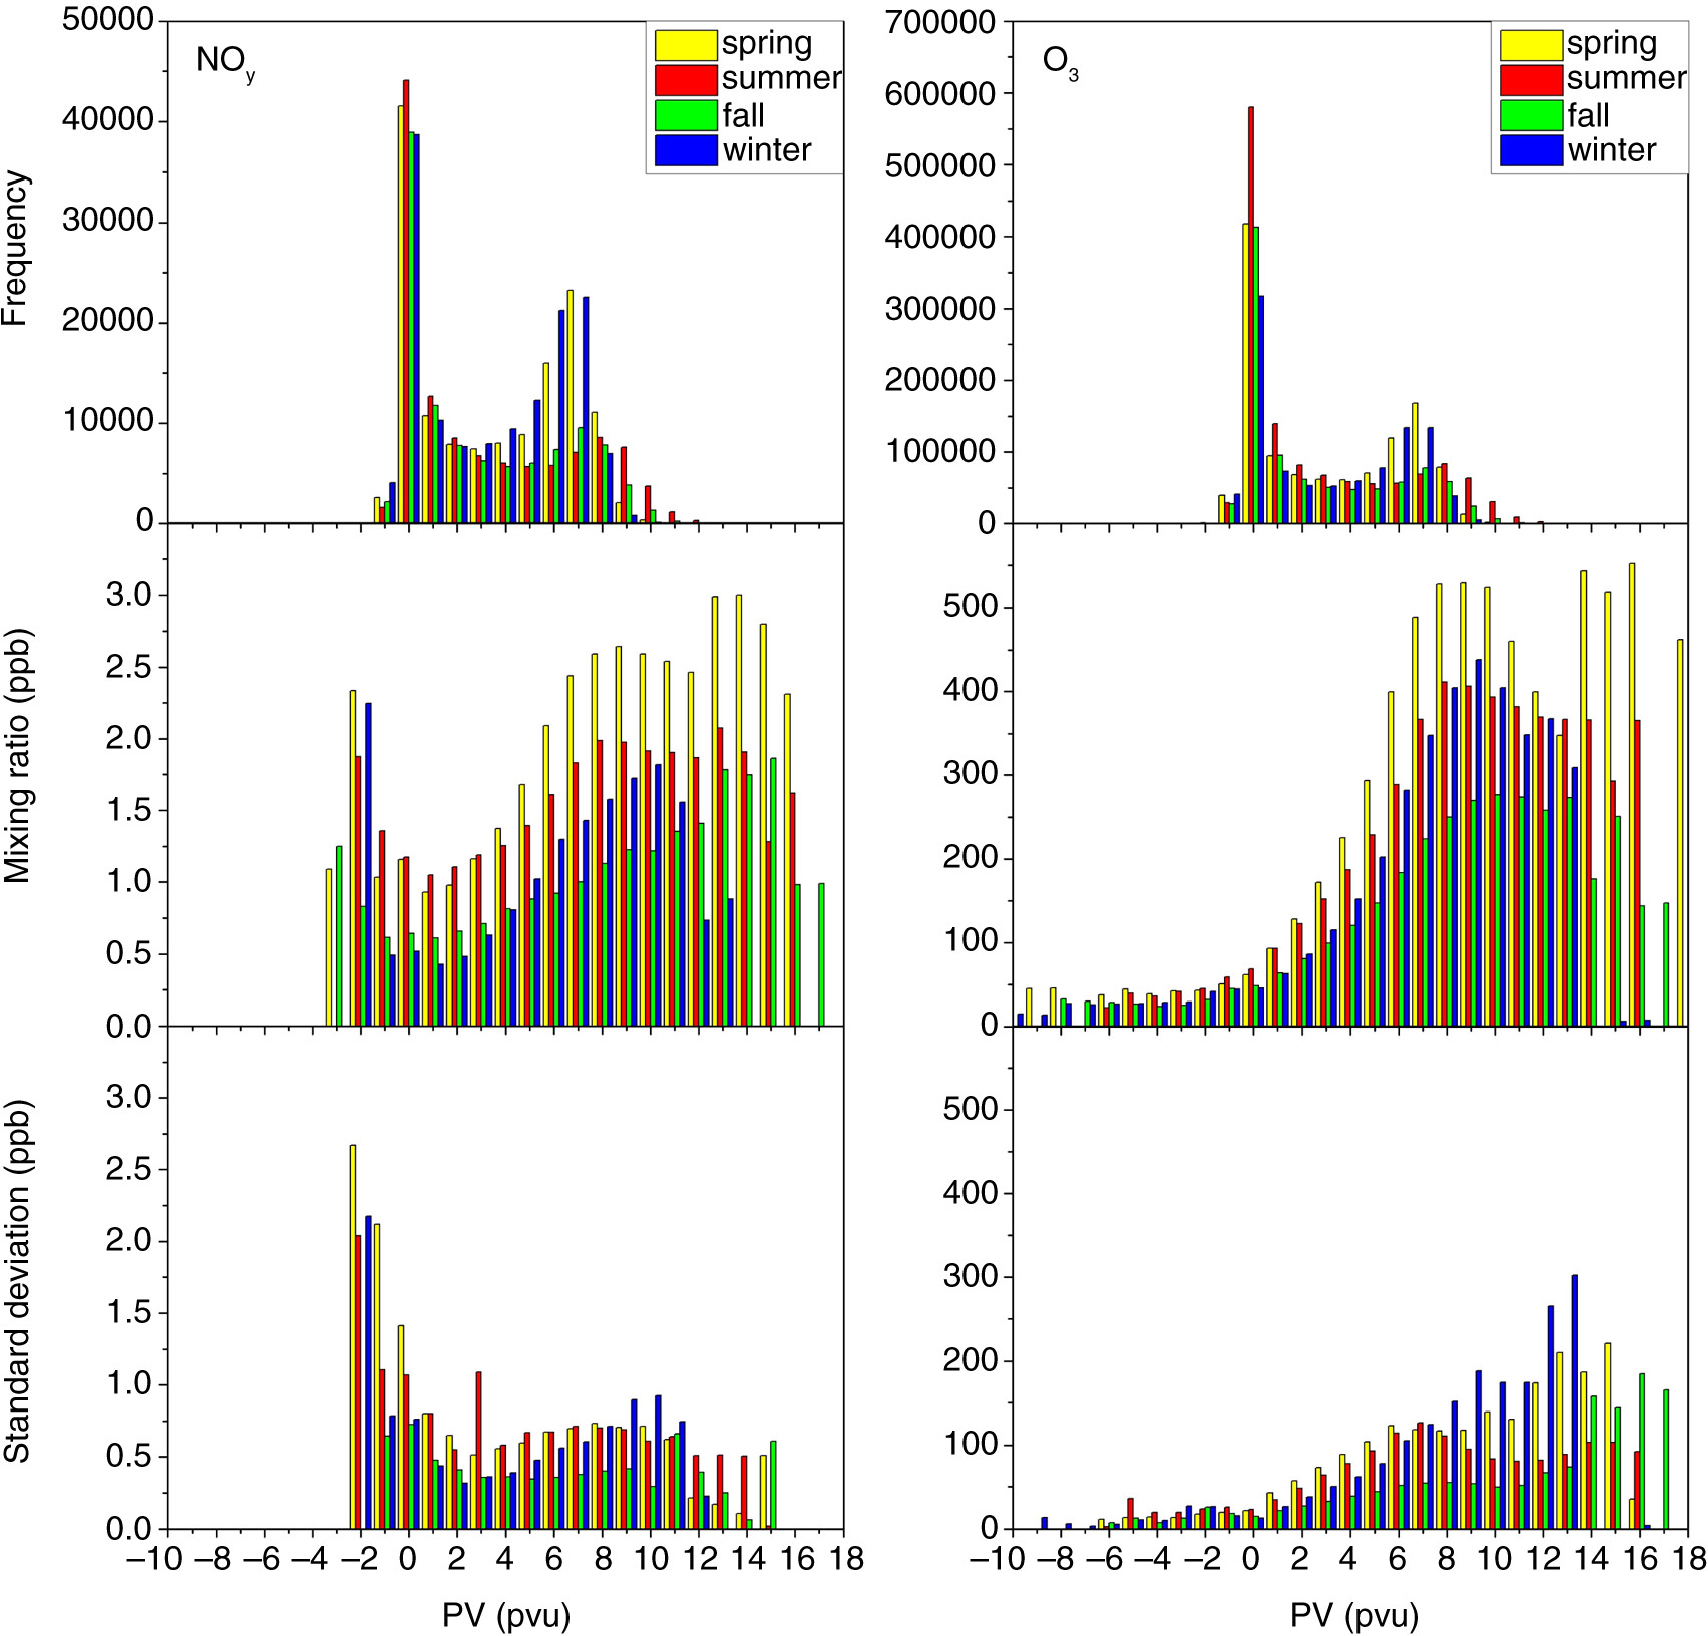
Fig. 7
Frequency of measurements, mean mixing ratio and standard deviation of NOy (left) and O3 (right) as a function of potential vorticity (PV) for each season.
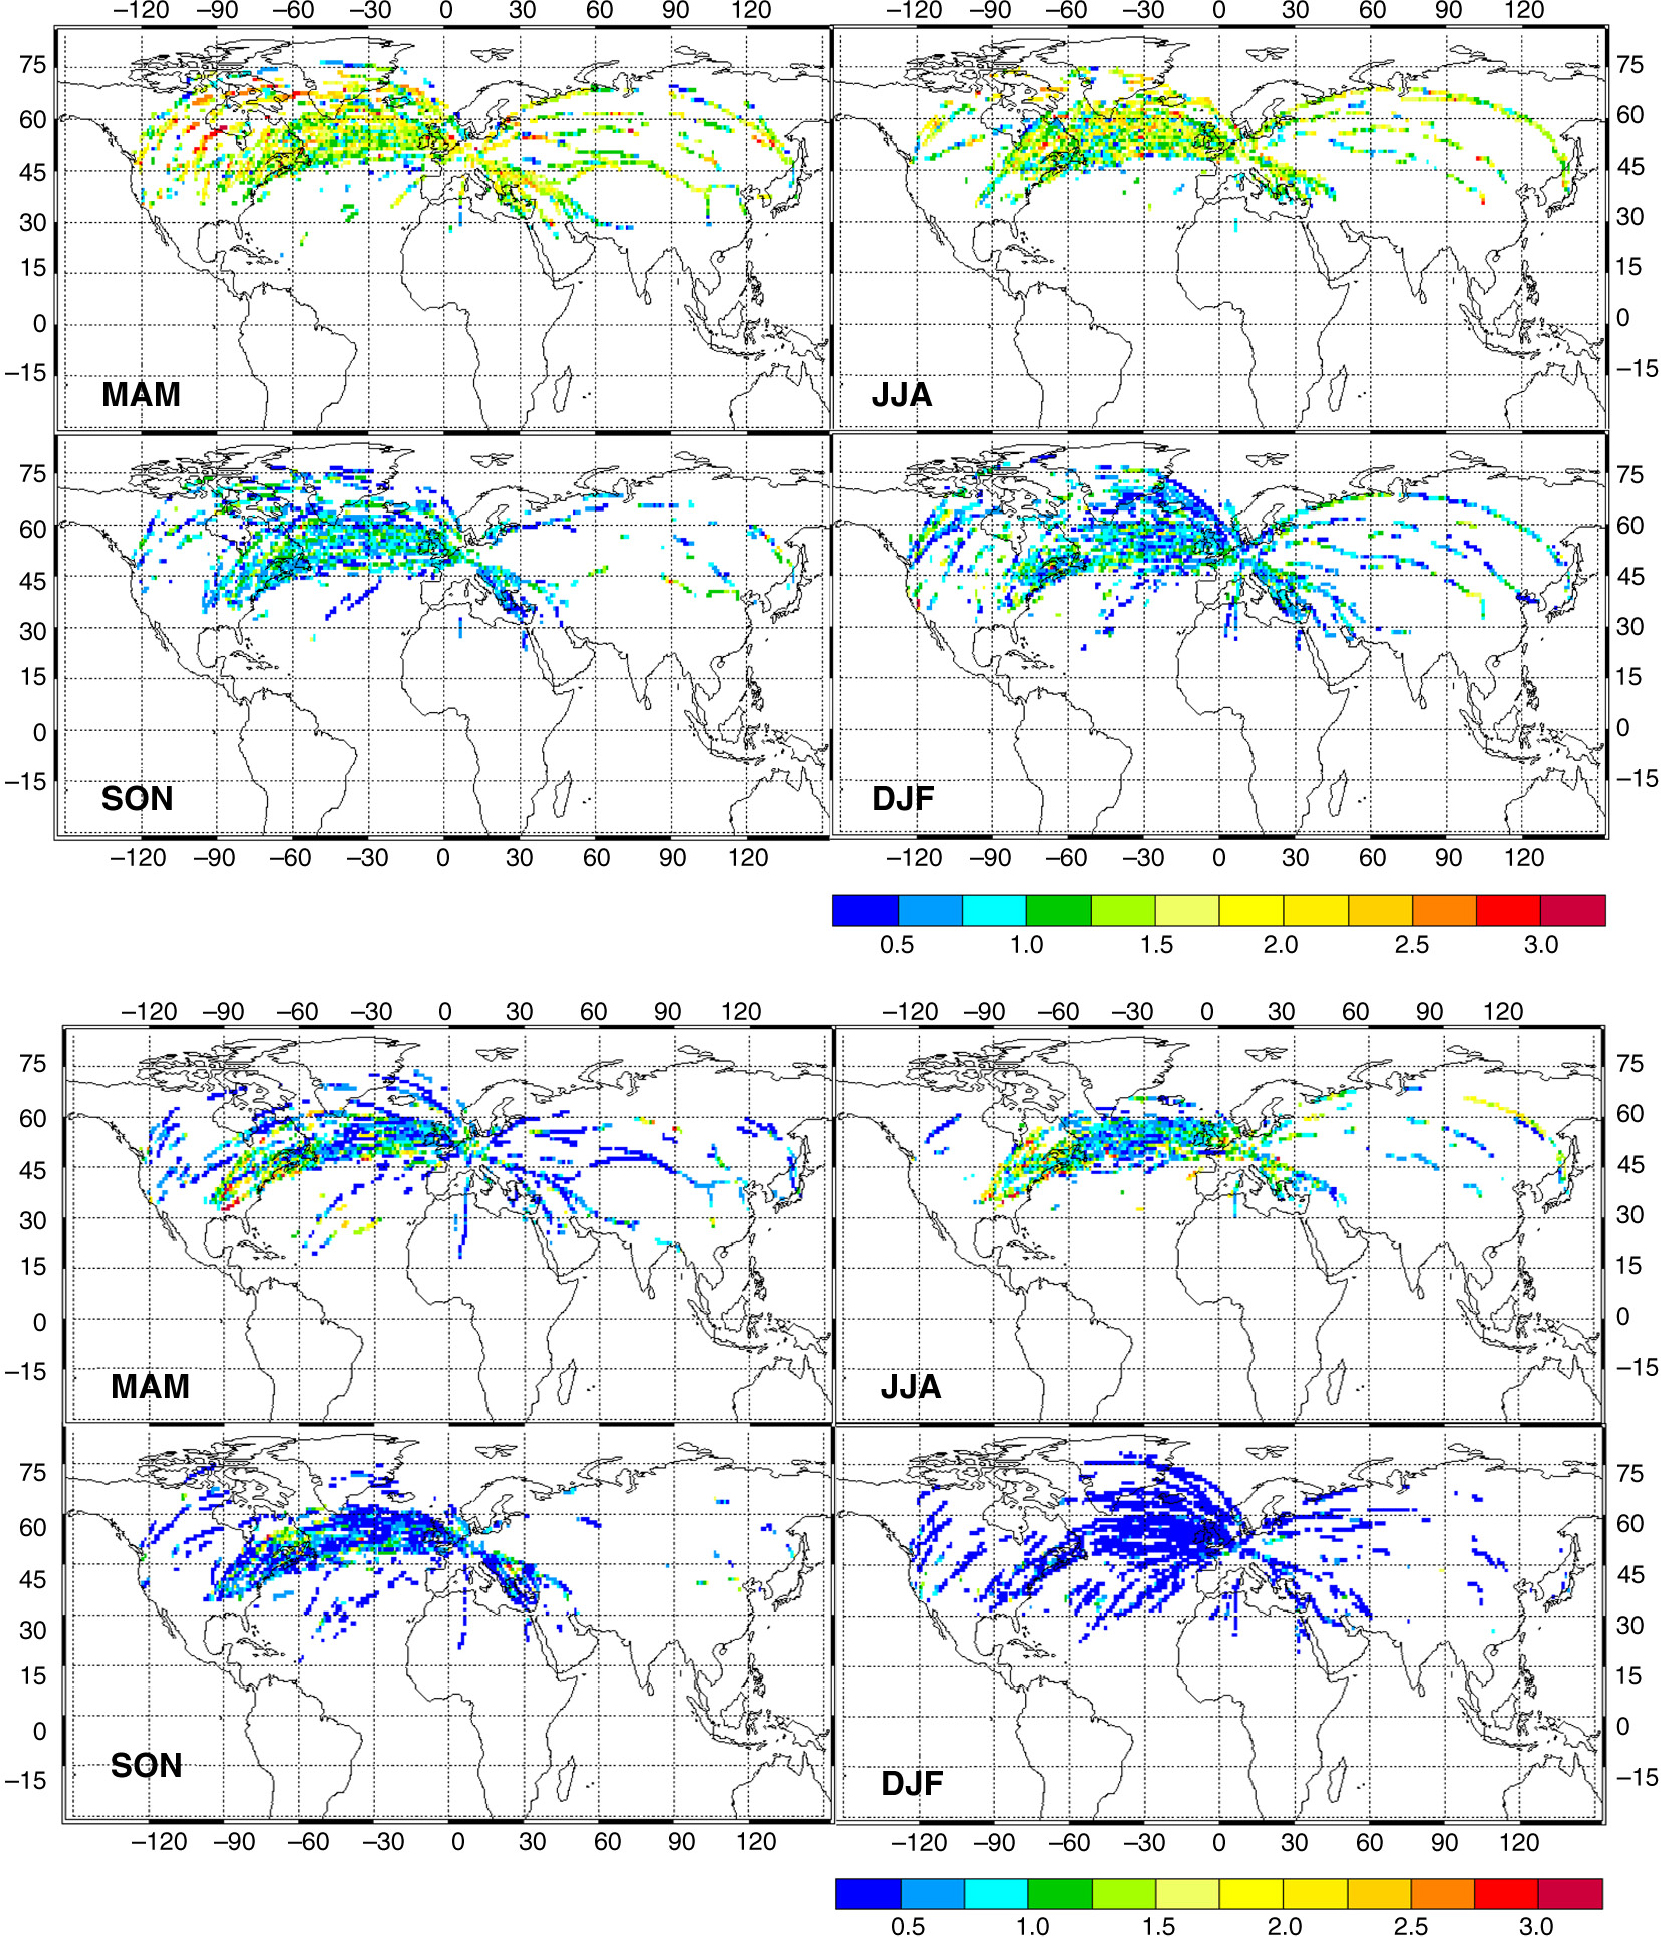
Fig. 8
Mean mixing ratios of NOy for the four seasons (MAM, JJA, SON, DJF) in the vertical layers LS1 (upper panel) and UT (lower panel). Each data point represents a 1°×1° average. The colour code denotes the NOy mixing ratio in ppb.
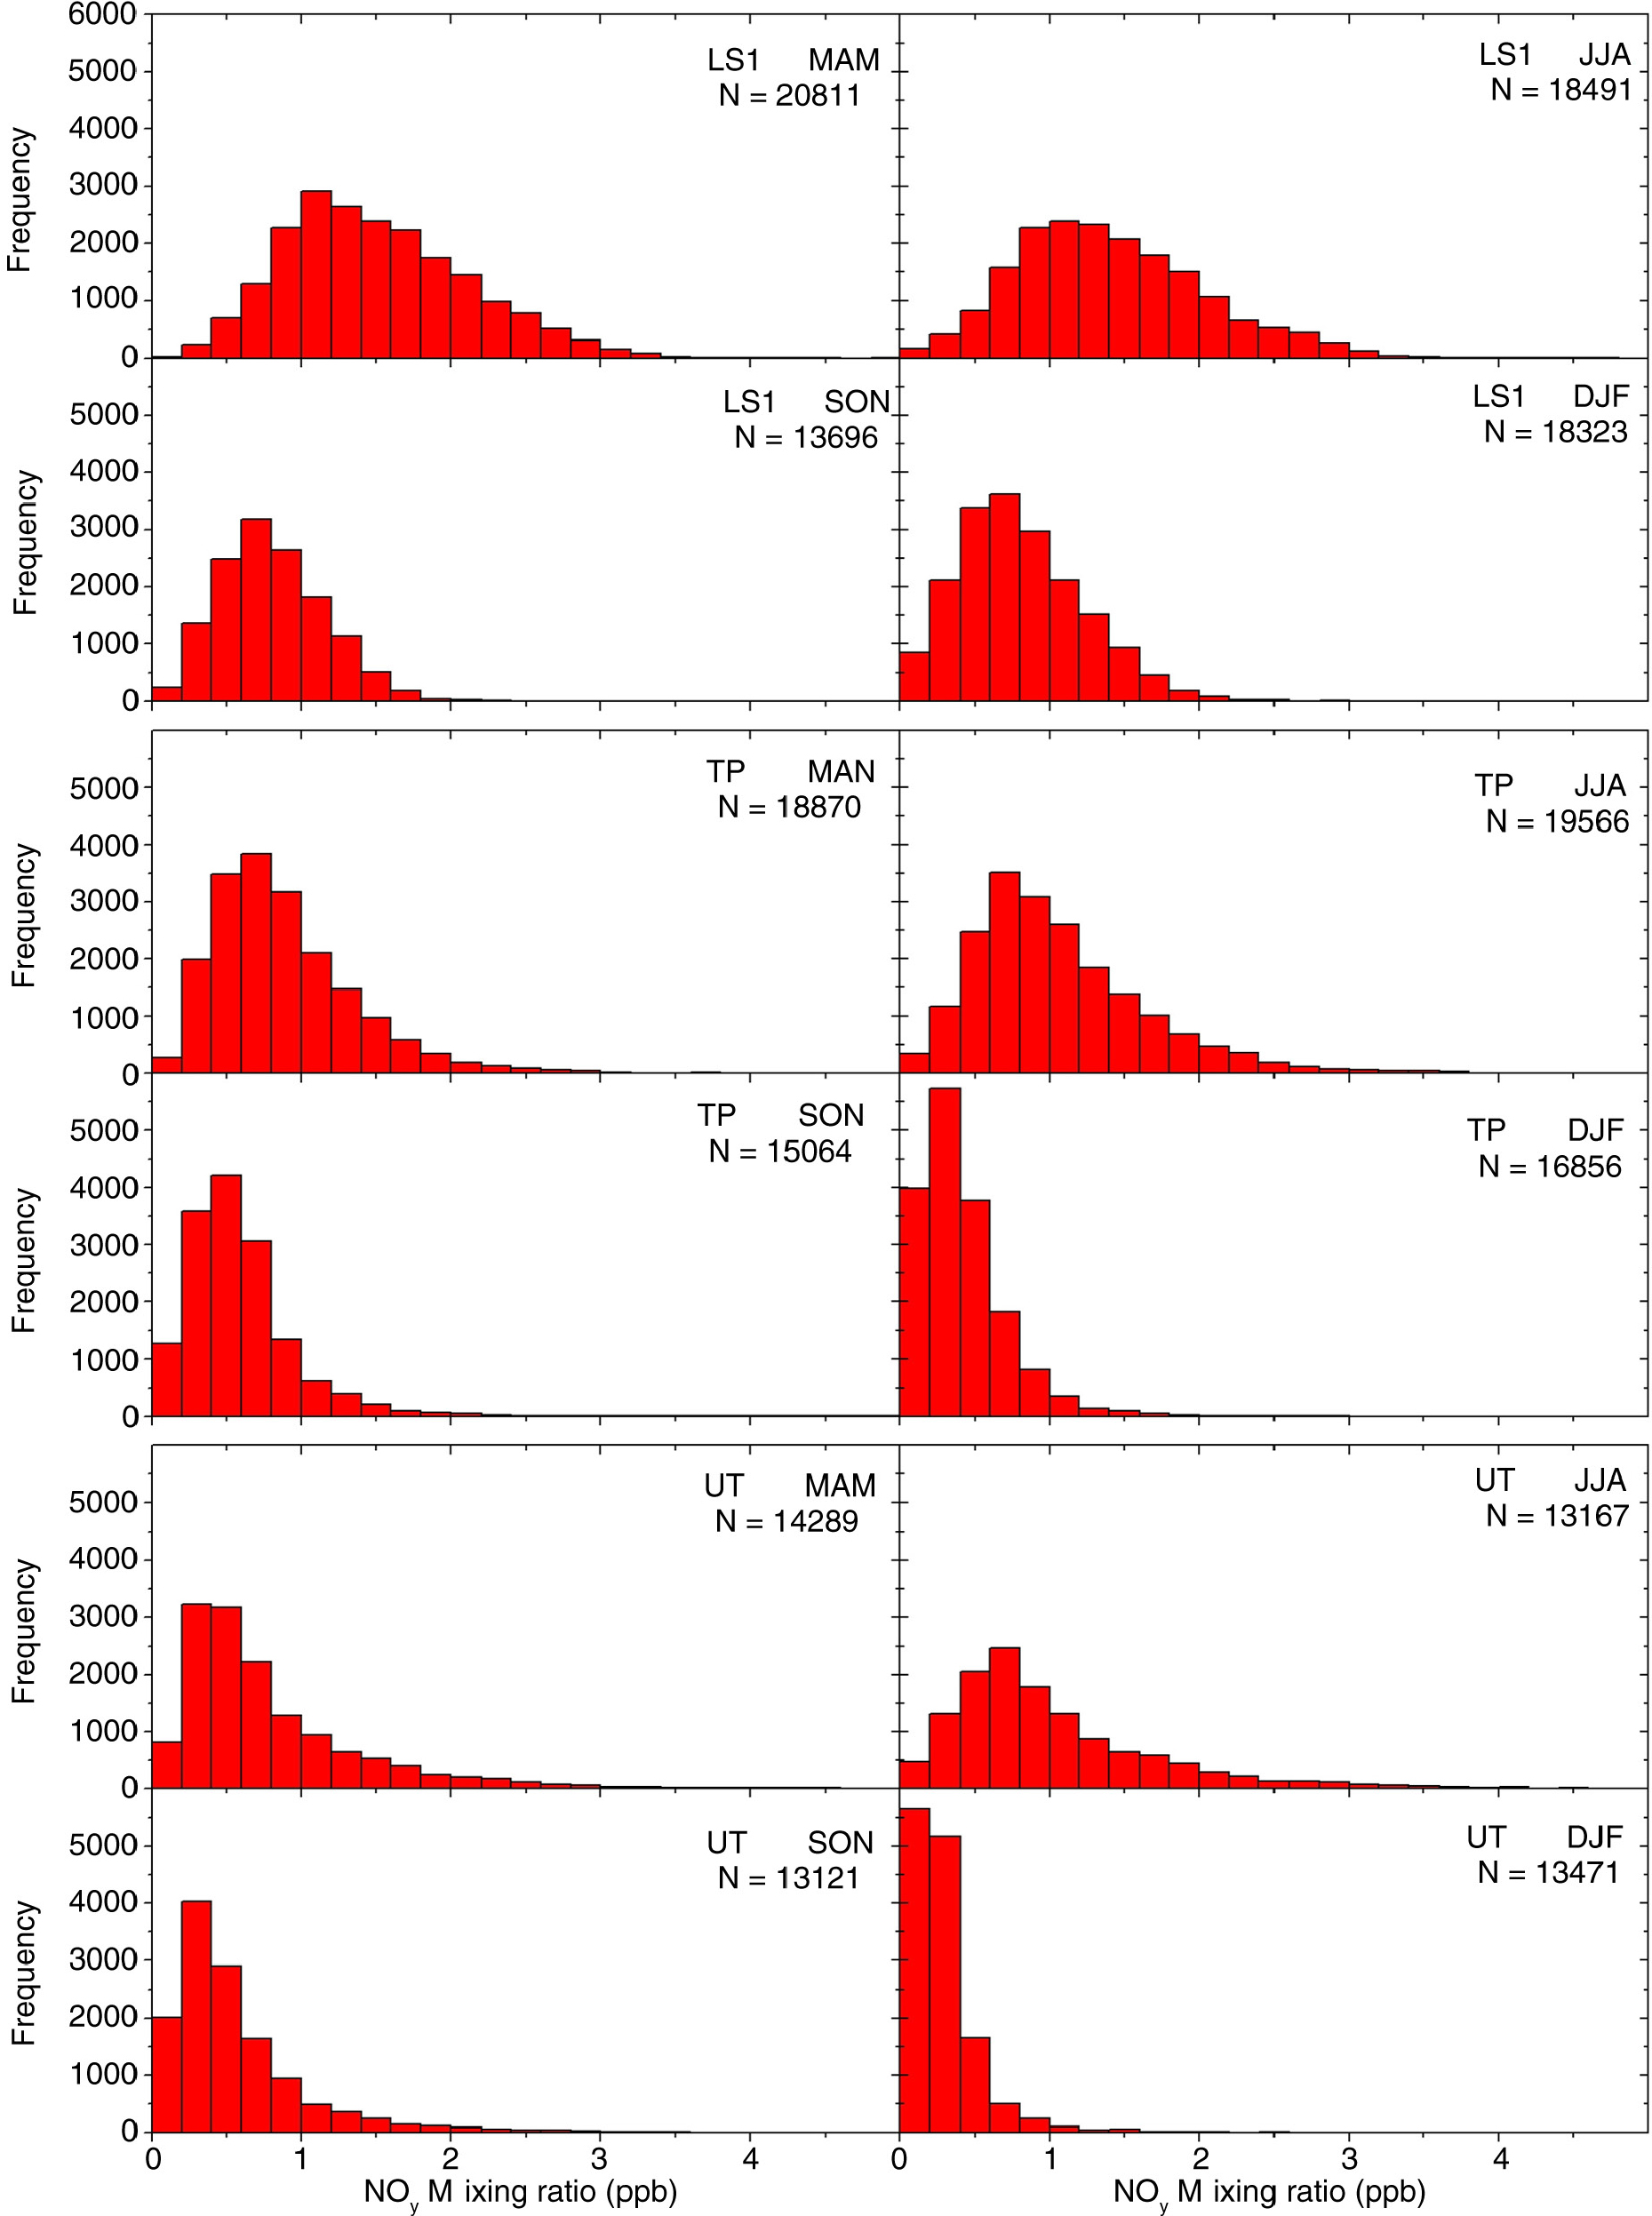
Fig. 9
Frequency distribution of the mean mixing ratio of NOy for the layers UT, TP, and LS1 and for each season (all data without geographical selection). The parameters of the distributions are listed in Supplementary Table A3.
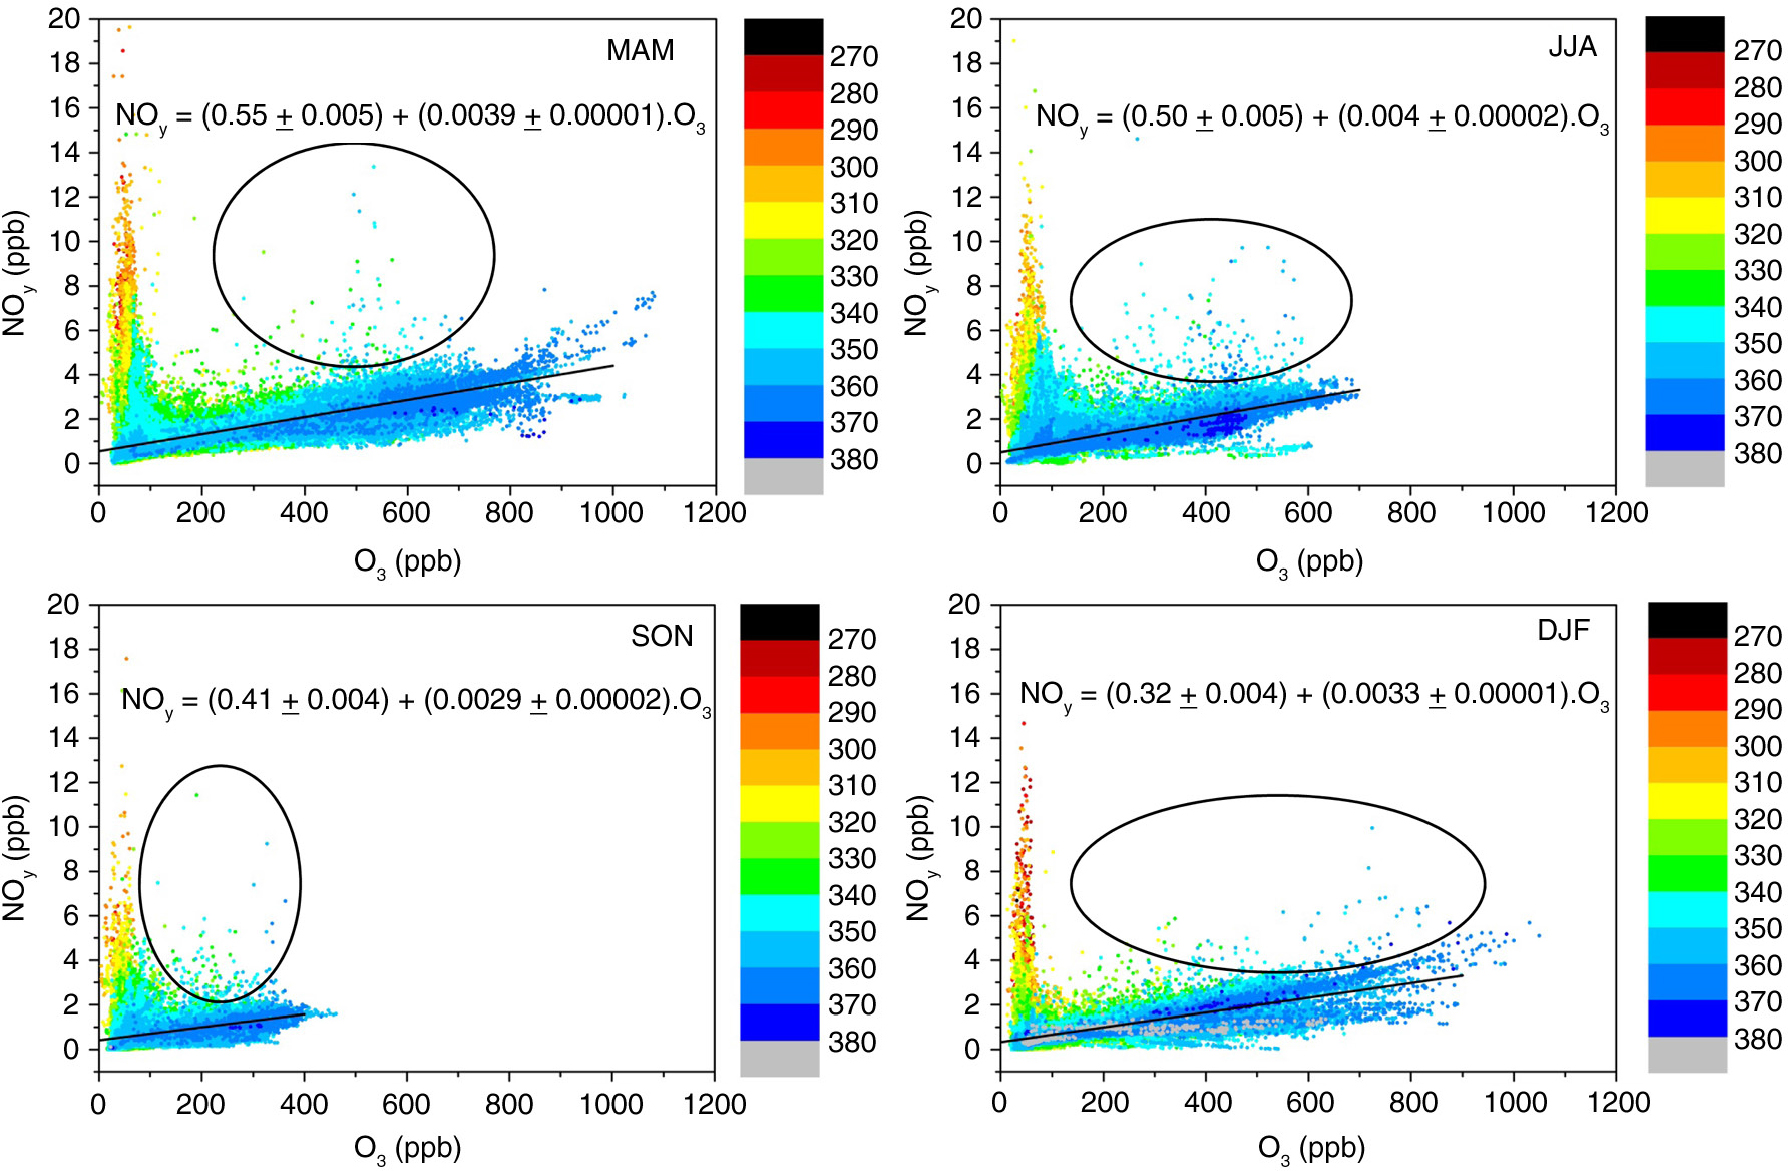
Fig. 10
Scatter plots of the NOy mixing ratios against O3 for the four seasons. The colour of the data points gives the concurrent potential temperature in K. The solid lines are linear fits to all data collected in the lower stratosphere (LS see definition above). The ellipses indicate individual data points with enhanced NOy concentrations in the LS.