
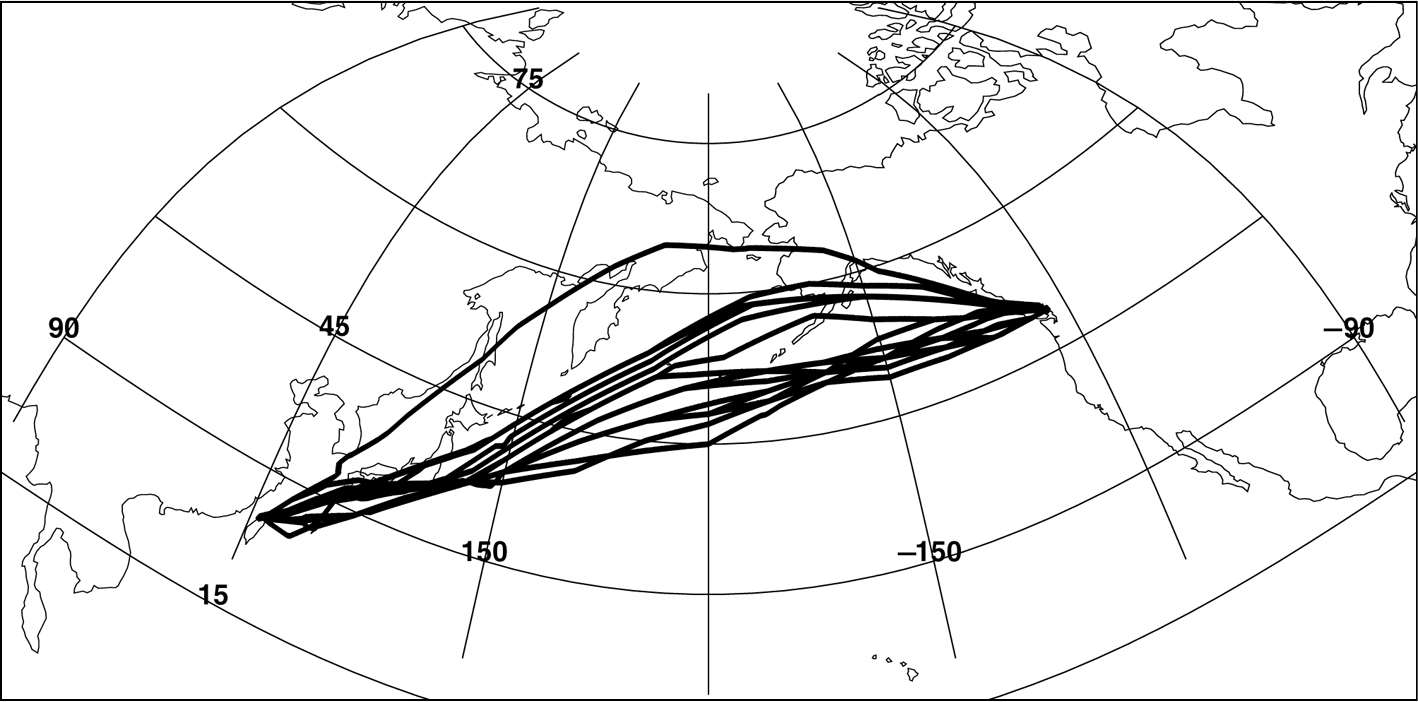
Fig. 1
Aircraft trajectories during July and August 2012.
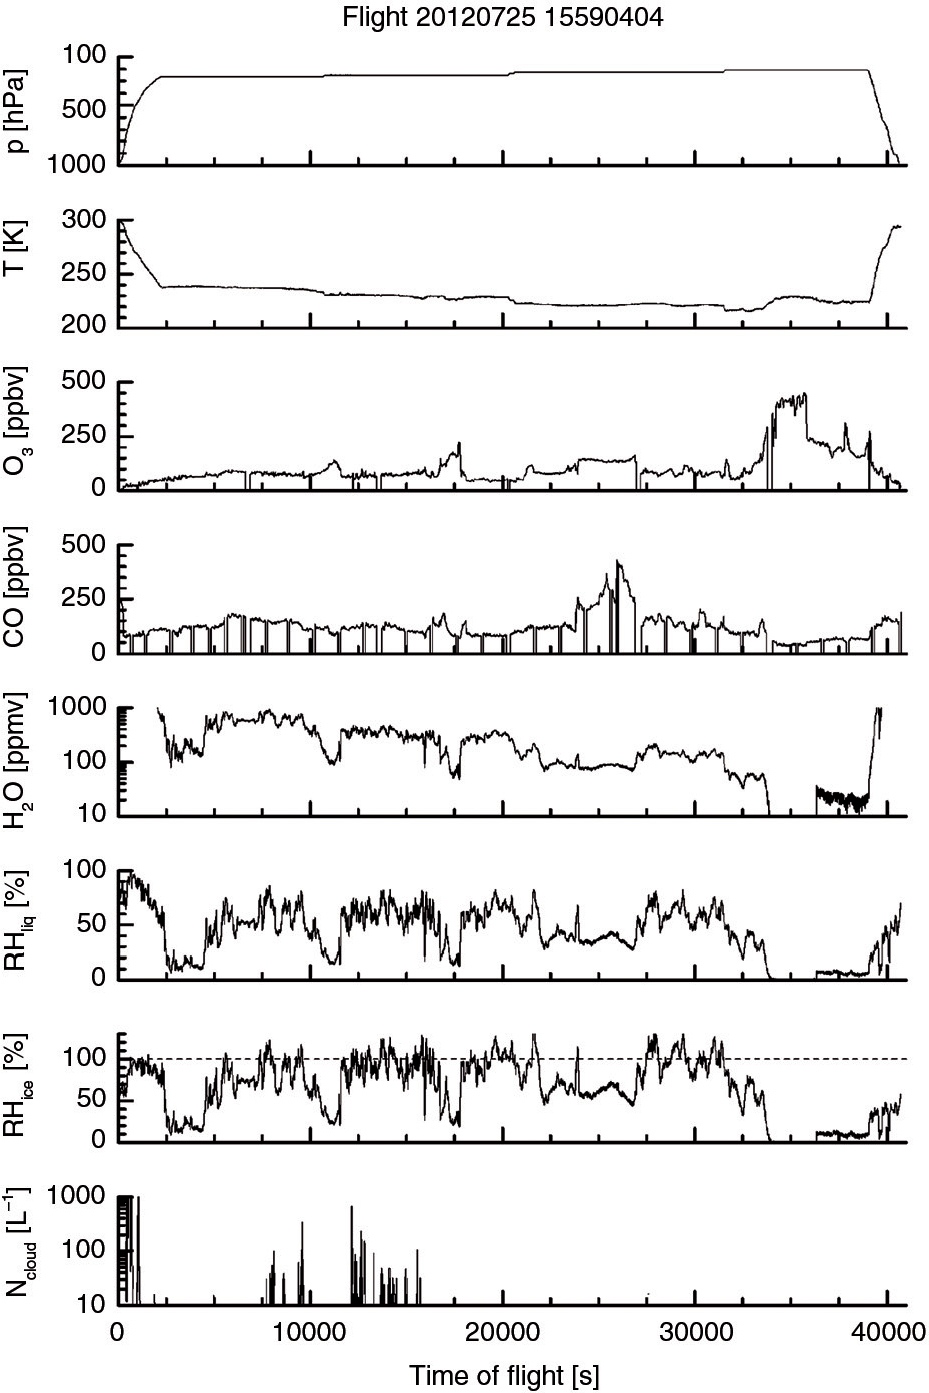
Fig. 2
The suite of measurements available from IAGOS for the flight 20120725 from Taipei to Vancouver.
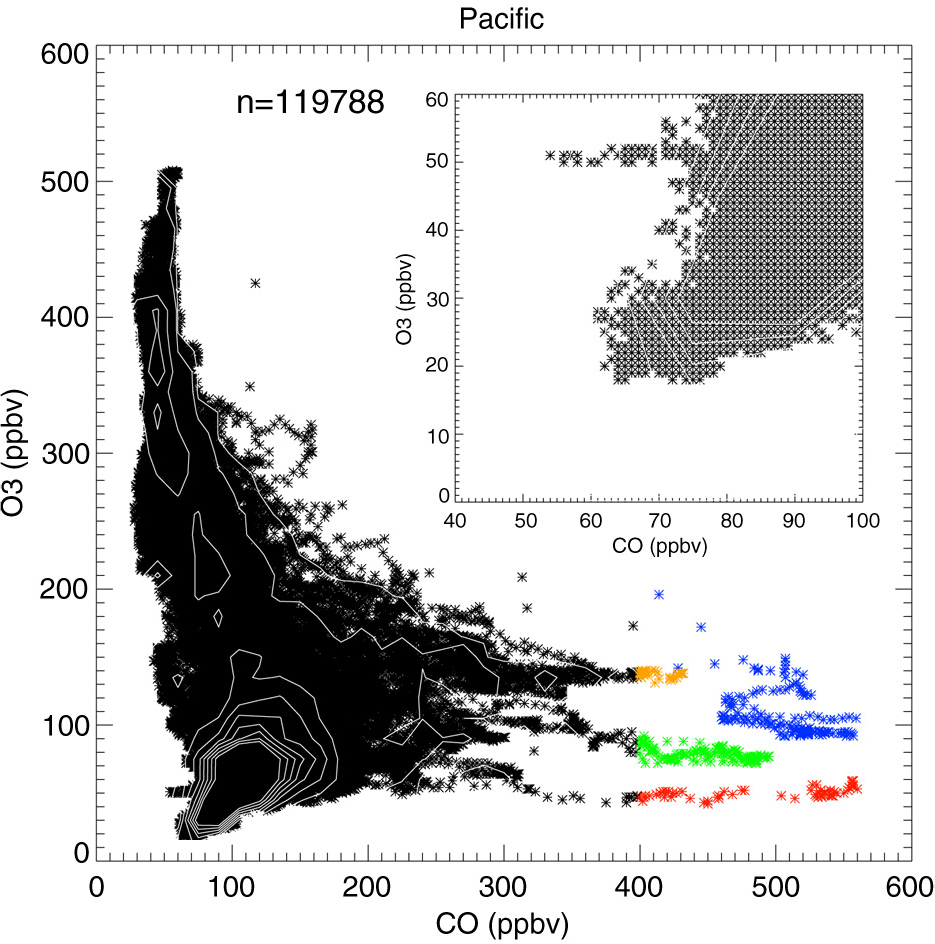
Fig. 3
CO–O3 scatter-plot based on all trans-Pacific flights in July and August 2012 at cruise altitudes between 274 and 196 hPa. Inset zoom shows the very low ozone mixing ratios observed. Also highlighted are several flights where very high CO mixing ratios were observed: 20120703: blue, 20120705: green, 20120725: orange, 20120808: red. The total number of flights is 28. The contours from the pdf distribution shown in Fig. 7 are also overlain in white.
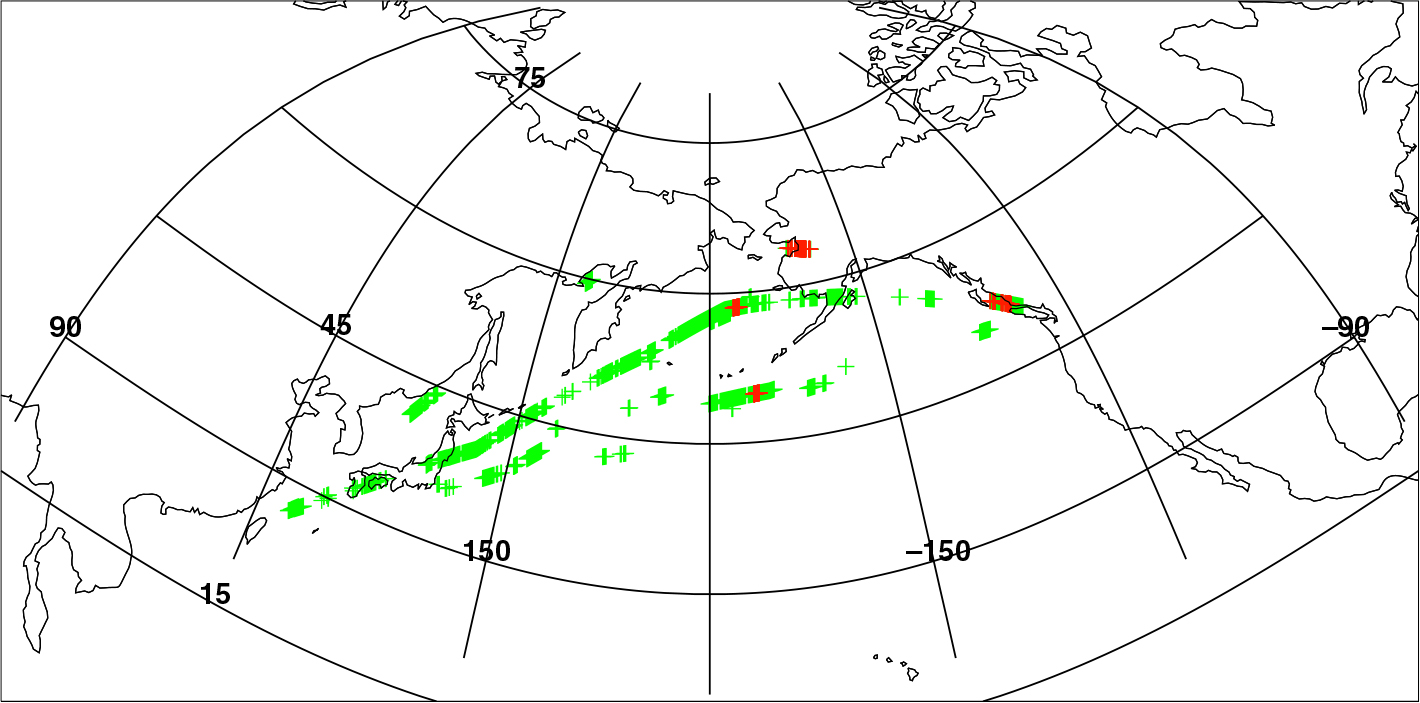
Fig. 4
Location of CO mixing ratios >200 ppbv shown by green crosses and CO >400 ppbv shown by red crosses.
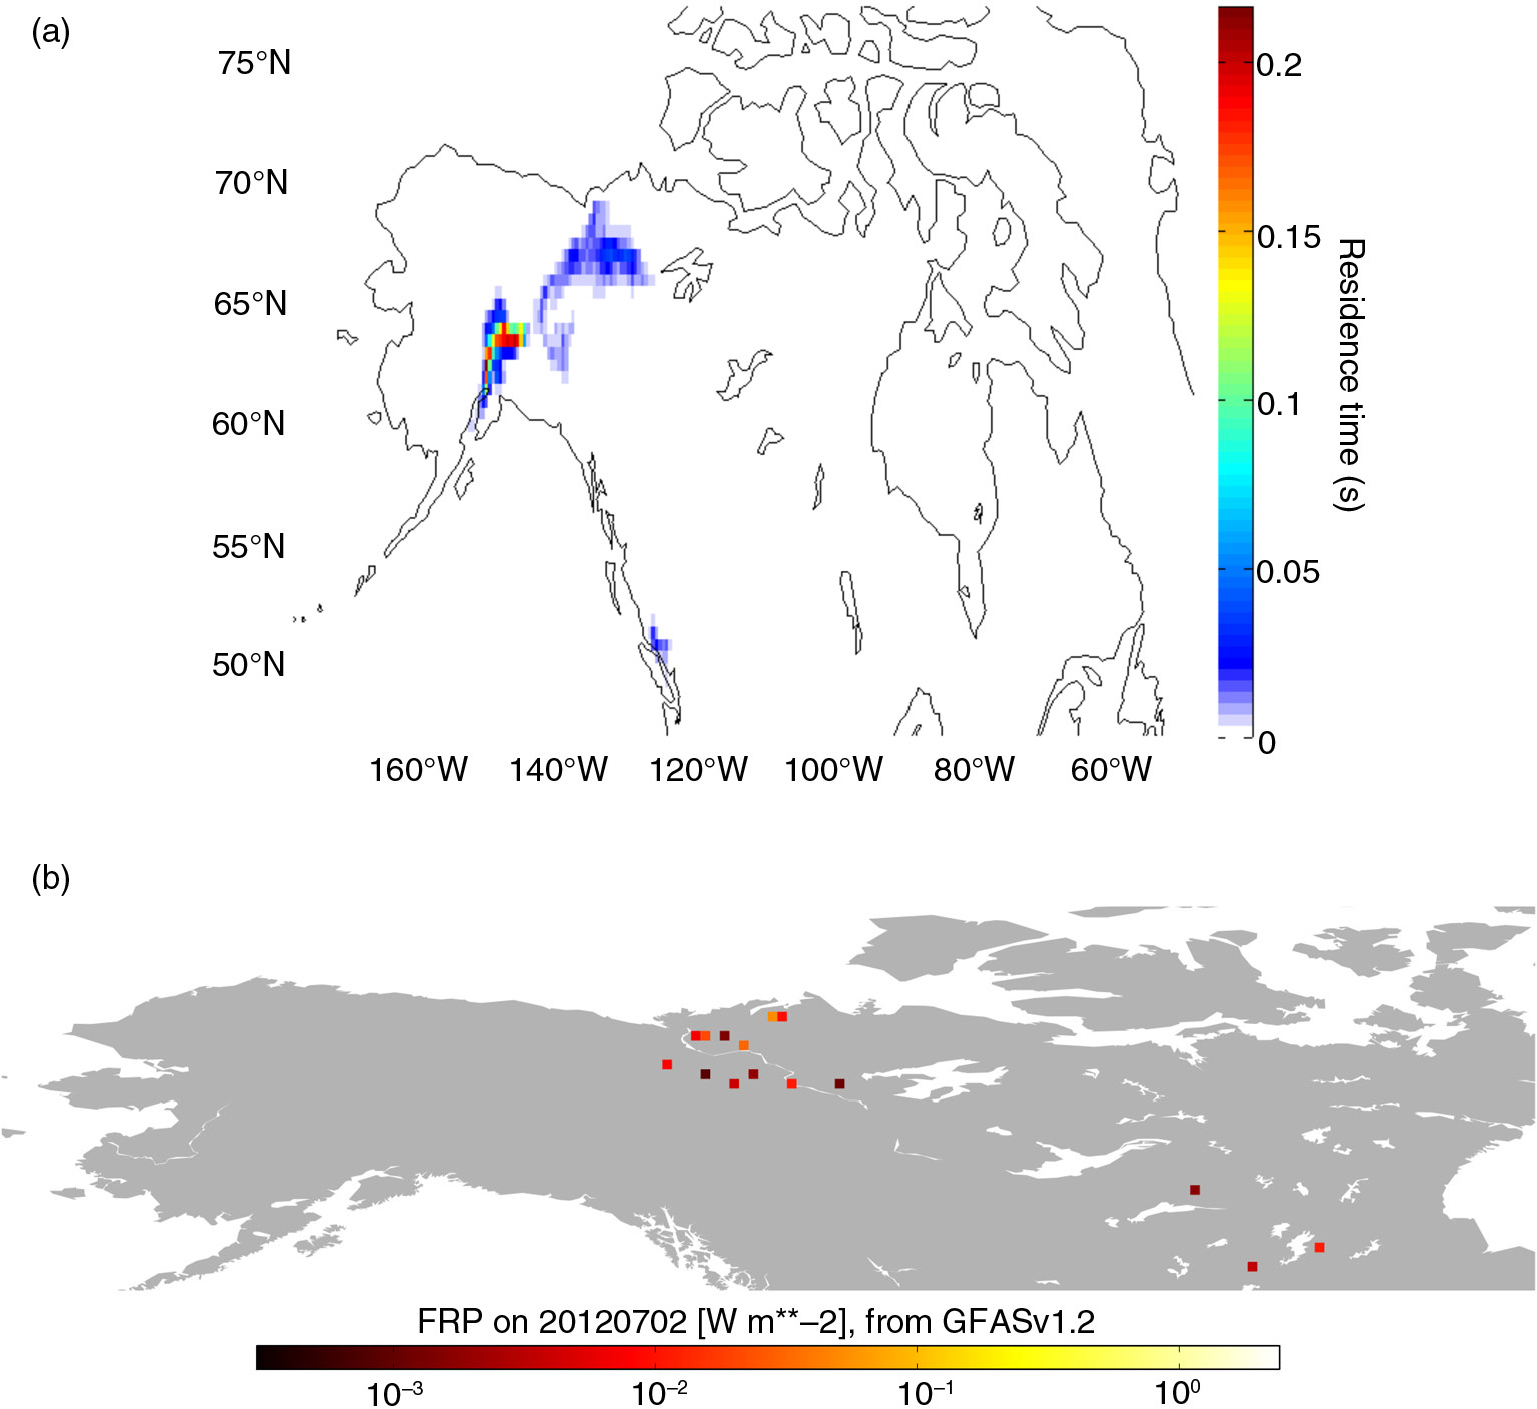
Fig. 5
Residence times from a FLEXPART simulation integrated until the trajectories reached ground level, 3 d prior to the observed anomaly of high CO. Residence times show the likely origin of the high CO mixing ratios observed at (a) 51 N, 130 W on 5 July 2012 (green in Fig. 3) and (b) fire radiative power as derived from MODIS showing the locations of active burning on 2 July 2012.
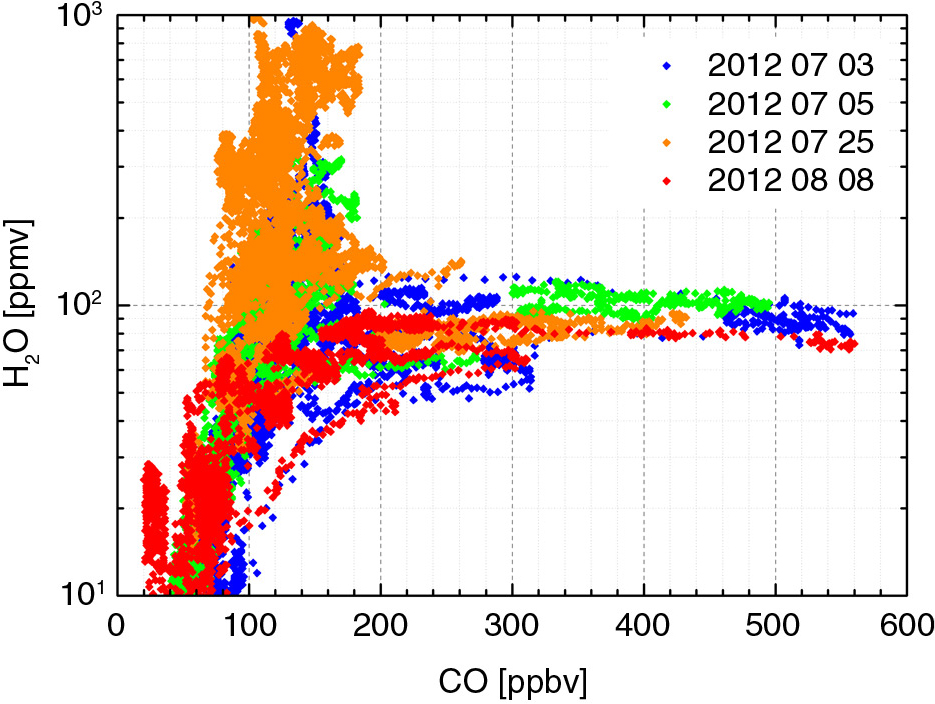
Fig. 6
Scatter-plot for flights with high CO mixing ratio, with colours representing the date of the flight.
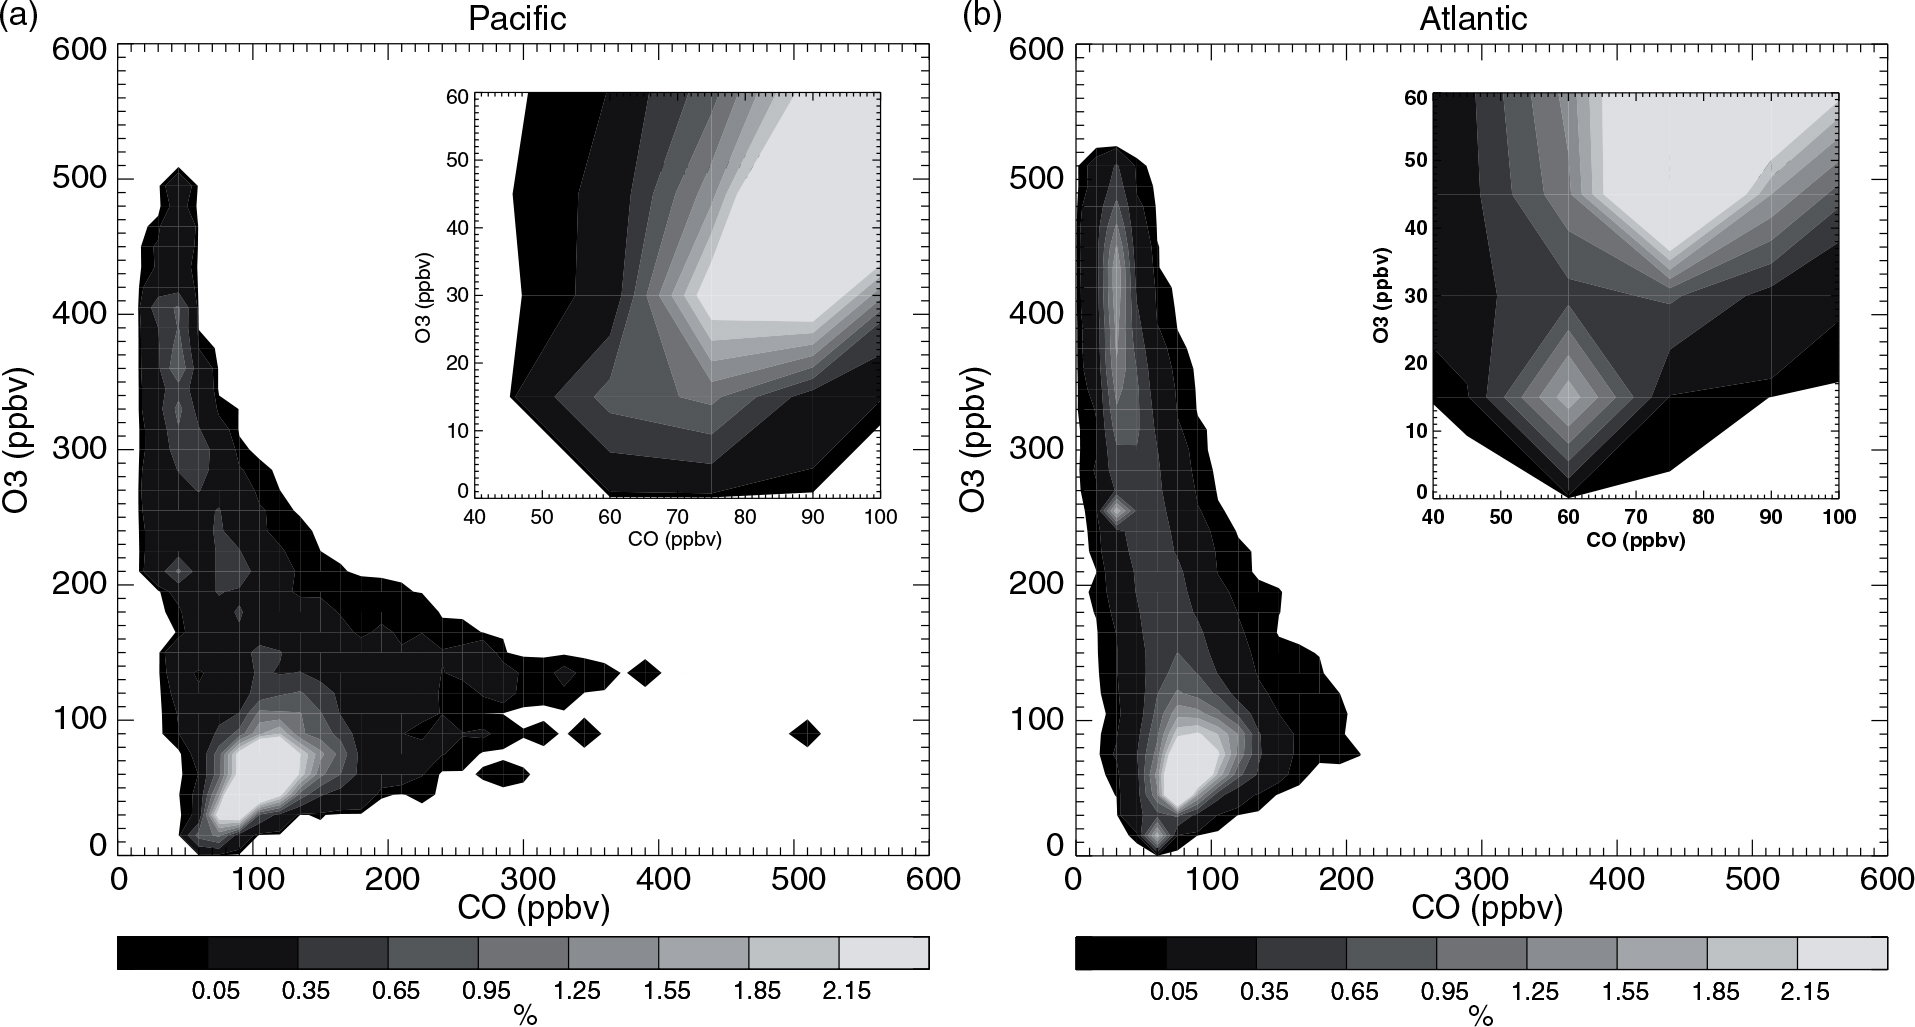
Fig. 7
Probability density function based on all trans-Pacific flights in July and August 2012 and all trans-Atlantic flights from July to August 2002–2009 at cruise altitudes between 274 and 196 hPa.
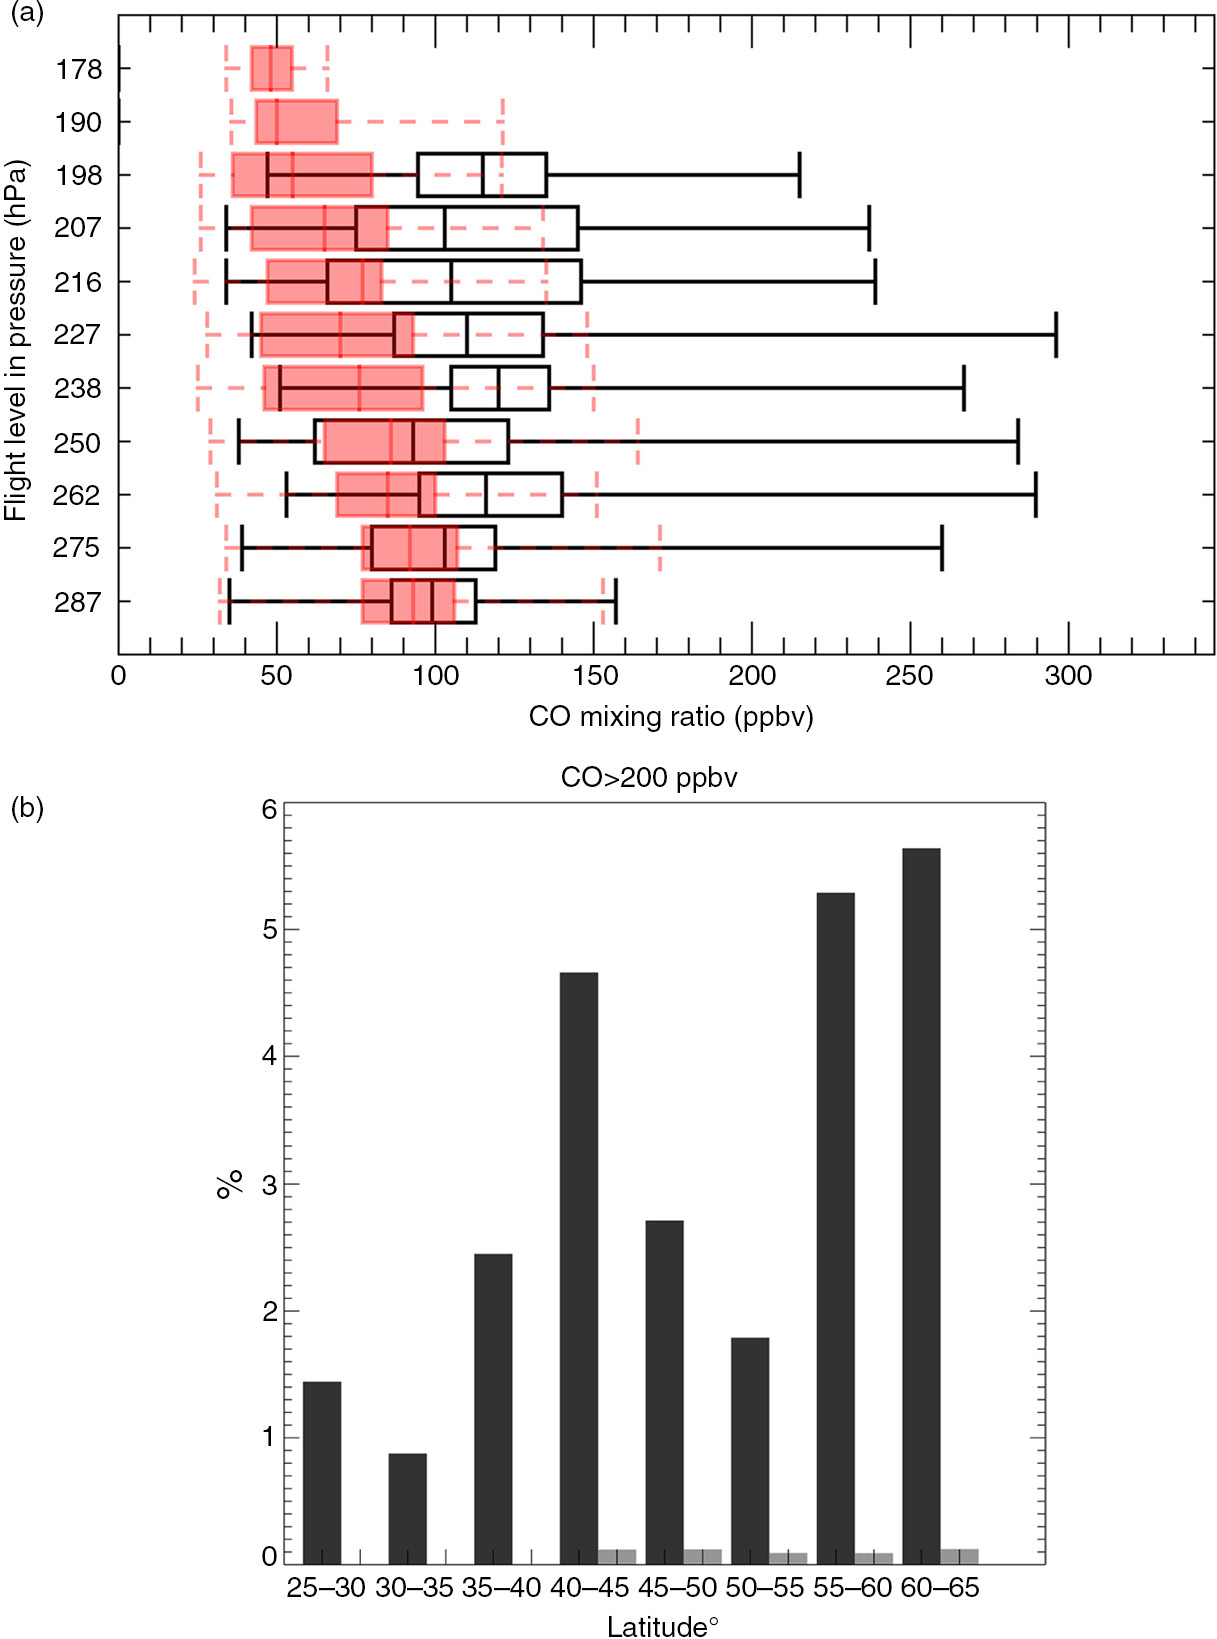
Fig. 8
(a) CO measured on flight-levels in hPa over the Pacific during July and August 2012 (black lines) and over the Atlantic (red) for July–August 2002–2009. The boxes represent the lower quartile, median, and upper quartile and the whiskers extend to the 1st to 99th percentiles. (b) The percentage of measurements with CO greater than 200 ppbv over the Pacific (black) in July–August 2012 and the Atlantic (grey) July–August 2002–2009.
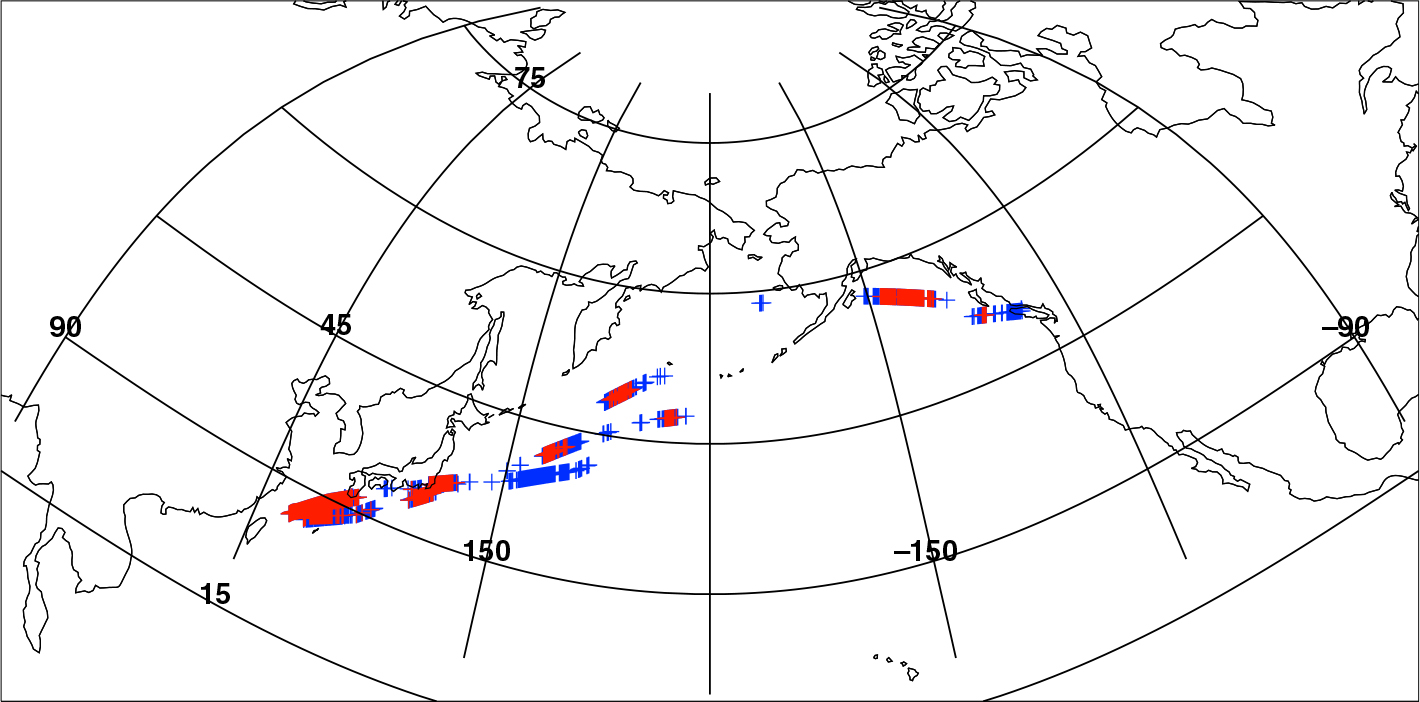
Fig. 9
Location of O3 mixing ratios <30 ppbv shown by blue crosses and O3 <25 ppbv shown by red crosses.
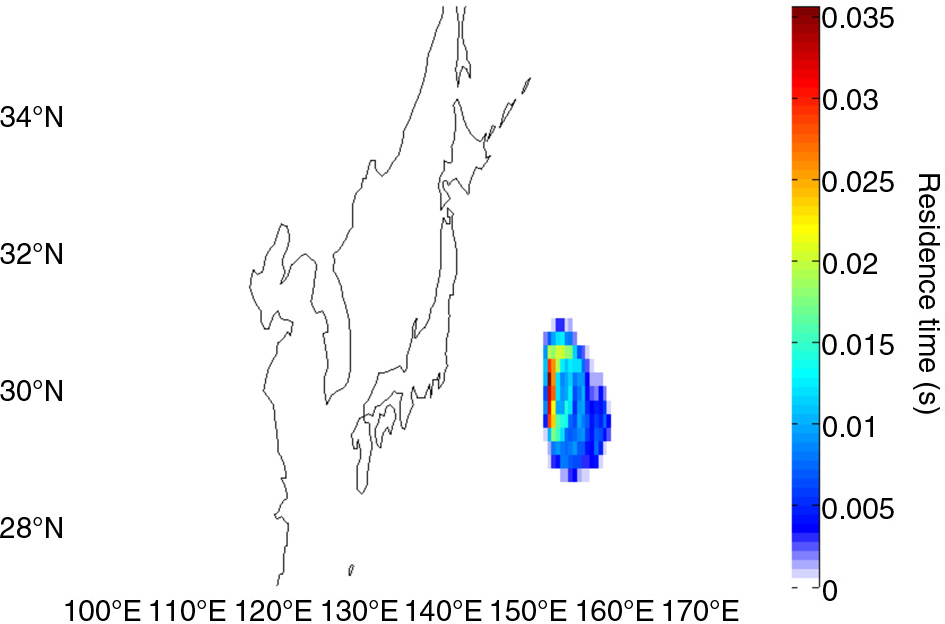
Fig. 10
Residence times from a FLEXPART simulation integrated until the trajectories reached ground level, 4 d prior to the observed anomaly of low ozone. Residence times show the likely origin of low ozone mixing ratios O3<25 ppbv (in red in Fig. 9) observed at (a) 49.5°N, 165°E on 11 August 2012.
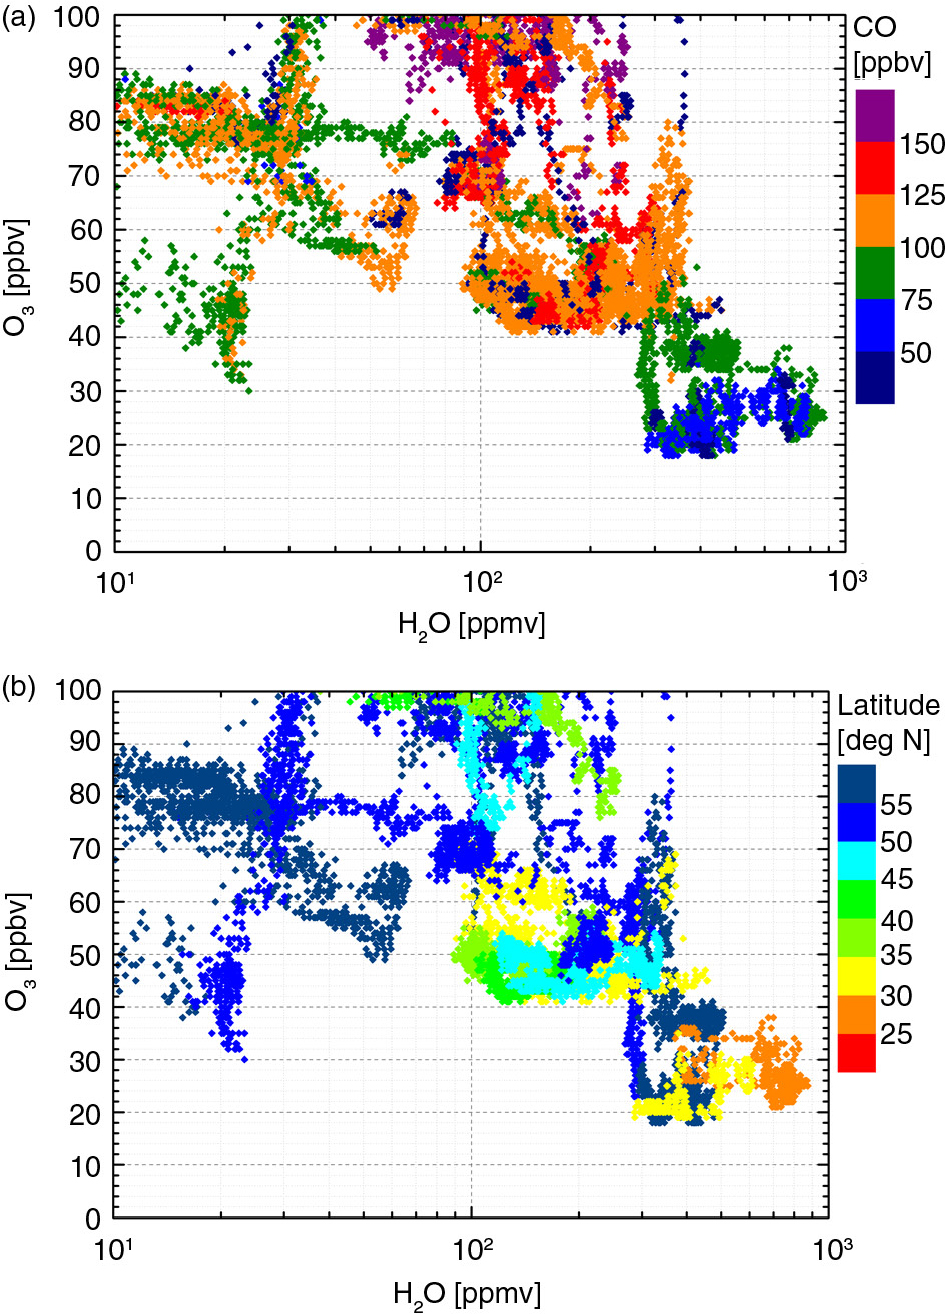
Fig. 11
Scatter-plots for flights with low ozone mixing ratio: (a) colours represent the corresponding mixing ratio of CO, and (b) colours represent the latitude of observation.
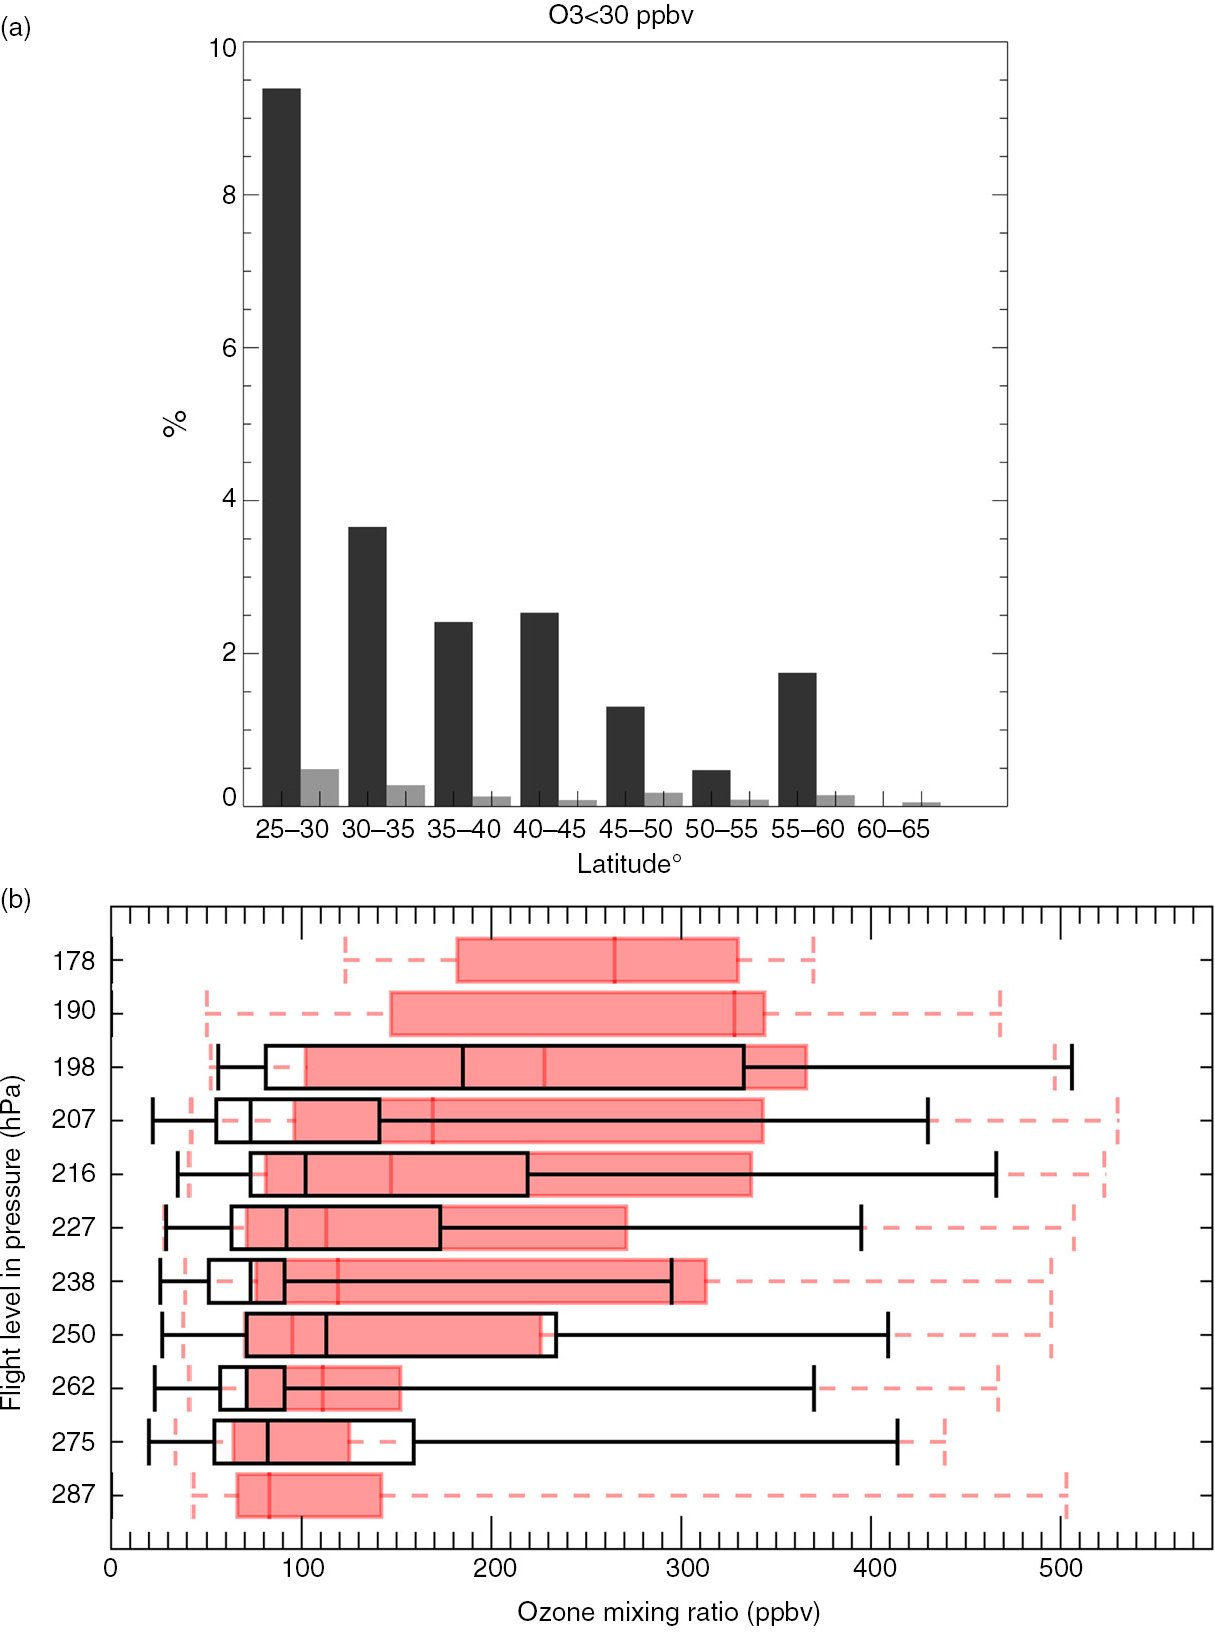
Fig. 12
(a) Histogram showing the percentage of measurements with ozone less than 30 ppbv over the Pacific (black) in July–August 2012 and the Atlantic (grey) July–August 2002–2009. (b) Ozone measured on flight-levels in hPa over the Pacific during July and August 2012 (black lines) and over the Atlantic (red) for July–August 2002–2009. The boxes represent the lower quartile, median, and upper quartile and the whiskers extend to the 1st to 99th percentiles.
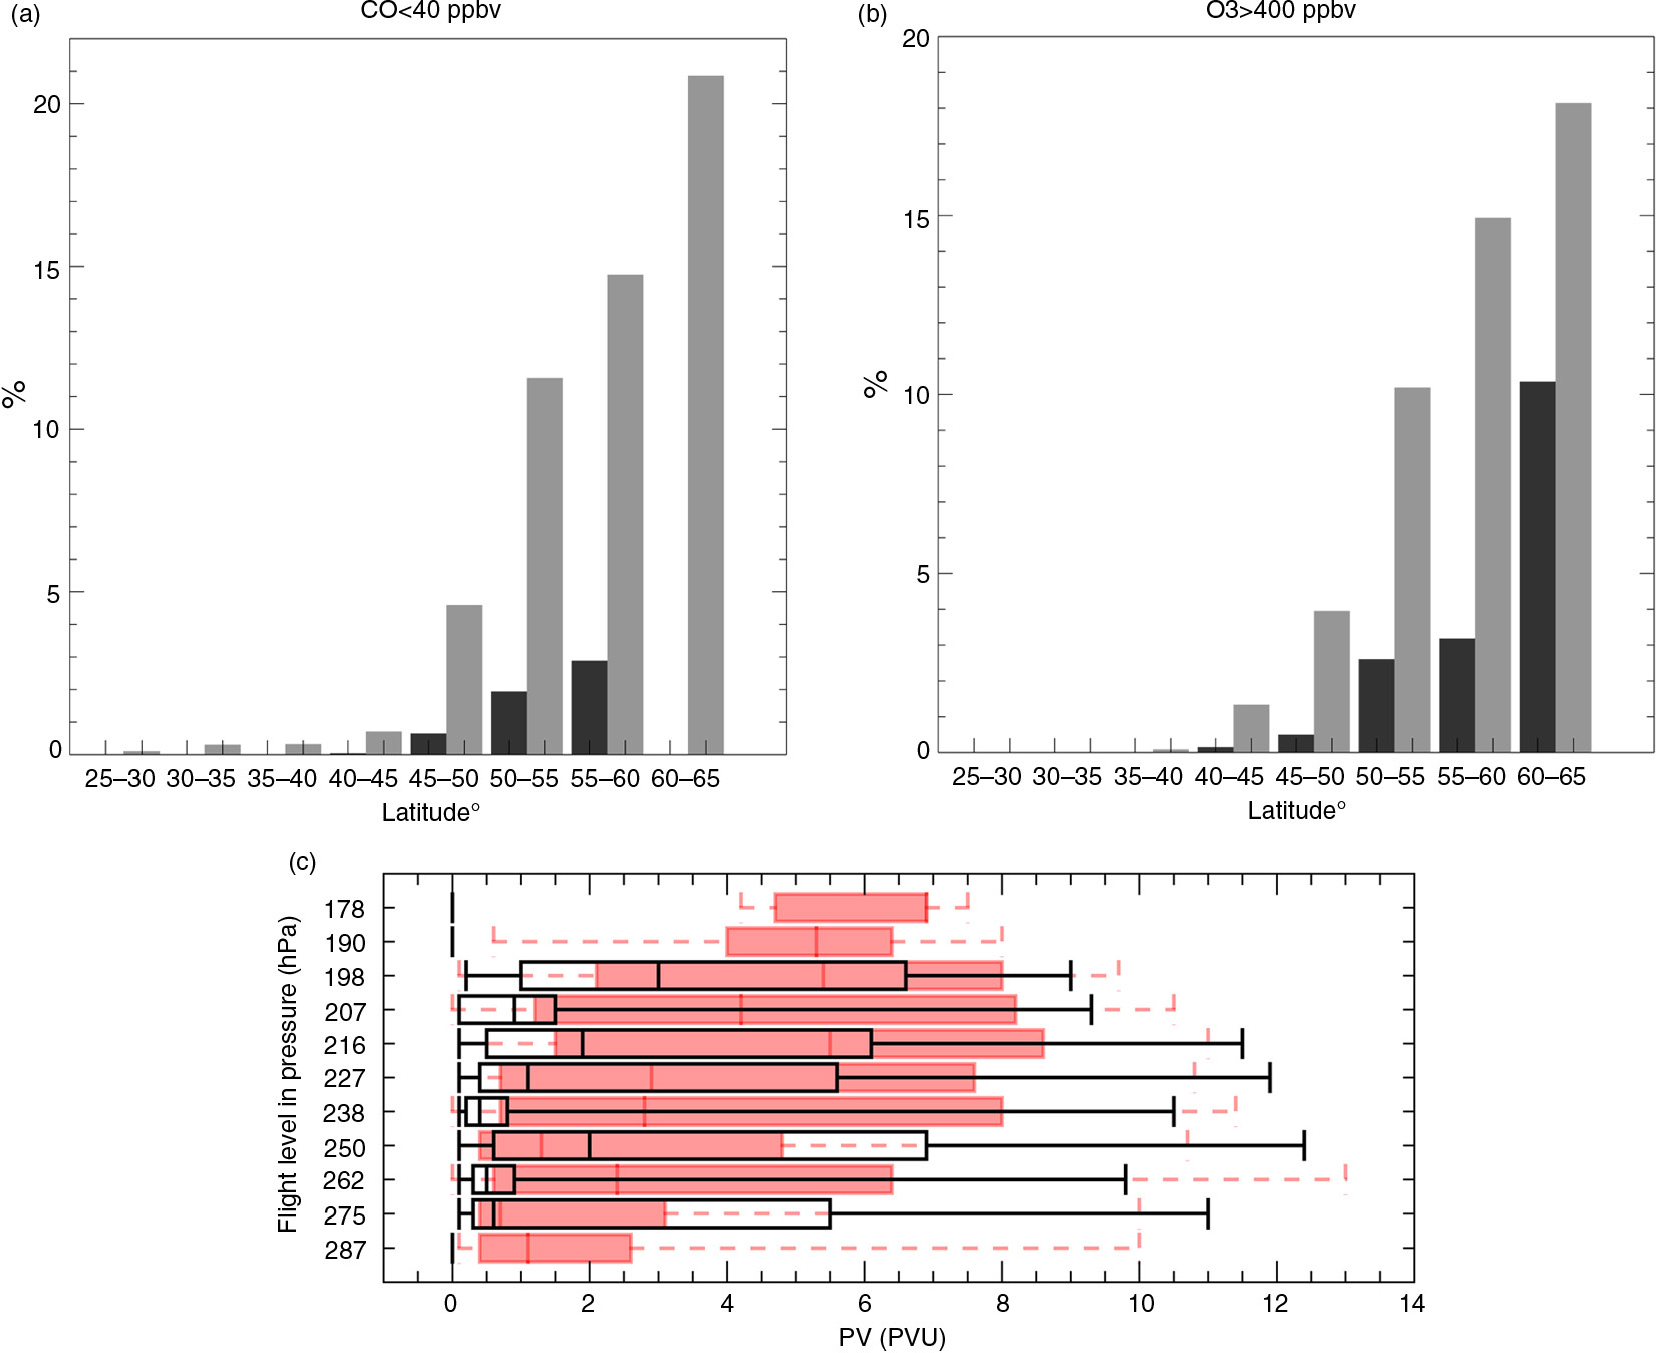
Fig. 13
Histogram showing the percentage of measurements with (a) CO less than 40 ppbv; (b) ozone greater than 400 ppbv in each latitude bin for the Pacific in July and August 2012 (black) and the Atlantic for July and August 2002–2009 (grey), (c) potential vorticity (PVU: 1PVU = 10−6 m2 s−1 Kkg−1) calculated for each measurement on flight-levels in hPa over the Pacific during July and August 2012 (black lines) and over the Atlantic (red) for July–August 2002–2009. The boxes represent the lower quartile, median, and upper quartile and the whiskers extend to the 1st to 99th percentiles.