
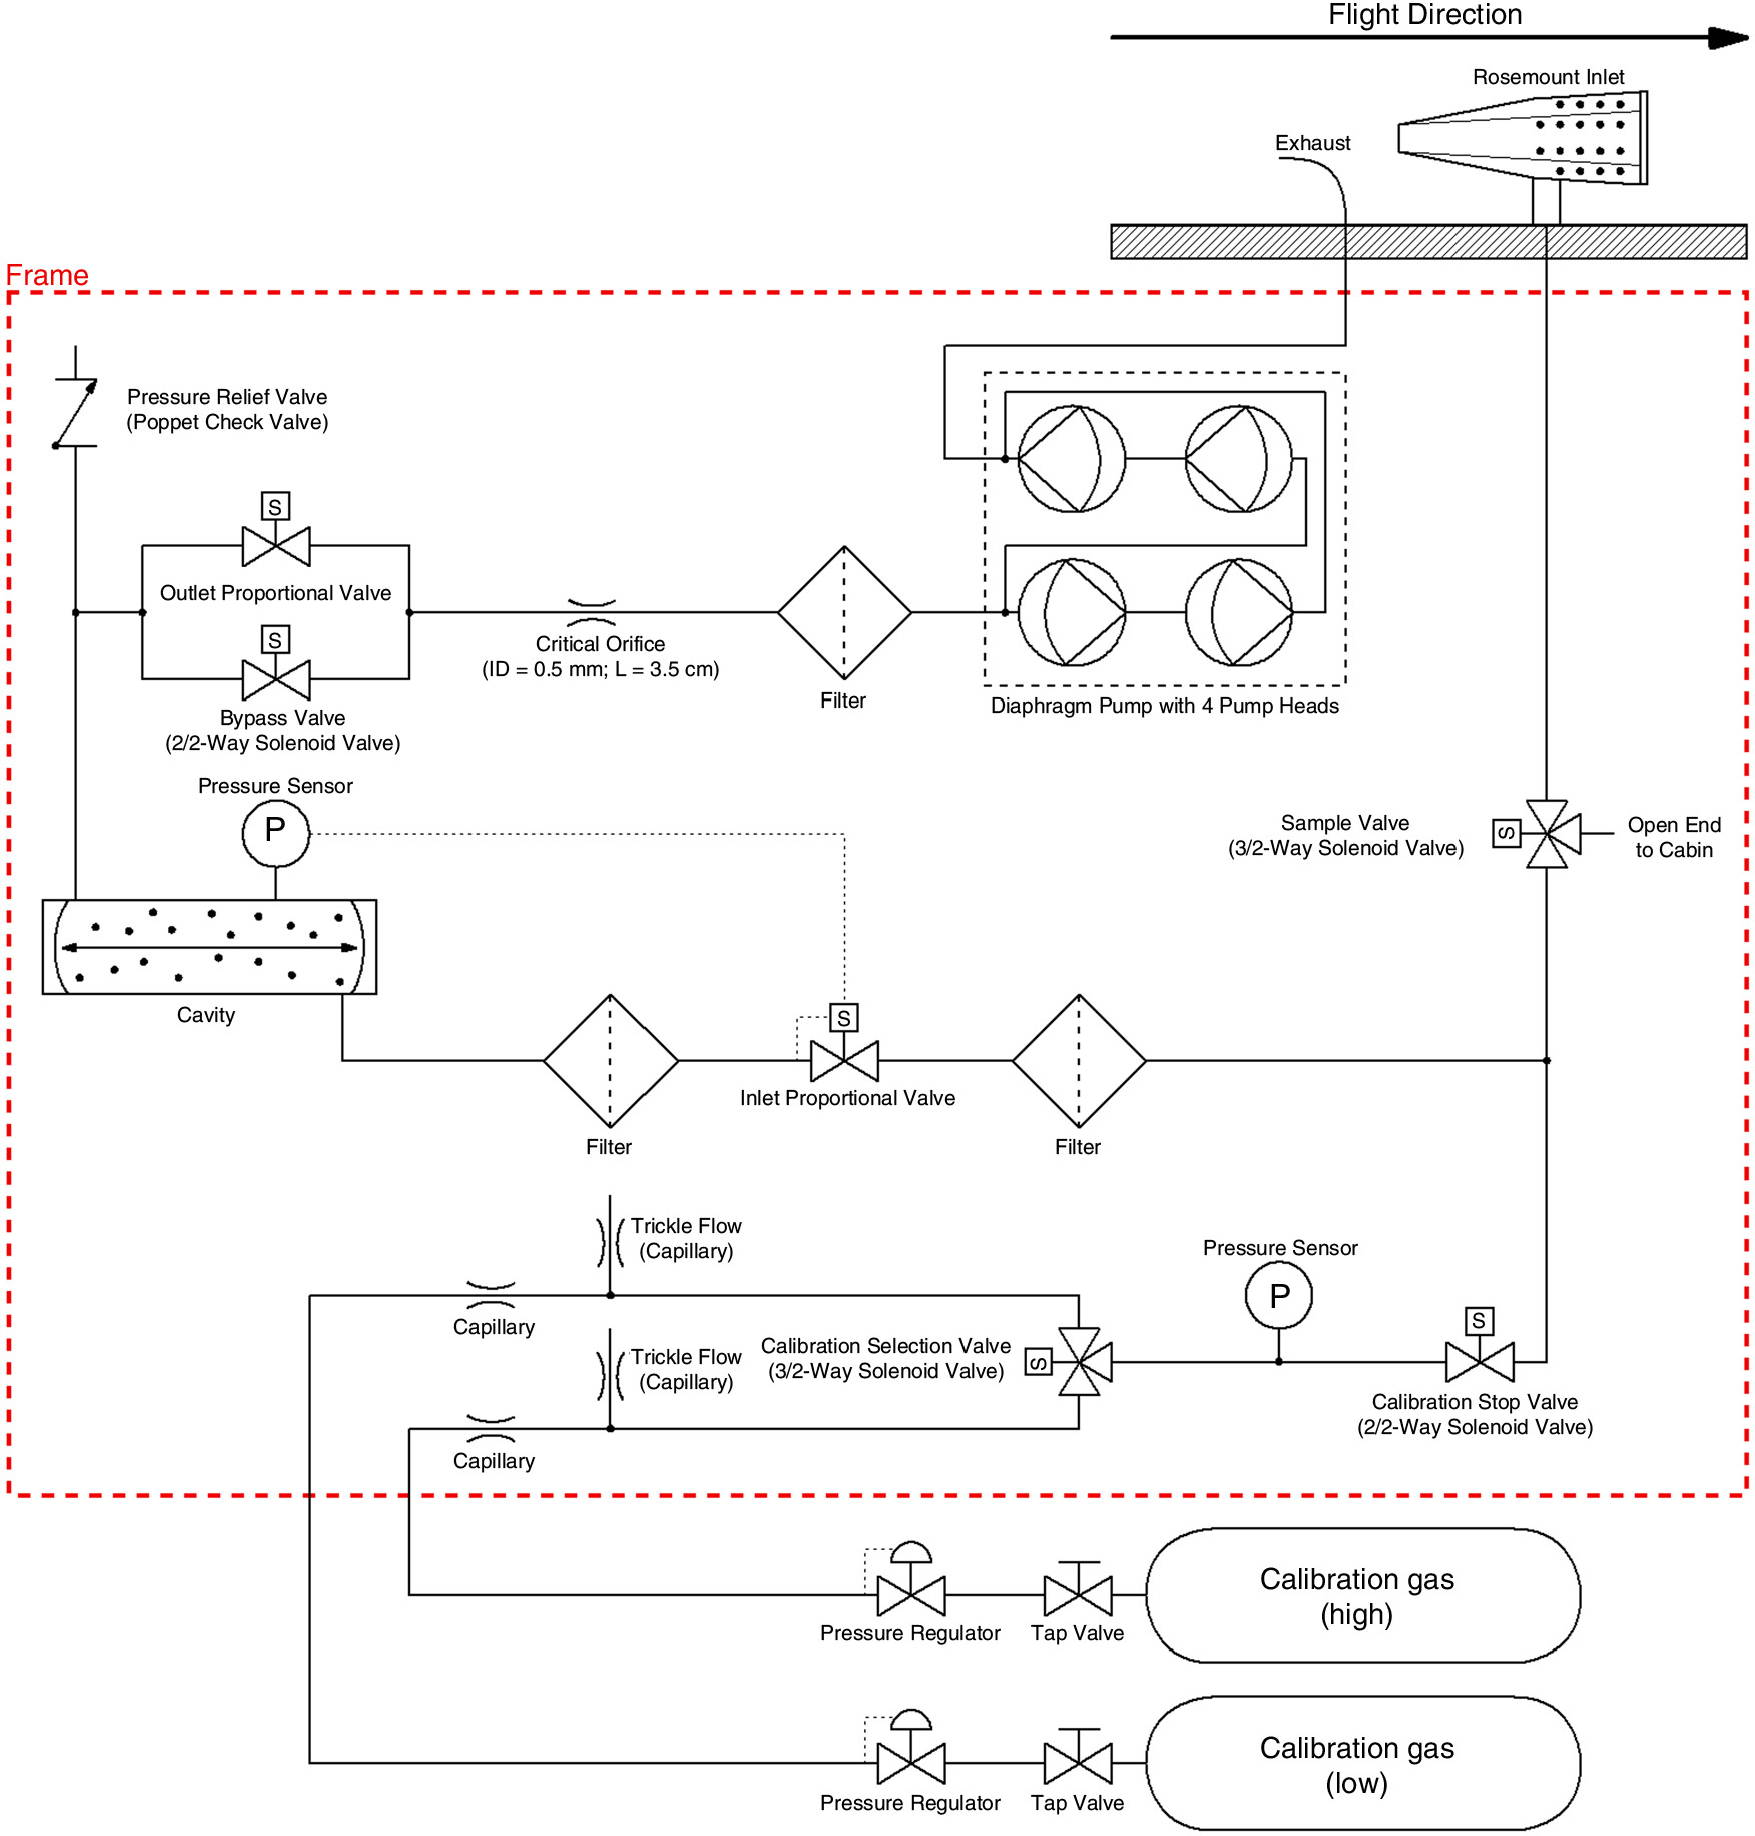
Fig. 1
Schematic flow diagram of the IAGOS GHG measurement system.
Table 1. Description of sub-assemblies and auxiliary parts
A Semiconductor Optical Amplifier (SOA) amplifies the laser light before the measurement. Calibration systemControls three valves to calibrate the instrument with standard gas provided by the two high-pressure cylinders. Thermo switchesInterrupt the electrical power provision to the whole instrument at temperatures above 70°C.Auxiliary parts Data acquisition system and power managementCircuit breaker; DC/DC converters for generation of 12V, −12V, 3.3V, 5V and 24V; Computer board to manage the data storage and handling the data transfer to the PI data interface; Power Board and Logic Board to control the subunits; SSD; AD-converter.
Table 2. Valve selection for different instrument modes
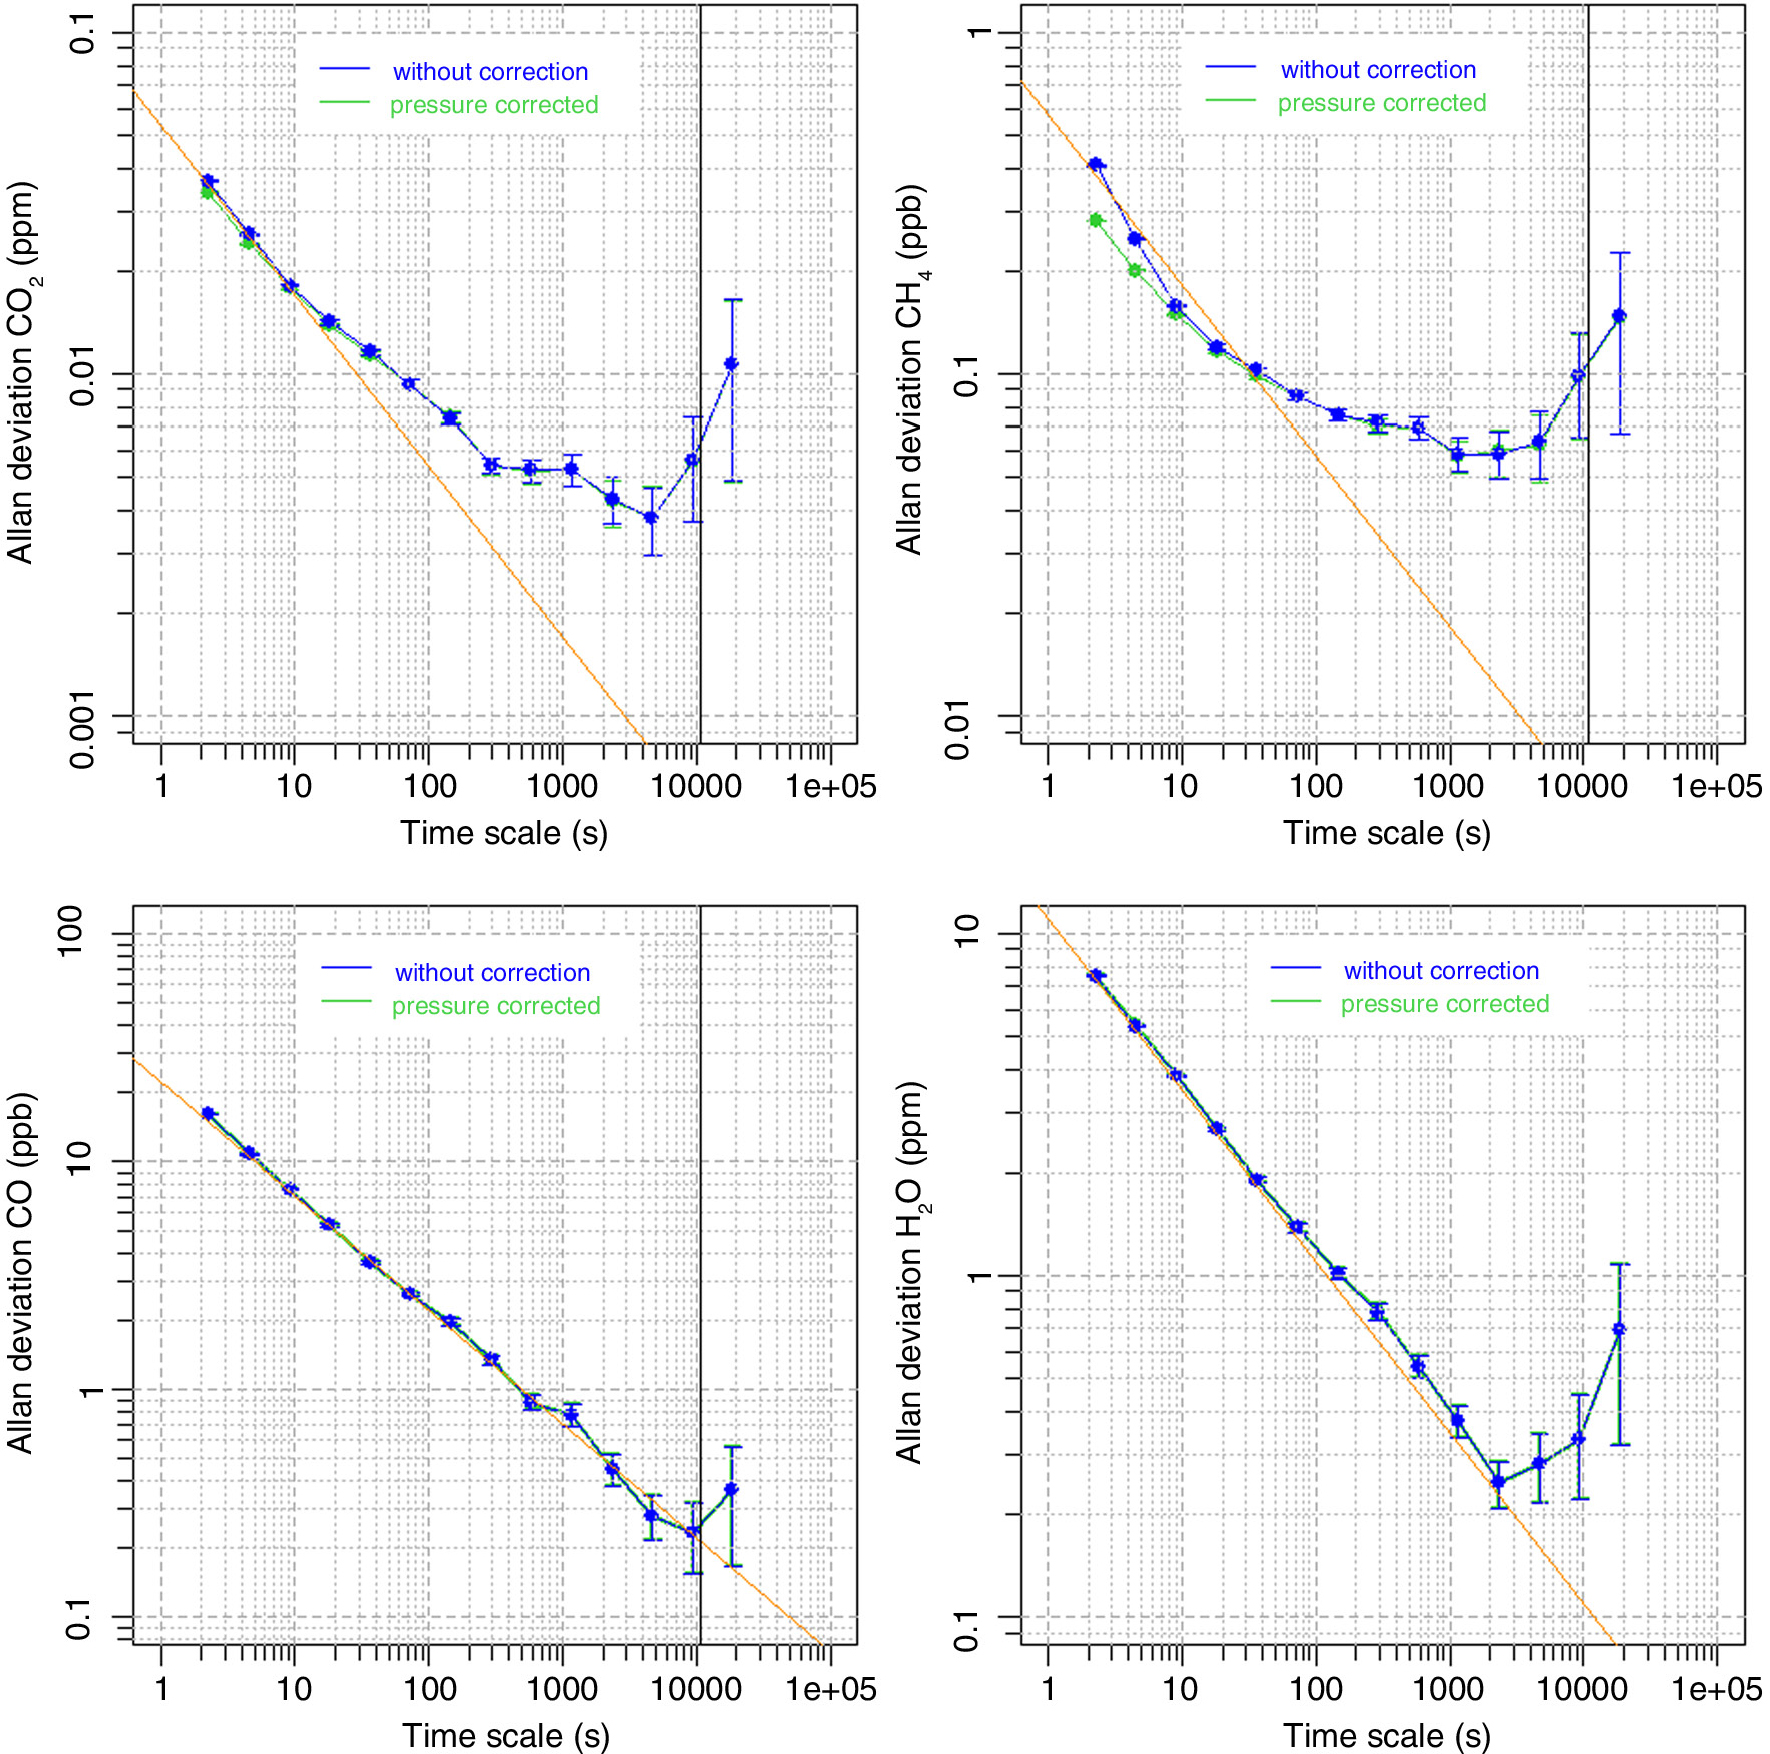
Fig. 2
Allan deviation plots of a 21-h measurement of dried, ambient air from a high-pressure tank for CO2, CH4, CO and H2O. The raw measurement data are shown in blue, data corrected for sample cell pressure deviations in green. The orange line (slope −0.5) shows the region of Gaussian or white noise. The black vertical lines at 10 800 s (3 h) indicate the planned calibration frequency.
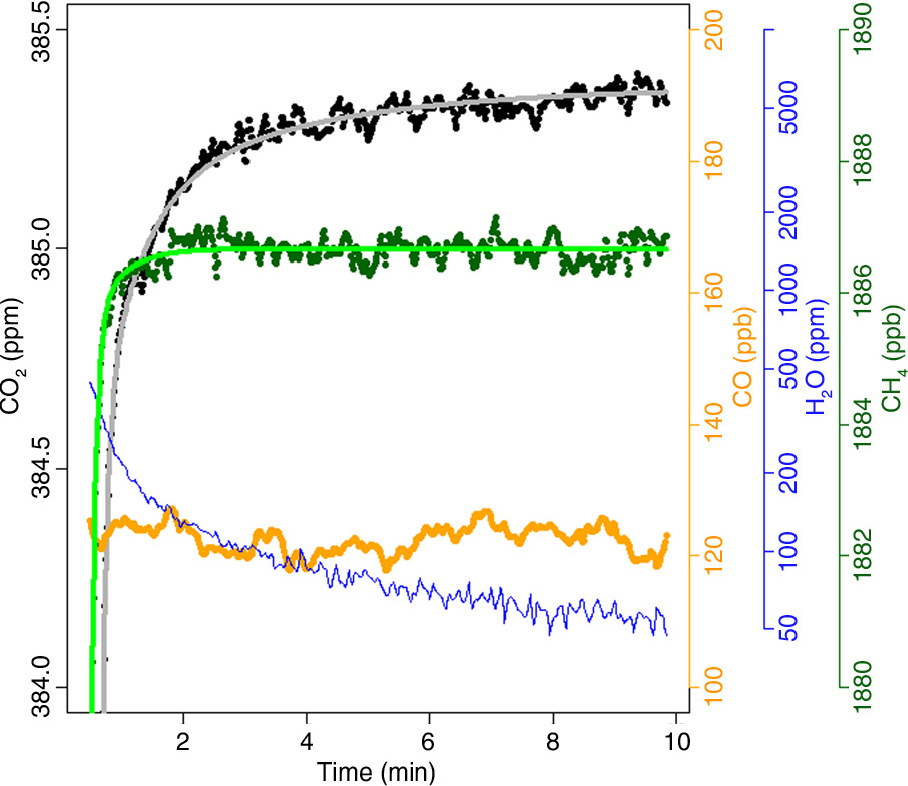
Fig. 3
Low-span calibration measurement (CO2 – black, CH4 – light green, CO – yellow, H2O – blue) during simulation of a typical measurement cycle with a trickle flow of 2.8 ml/min. ‘Time’ is the time after the calibration was started in minutes. For CO2 and CH4 exponential fitting curves to the calibration time series are shown in grey and light green, respectively.
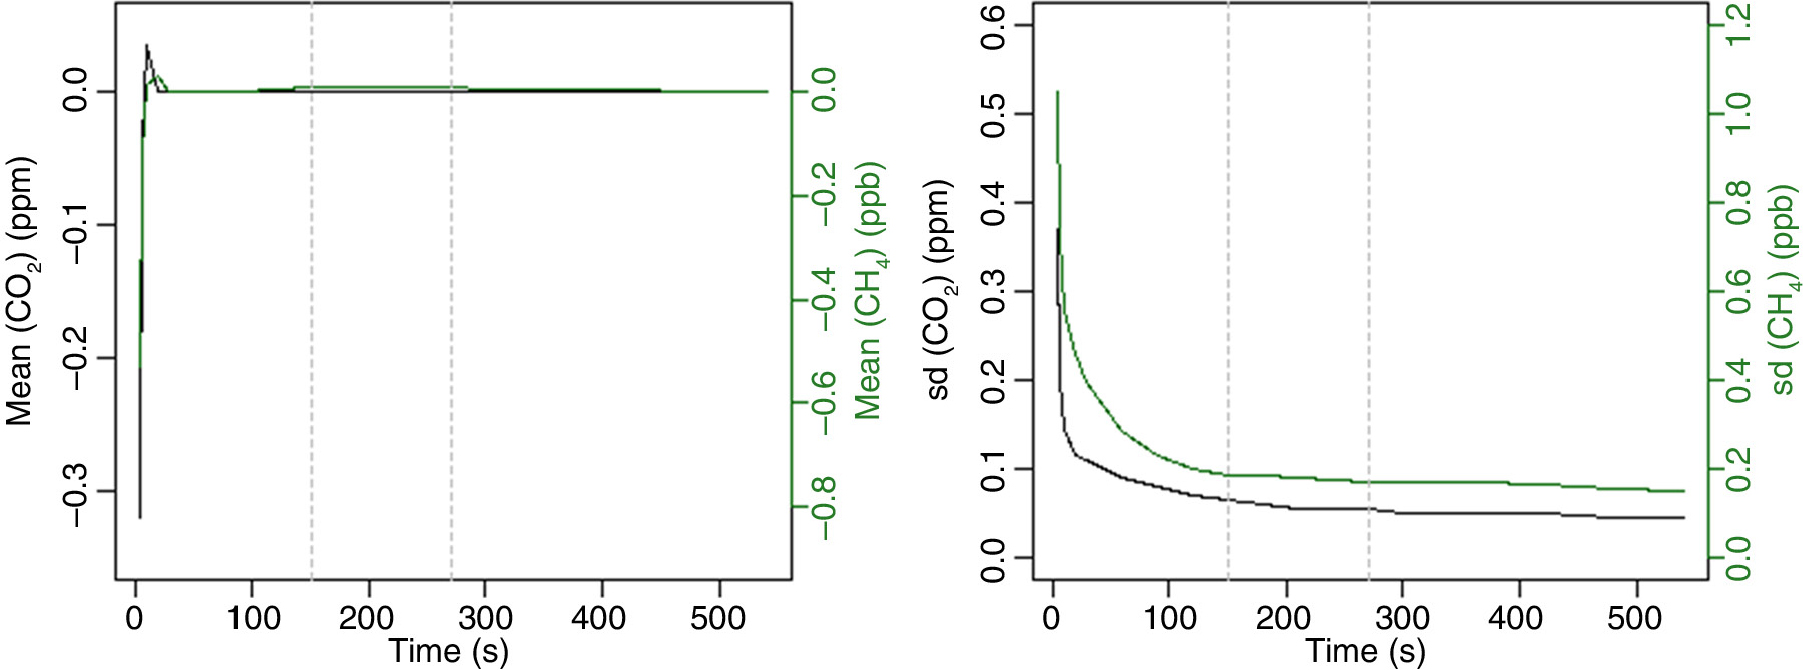
Fig. 4
Mean and standard deviation (SD) of the eight fitted corrections c j for CO2 and CH4 as a function of the time interval used for fitting the calibration measurement. ‘Time’ is the time after 30 s flushing. The grey vertical lines indicate 3- and 5-min calibration lengths (150 and 270 s, respectively).
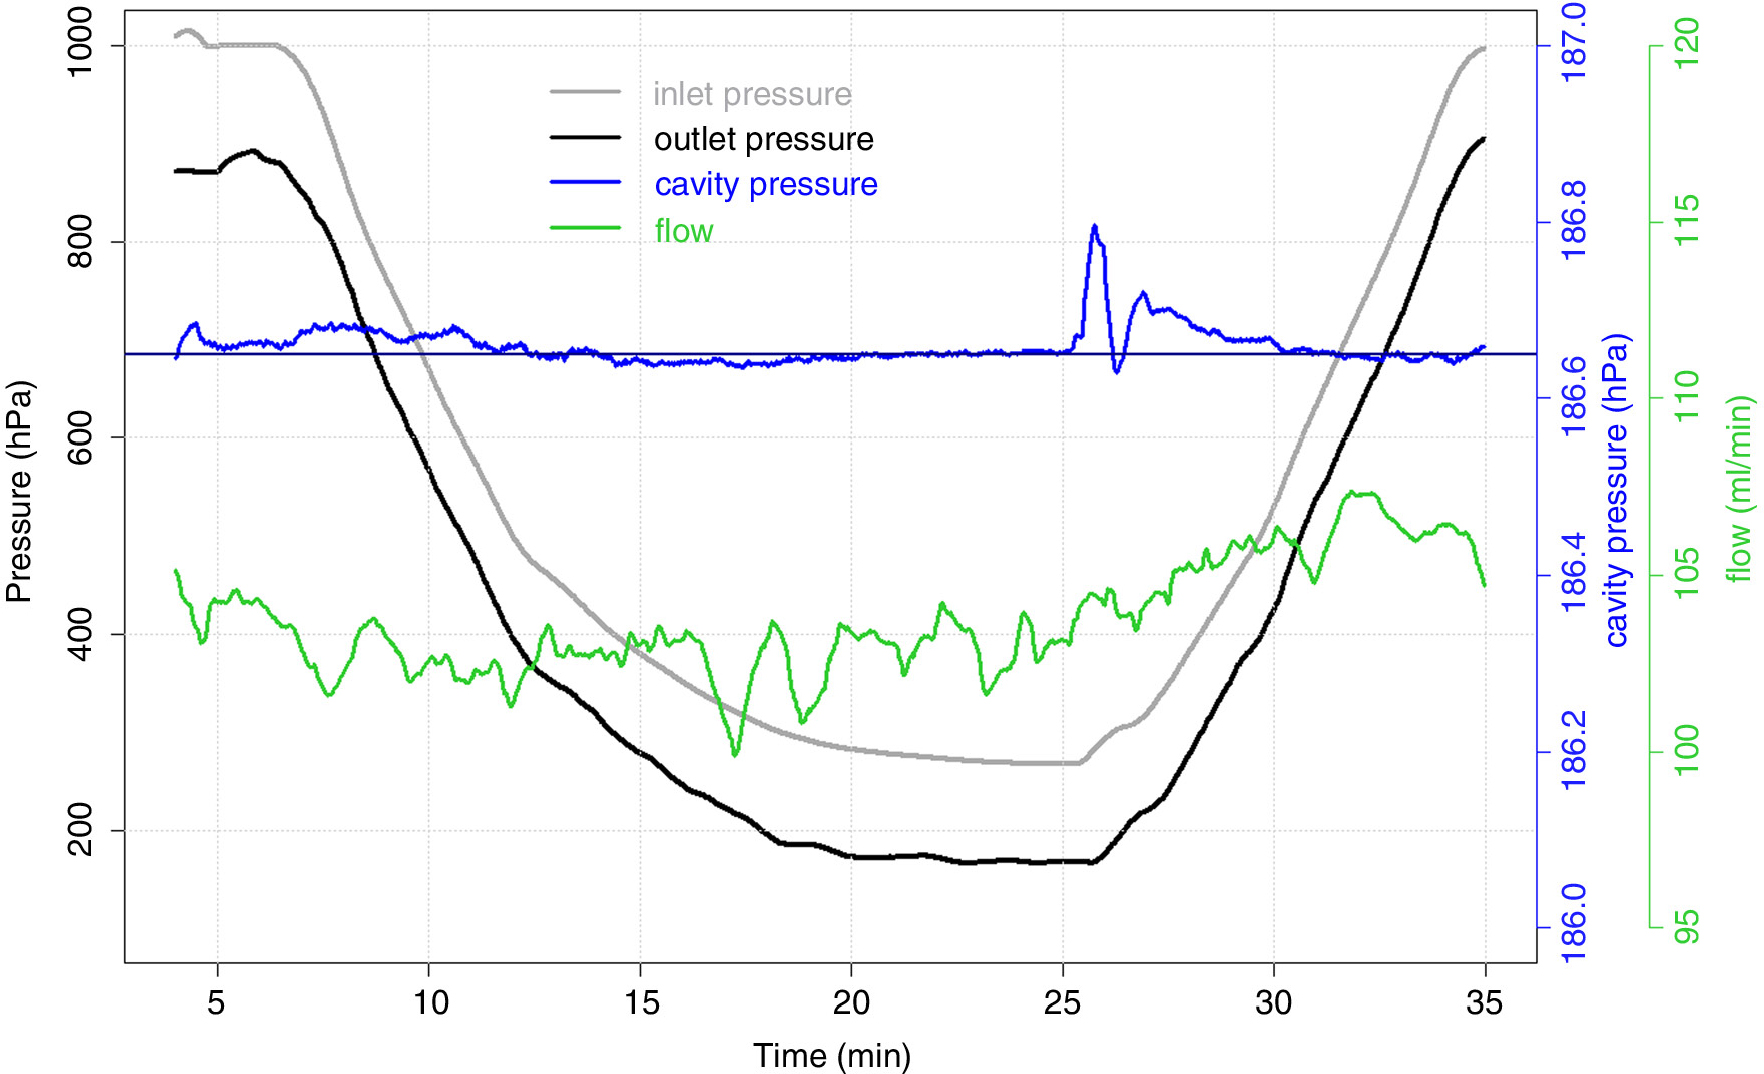
Fig. 5
Typical pressure changes during flight profile measurements. Shown are the 30 s means of the pressure at the air inlet (in grey) and the air outlet (black), pressure in the sample cell (blue) and sample flow (green). The vertical dark blue line indicates the setpoint of the sample cell pressure at 186.65 hPa (corresponding to 140 Torr).
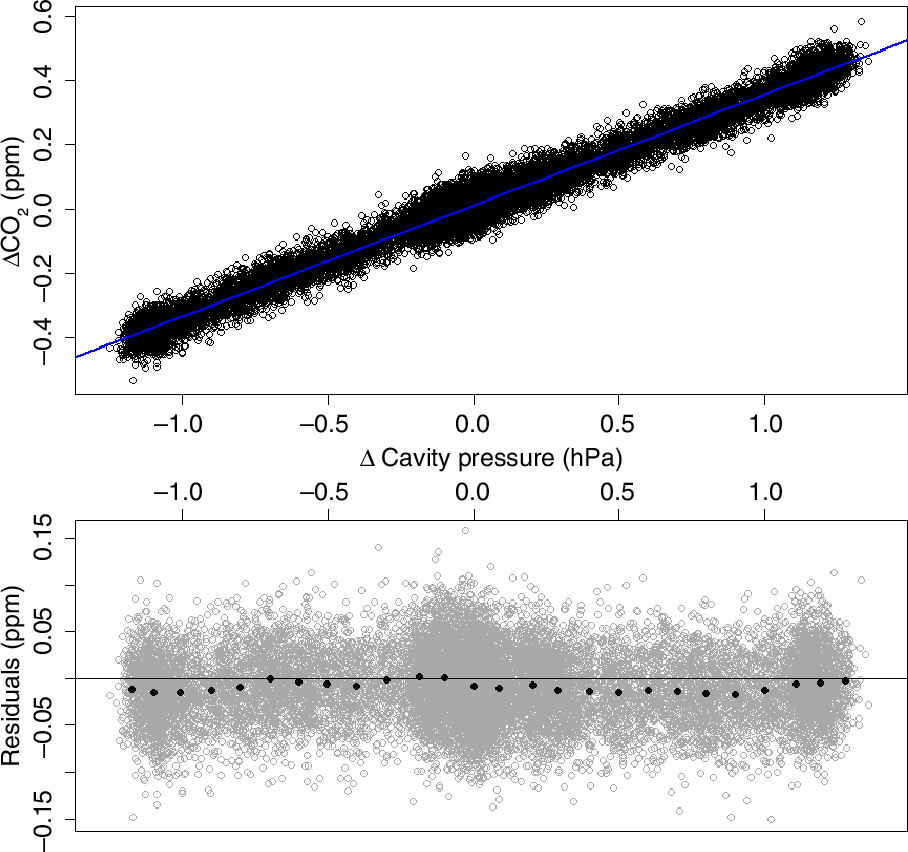
Fig. 6
Error of the CO2 measurement due to deviations in sample cell pressure referenced to the setpoint of 186.65 hPa (140 Torr), measured at a CO2 mole fraction level of 390 ppm. The blue line is a linear fit of the data. The correction factor (slope of the linear fit) is 0.35 ppm/hPa for CO2, 6.18 ppb/hPa for CH4 (at a CH4 mole fraction level of 1920 ppb) and −2.1 ppb/hPa for CO (at a CO mole fraction level of 150 ppb). Residuals are shown in grey, black points are the mean values for intervals of 0.1 hPa sample cell pressure.
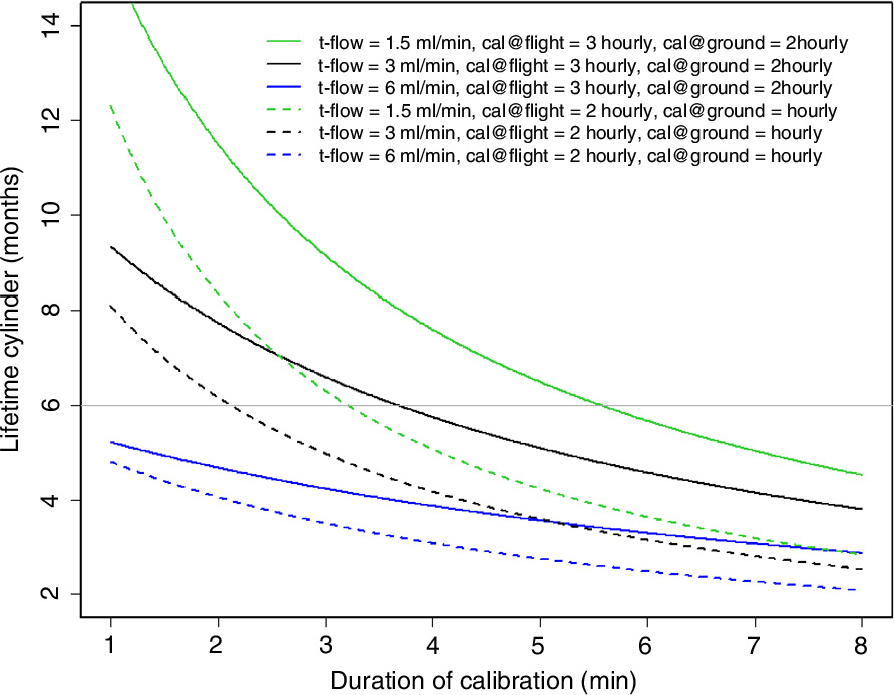
Fig. 7
Lifetime of a calibration gas cylinder filling for various calibration scenarios. t-flow stands for trickle flow, cal@flight(ground) is the calibration frequency during flight (on ground). The grey horizontal line indicates a lifetime of 6 months.
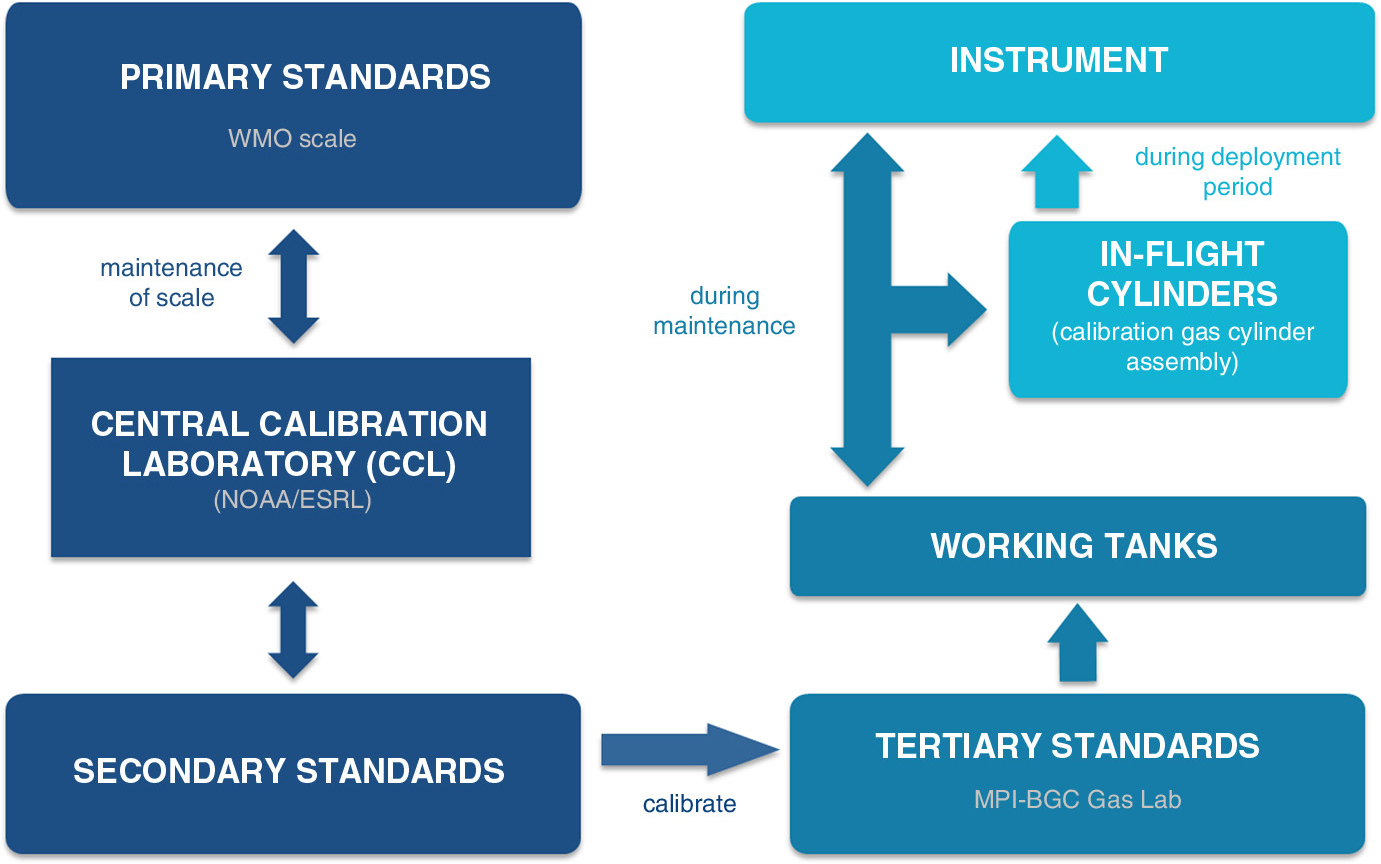
Fig. 8
Calibration chain of the IAGOS-core instrument ensuring the traceability of the measurements to the World Meteorological Organization primary scales.
Table 3. Estimates of the different uncertainty components for the IAGOS-core CO2, CH4 and CO measurements and the resulting overall uncertainties (1-sigma)
Table 4. Overall uncertainty (1-sigma values) of the water vapour measurements
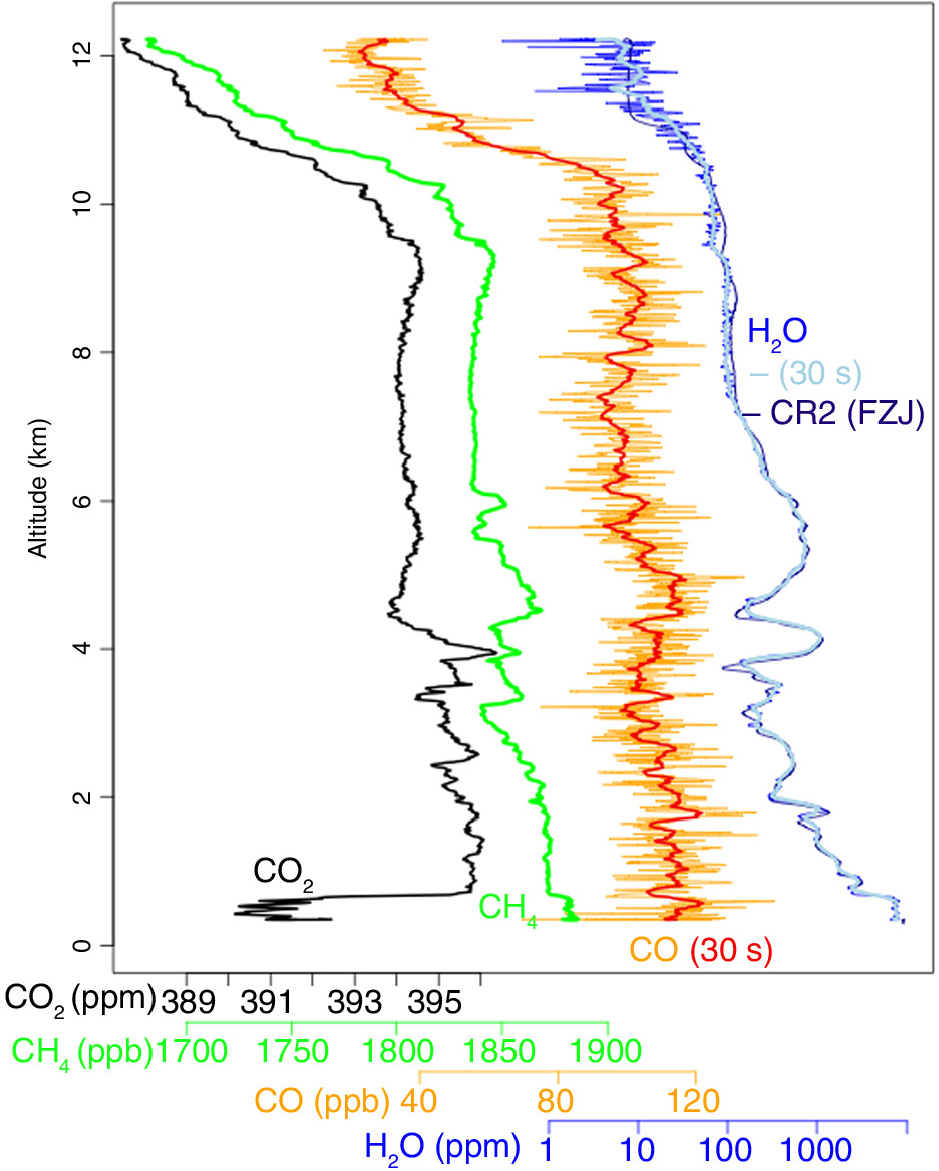
Fig. 9
Measured profiles (0.4 Hz data) by the CRDS analyser during noon on 1 June 2011 over Hohn (Germany) for CO2 (black), CH4 (green), CO (orange, 30 s average in red) and H2O (blue, 30 s average in light blue). The measurements from the frostpoint hygrometer CR2 can be seen in dark blue.