
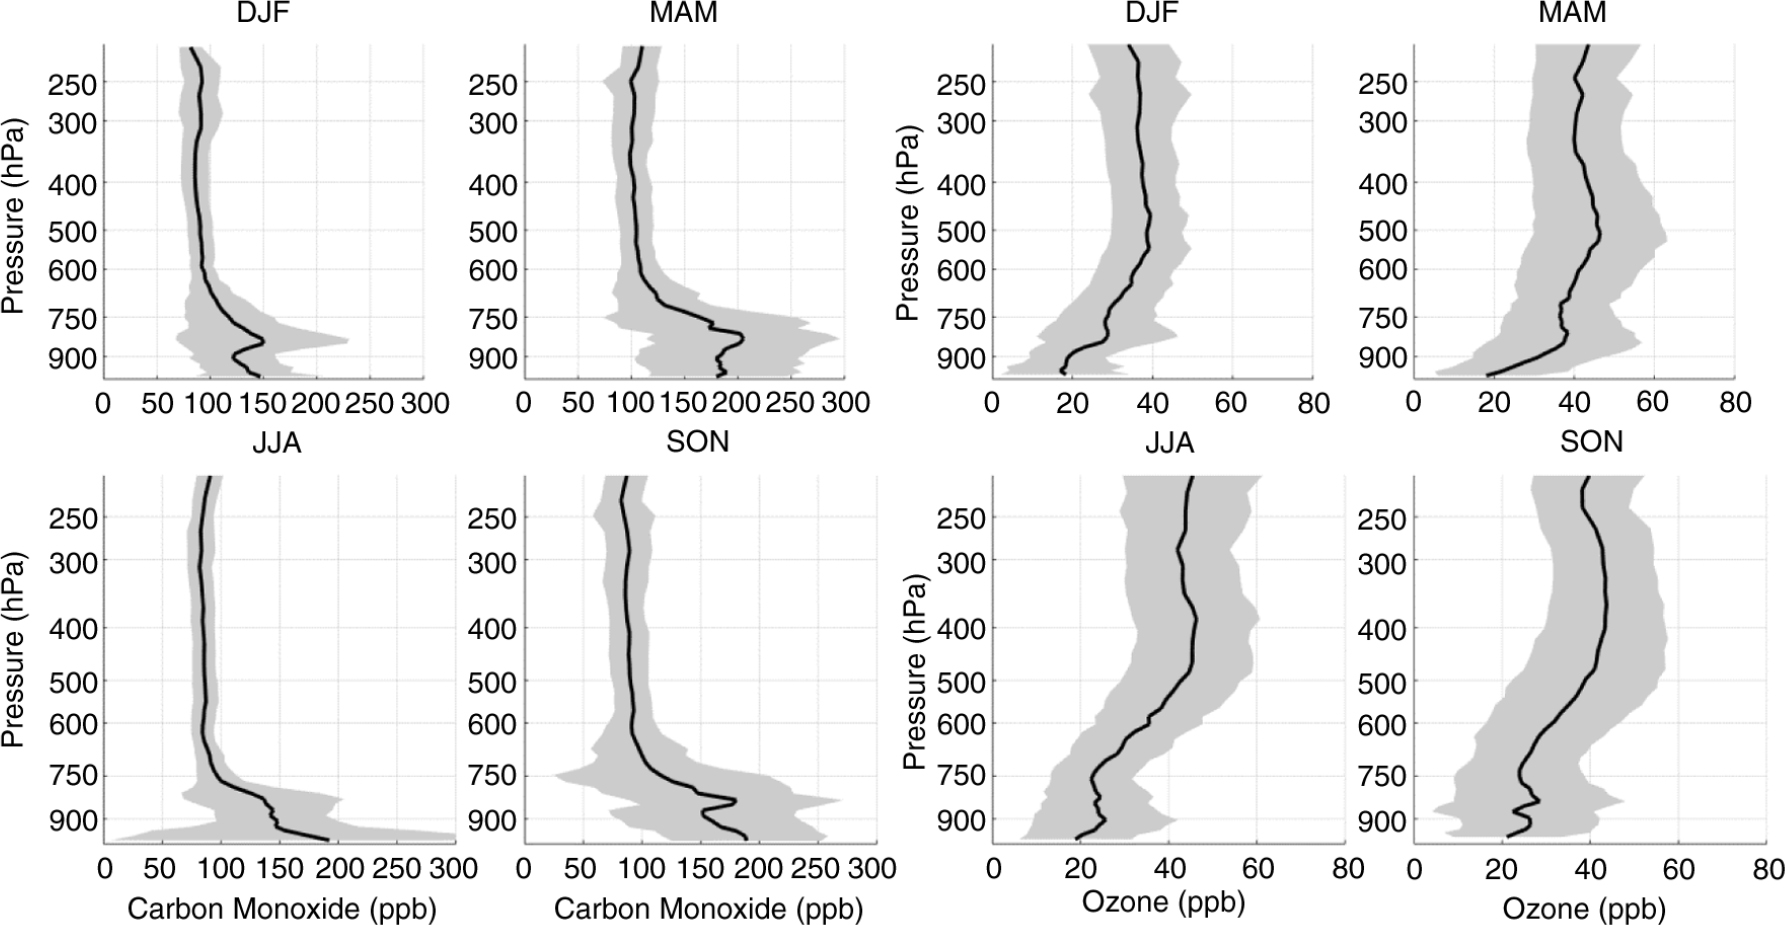
Fig. 1
Seasonal mean profile of carbon monoxide (on the left) and ozone (on the right) from the surface up to 200 hPa based on MOZAIC/IAGOS flight measurements performed during landing and taking off at Caracas, averaged over the period August 1994 to March 2009. Shading interval represents 1 SD and shows the variability of the data.
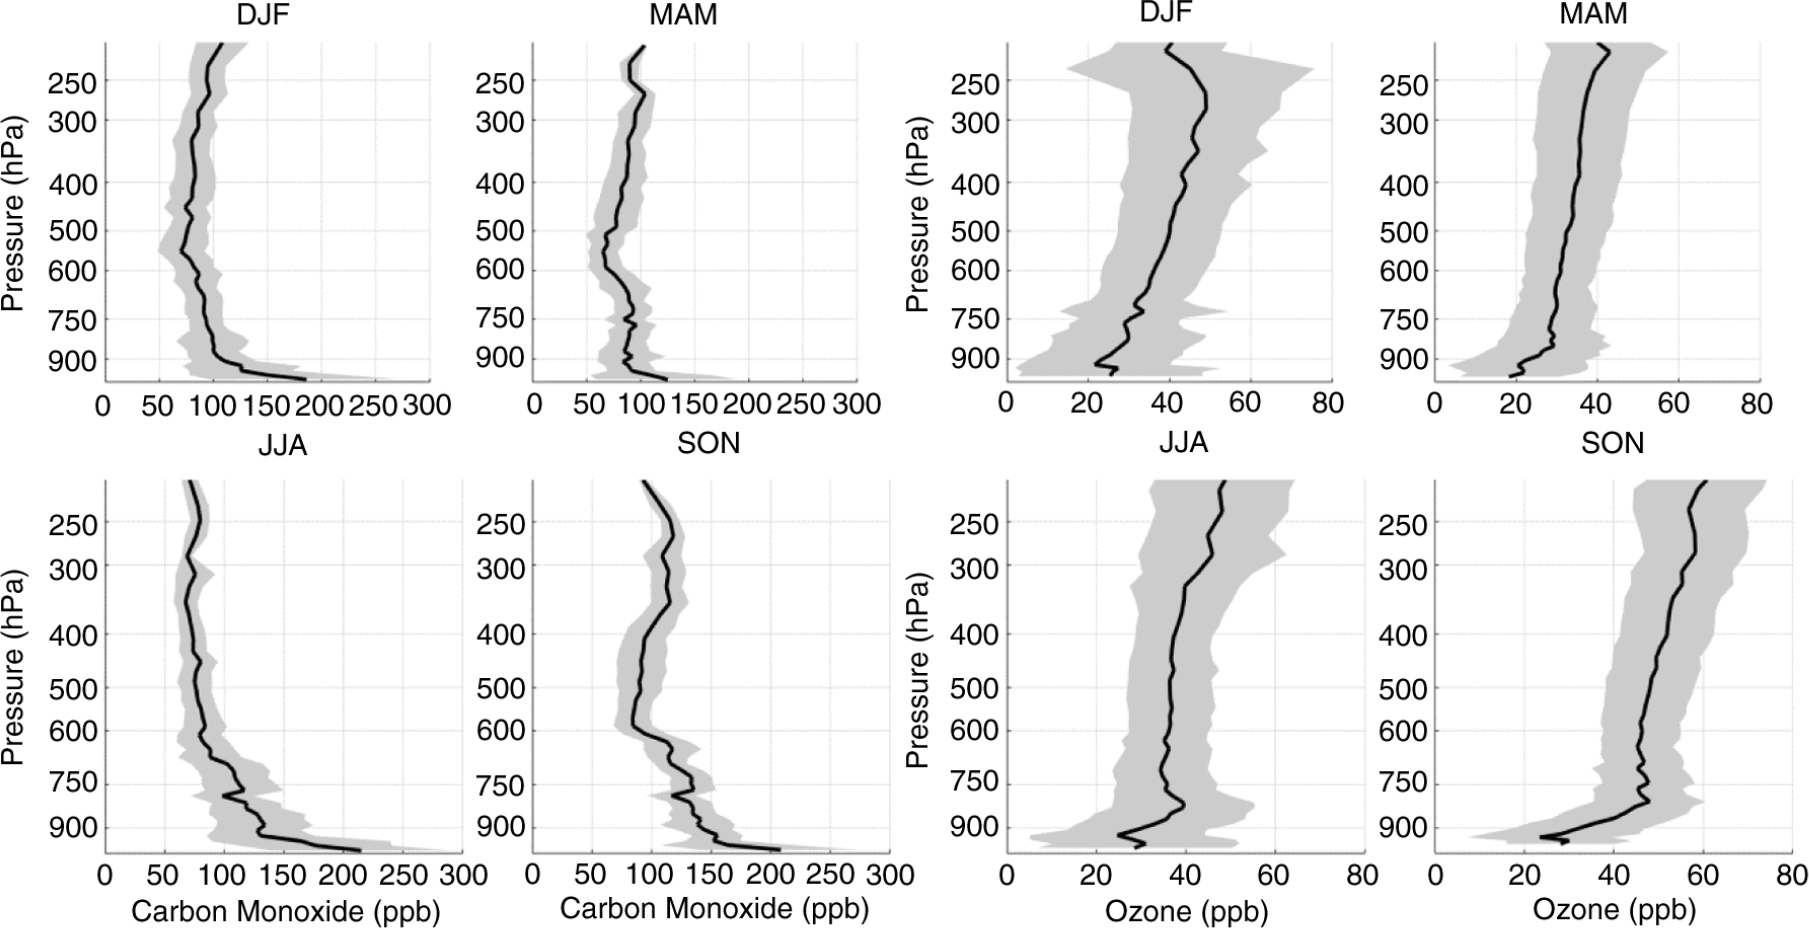
Fig. 2
Seasonal mean profile of carbon monoxide (on the left) and ozone (on the right) from the surface up to 200 hPa based on MOZAIC/IAGOS flight measurements performed during landing and taking off at Rio de Janeiro and São Paulo over the period from August 1994 to December 2012. Shading interval represents 1 SD and shows the variability of the data.
Table 1. Seasonal mean of partial ozone column, in DU, for each year and different altitudes and respective SE corrected for autocorrelation in time
[i] Also shown the available number of vertical profiles from MOZAIC/IAGOS programmes in Caracas, Venezuela, the effective number of samples, the standard Gaussian z, the lag-1 autoregressive coefficient in parentheses and, on the last line for each layer, the global seasonal mean. Values in bold indicate values statistically above the global mean at the 5% significance level.
Table 2. Seasonal mean of partial ozone column, in DU, for each year and different altitudes and respective SE corrected for autocorrelation in time
[i] Also shown the available number of vertical profiles from MOZAIC/IAGOS Programs in São Paulo and Rio de Janeiro, Brazil, the effective number of samples, the standard Gaussian z, the lag-1 autoregressive coefficient in parentheses and, on the last line for each layer, the global seasonal mean. Values in bold indicate values statistically above the global mean at the 5% significance level.
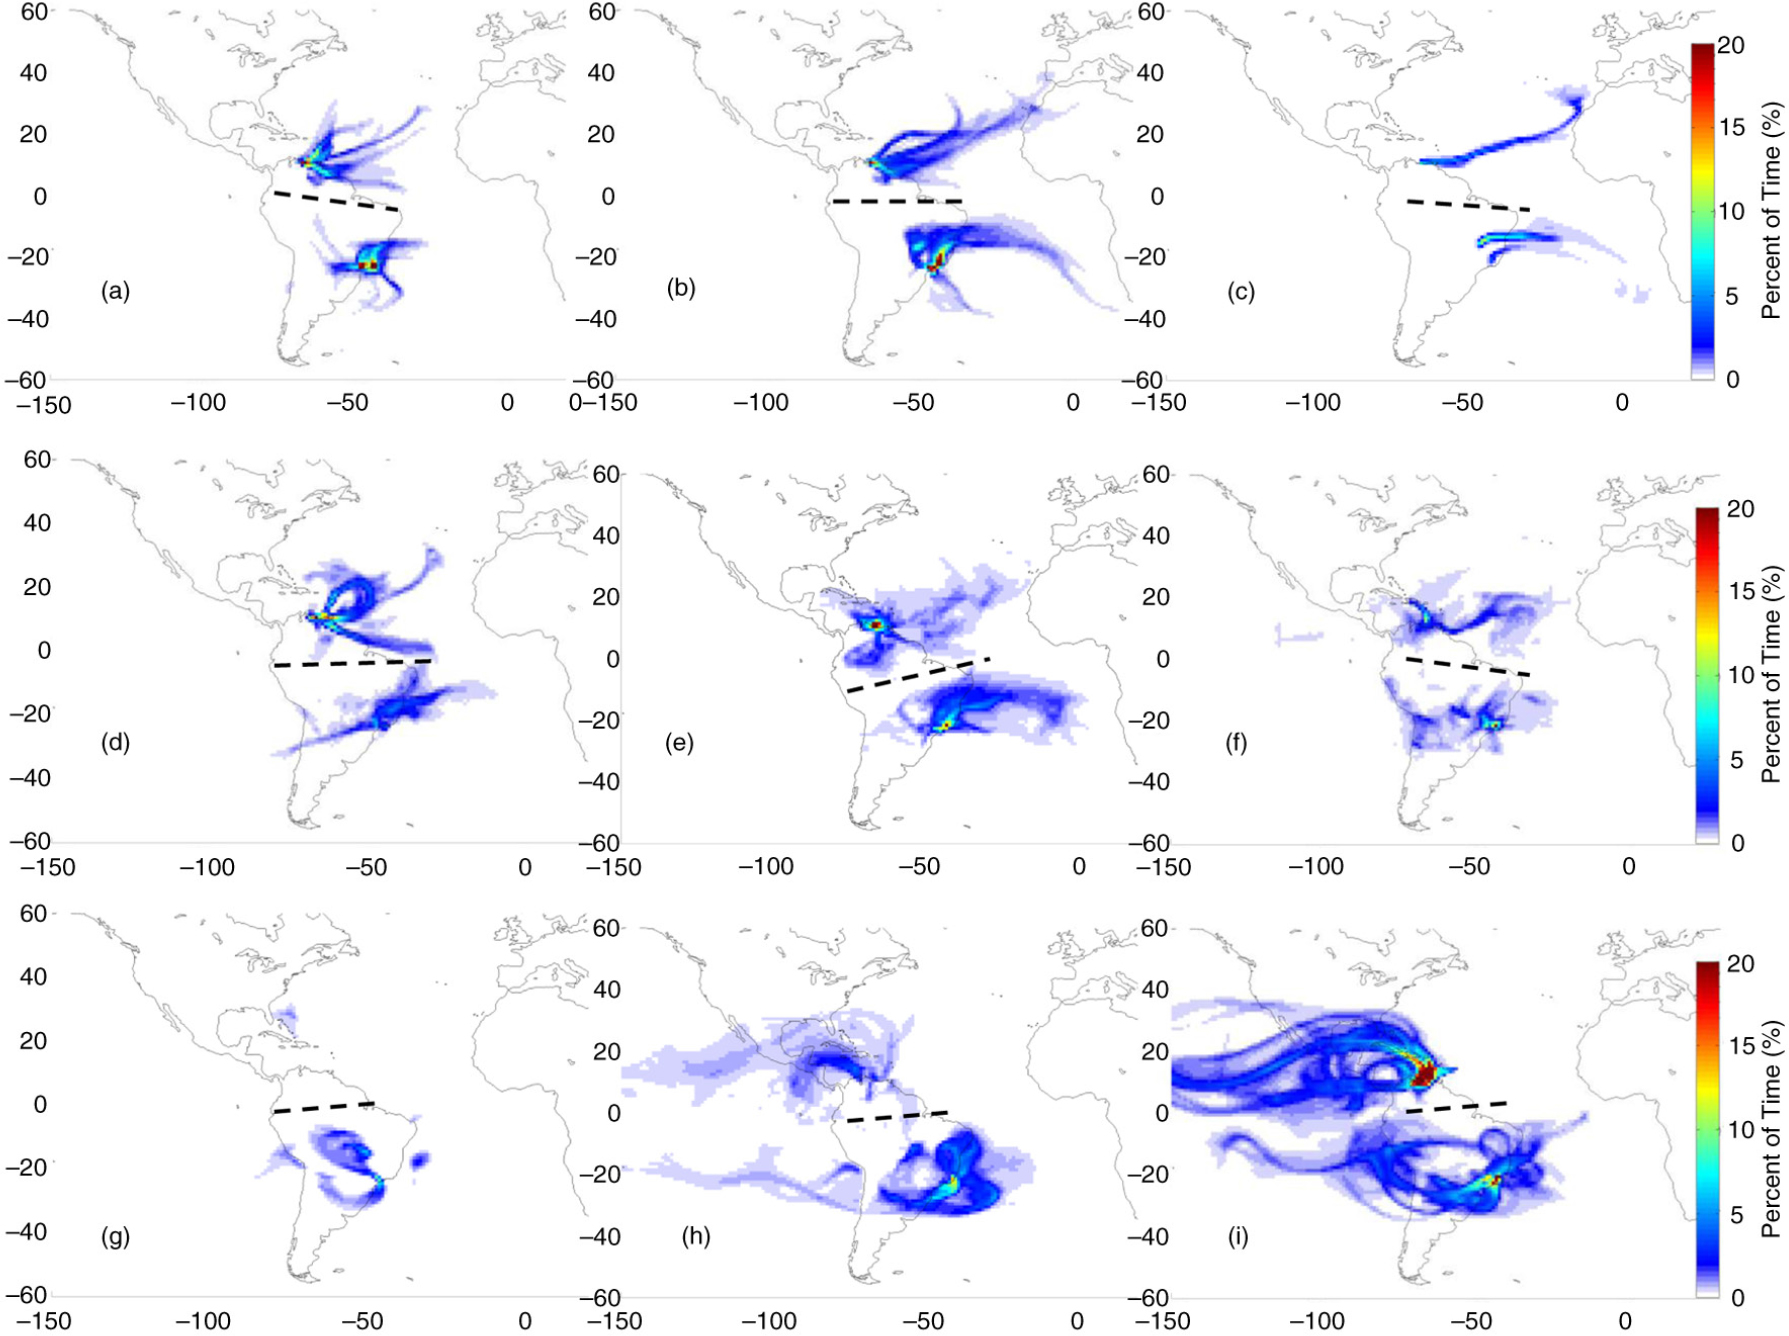
Fig. 3
Origin of air mass based on FLEXPART 14-d back trajectories for cases whose flight layers presented ozone mixing ratios above 40 ppbv over Caracas, Rio de Janeiro or São Paulo in DJF. Colours represent the percent of residence time (or normalised residence time in percent). The columns correspond to flight layers: low troposphere (below 700 hPa) on the left; medium troposphere (between 650 and 380 hPa) on the middle; and upper troposphere (380–180 hPa) on the right panel, while rows correspond to the layers of air mass origin: low troposphere (below 700 hPa) at the top; mid-troposphere (700 to 380 hPa) on the second line and from higher altitudes (380 to ~60 hPa) at the bottom panels. The black dashed lines separate trajectories for Caracas from the ones for São Paulo or Rio de Janeiro.
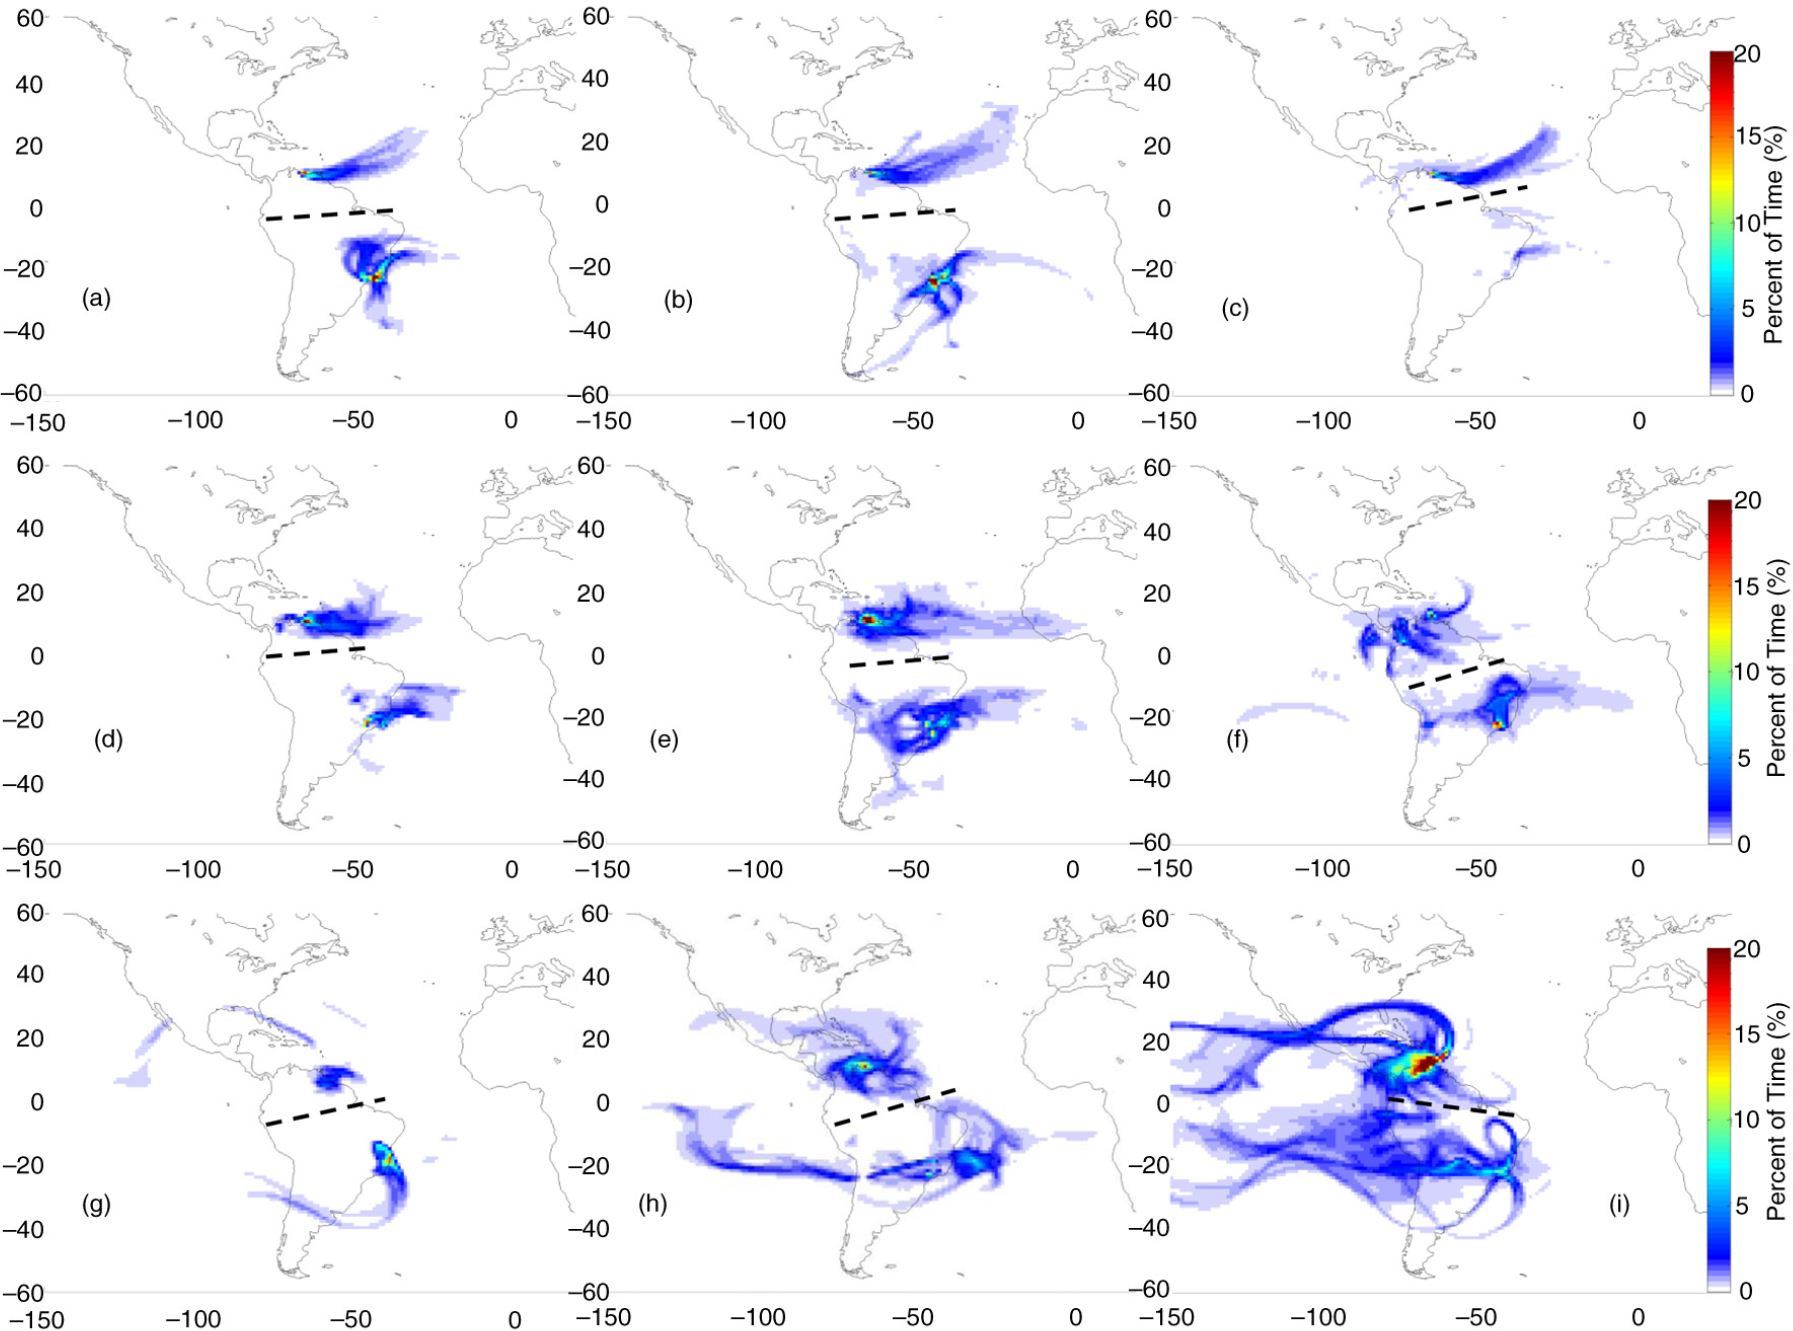
Fig. 4
Origin of air mass based on FLEXPART 14-d back trajectories for cases whose flight layers presented ozone mixing ratios above 40 ppbv over Caracas, Rio de Janeiro or São Paulo in MAM. Colours represent the percent of residence time (or normalised residence time in percent). The columns correspond to flight layers: low troposphere (below 700 hPa) on the left; medium troposphere (between 650 and 380 hPa) on the middle; and upper troposphere (380–180 hPa) on the right panel, while rows correspond to the layers of air mass origin: low troposphere (below 700 hPa) at the top; mid-troposphere (700–380 hPa) on the second line; and from higher altitudes (380 to ~60 hPa) at the bottom panels. The black dashed lines separate trajectories for Caracas from the ones for São Paulo or Rio de Janeiro.
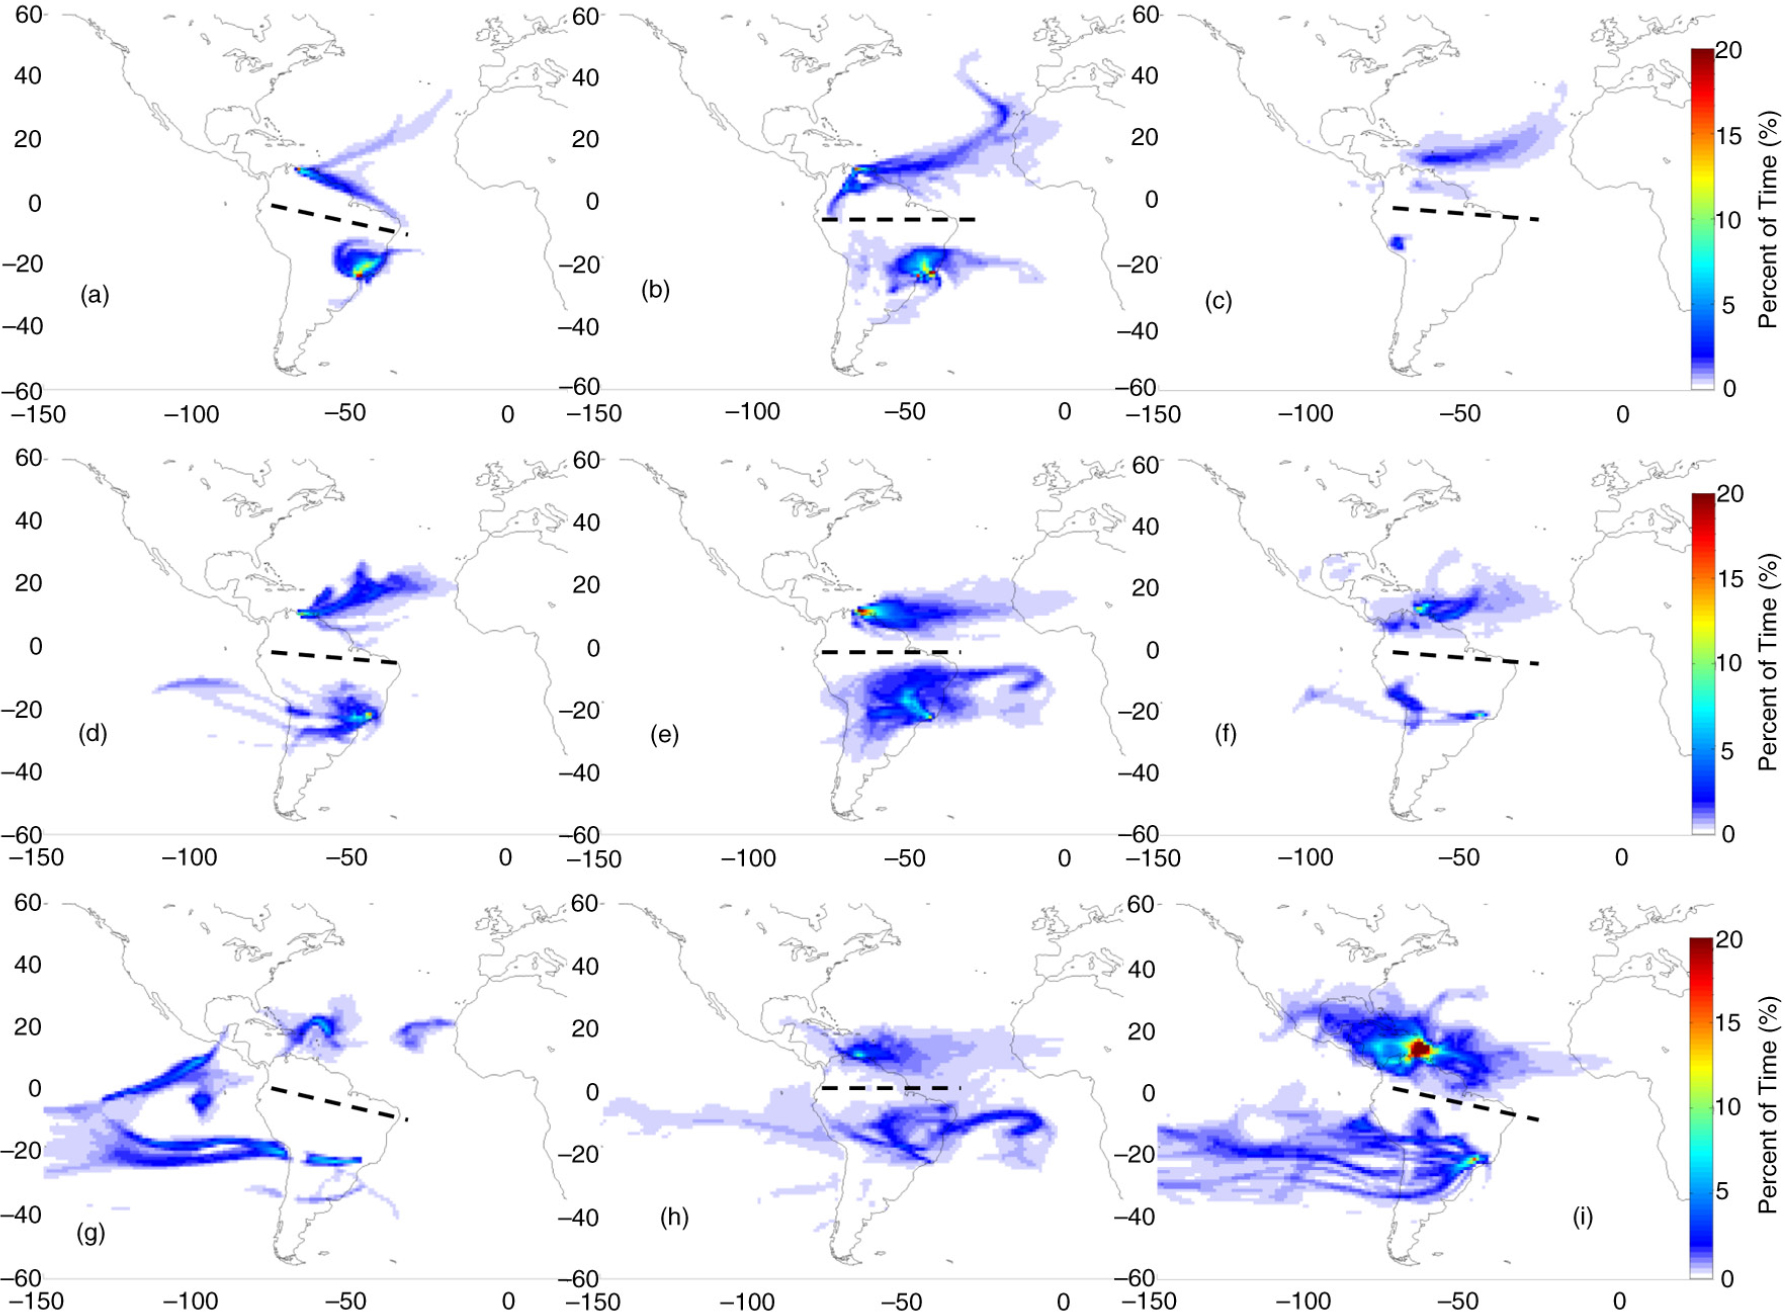
Fig. 5
Origin of air mass based on FLEXPART 14-d back trajectories for cases whose flight layers presented ozone mixing ratios above 40 ppbv over Caracas, Rio de Janeiro or São Paulo in JJA. Colours represent the percent of residence time (or normalised residence time in percent). The columns correspond to flight layers: low troposphere (below 700 hPa) on the left; medium troposphere (between 650 and 380 hPa) on the middle; and upper troposphere (380–180 hPa) on the right panel, while rows correspond to the layers of air mass origin: low troposphere (below 700 hPa) at the top; mid-troposphere (700–380 hPa) on the second line; and from higher altitudes (380 to ~60 hPa) at the bottom panels. The black dashed lines separate trajectories for Caracas from the ones for São Paulo or Rio de Janeiro.
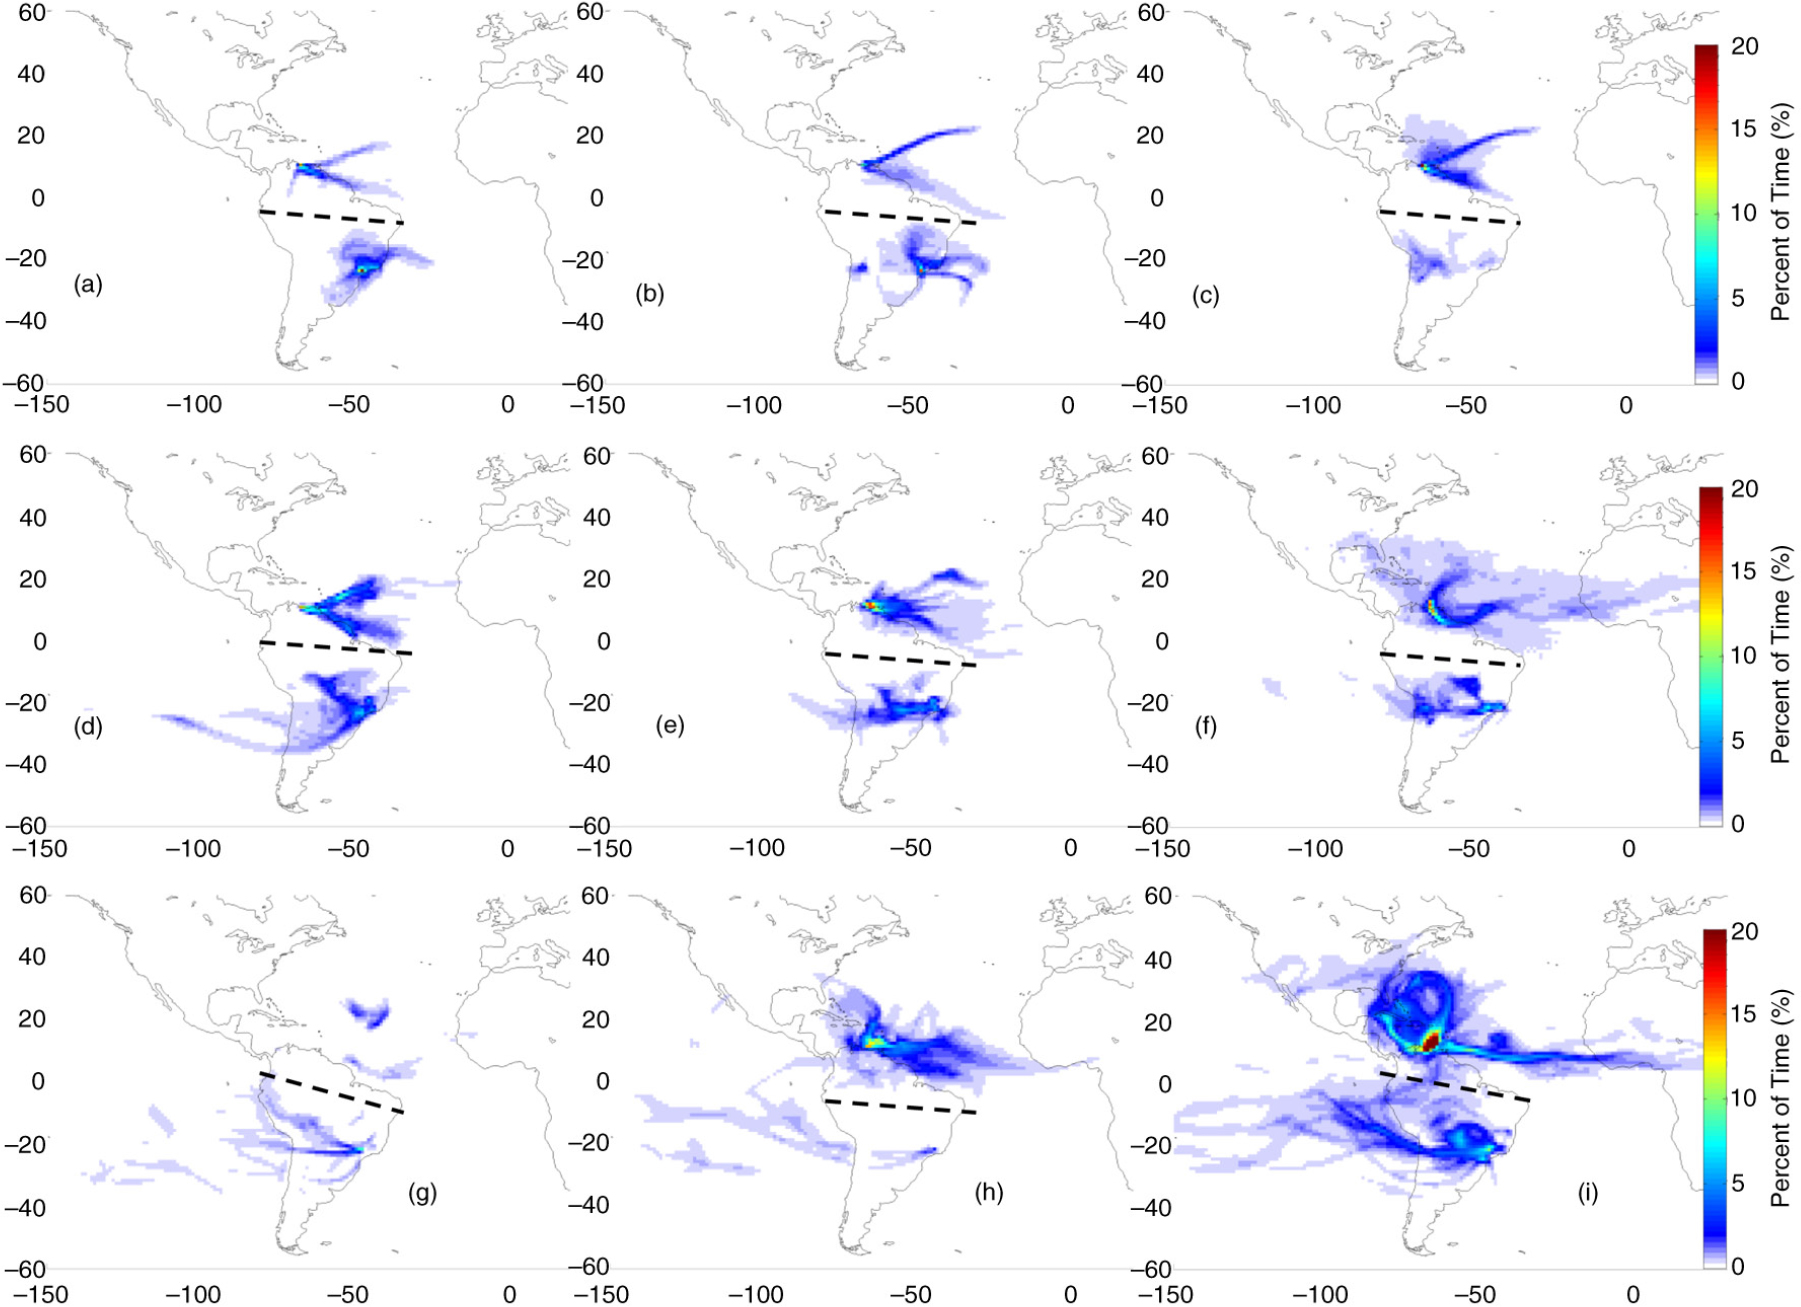
Fig. 6
Origin of air mass based on FLEXPART 14-d back trajectories for cases whose flight layers presented ozone mixing ratios above 40 ppbv over Caracas, Rio de Janeiro or São Paulo in SON. Colours represent the percent of residence time (or normalised residence time in percent). The columns correspond to flight layers: low troposphere (below 700 hPa) on the left; medium troposphere (between 650 and 380 hPa) on the middle; and upper troposphere (380–180 hPa) on the right panel, while rows correspond to the layers of air mass origin: low troposphere (below 700 hPa) at the top; mid-troposphere (700–380 hPa) on the second line; and from higher altitudes (380 to ~60 hPa) at the bottom panels. The black dashed lines separate trajectories for Caracas from the ones for São Paulo or Rio de Janeiro.
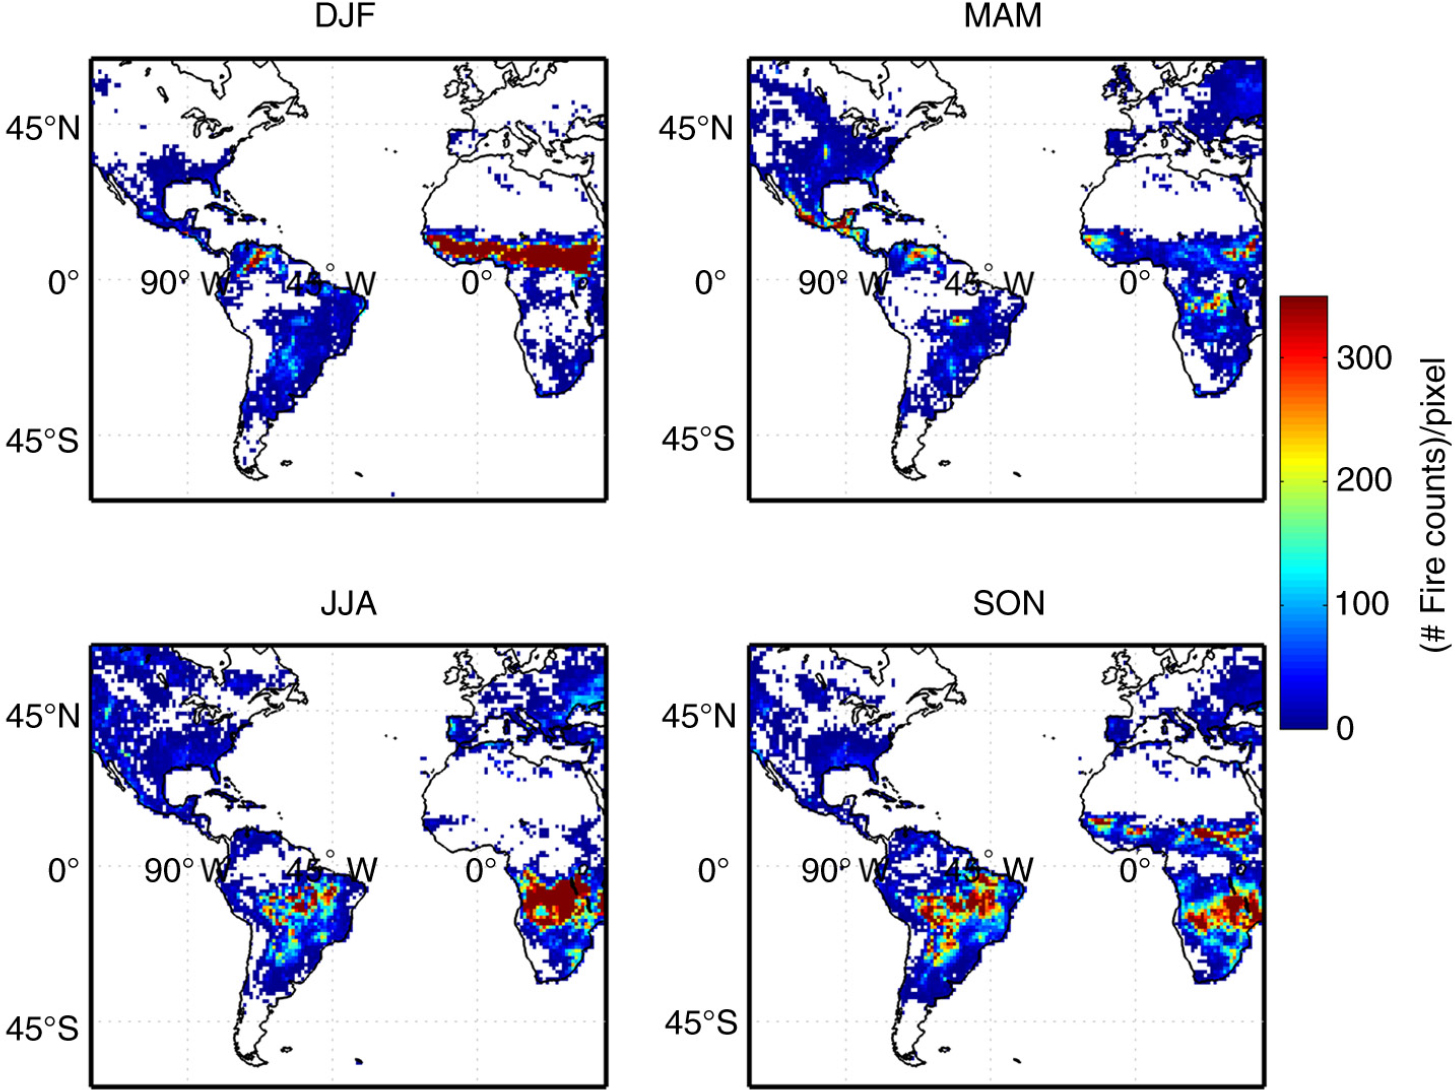
Fig. 7
Mean seasonal number of fire counts per pixel based on MODIS (Moderate Resolution Imaging Spectroradiometer) on board Terra satellite monthly data in the area delimited by latitude from −60° to 60° and longitude from −120° to 40°. Data from January 2002 to December 2012 (available at www.mirador.gsfc.nasa.gov/, – last accessed on 20 February 2014).
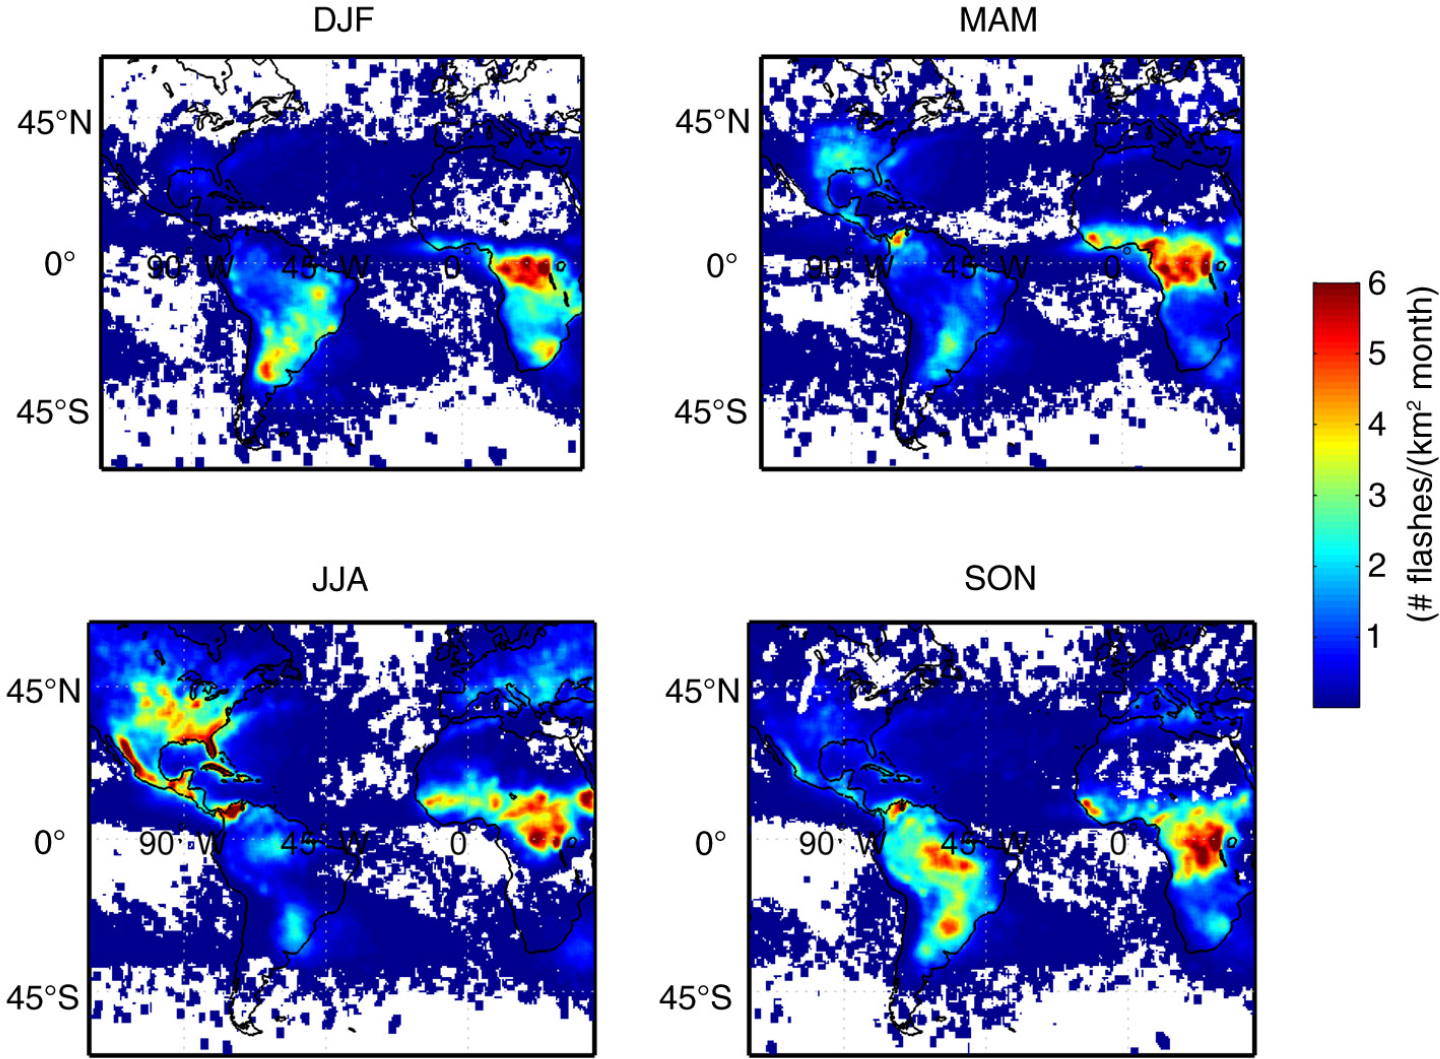
Fig. 8
Mean seasonal climatology of flash rates [# flashes/(km2 month)] from LIS (Lightning Imaging Sensor) on board Tropical Rainfall Measuring Mission (TRMM) satellite in the area delimited by latitude from −60° to 60° and longitude from −120° to 40°. Data from 1 January 2008 to 31 December 2012 (available at www.thunder.nsstc.nasa.gov/, last accessed on 12 November 2014).
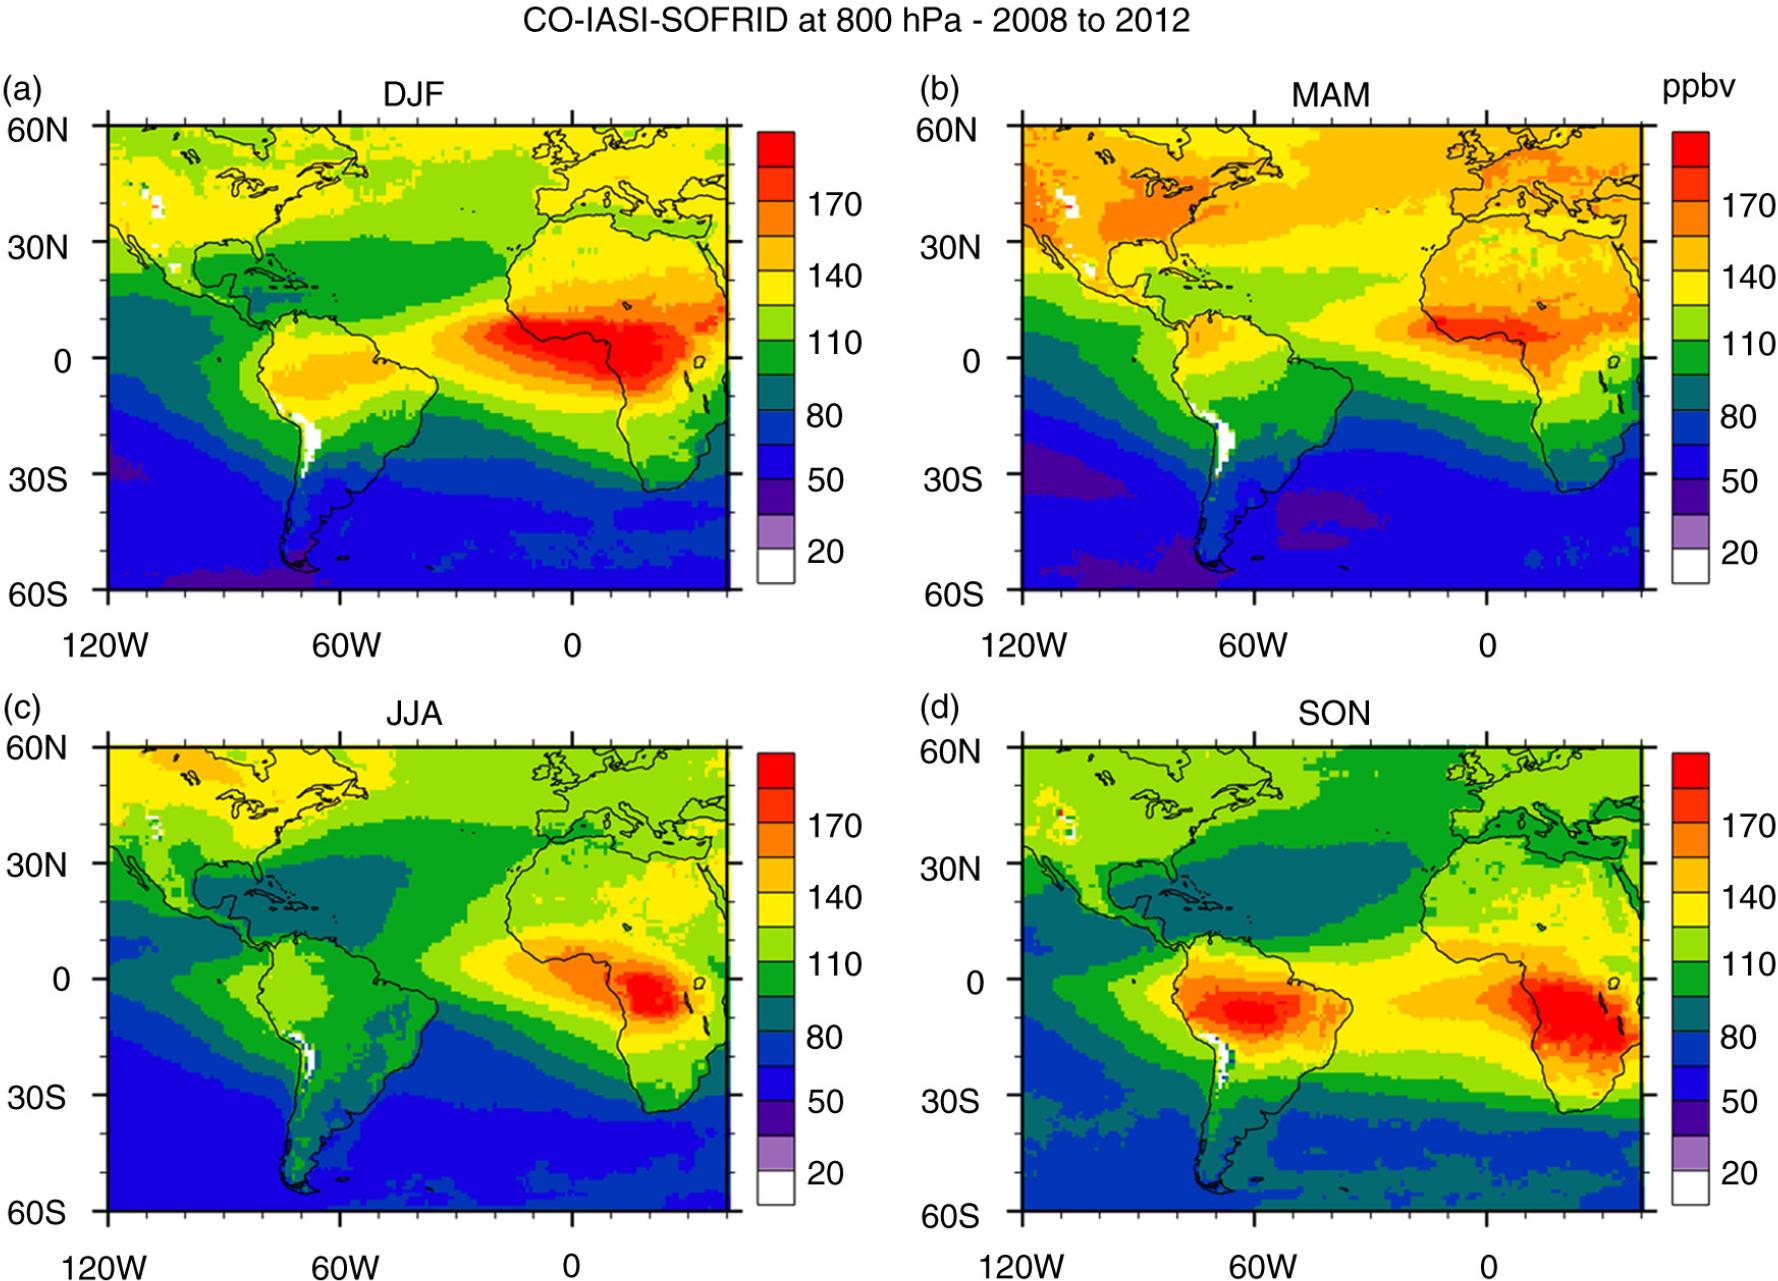
Fig. 9
Seasonal maps of carbon monoxide mixing ratio in ppbv at 800 hPa retrieved from IASI measurements on board MetOp-A satellite: (a) DJF; (b) MAM; (c) JJA; and (d) SON based on data from years 2008 to 2012.
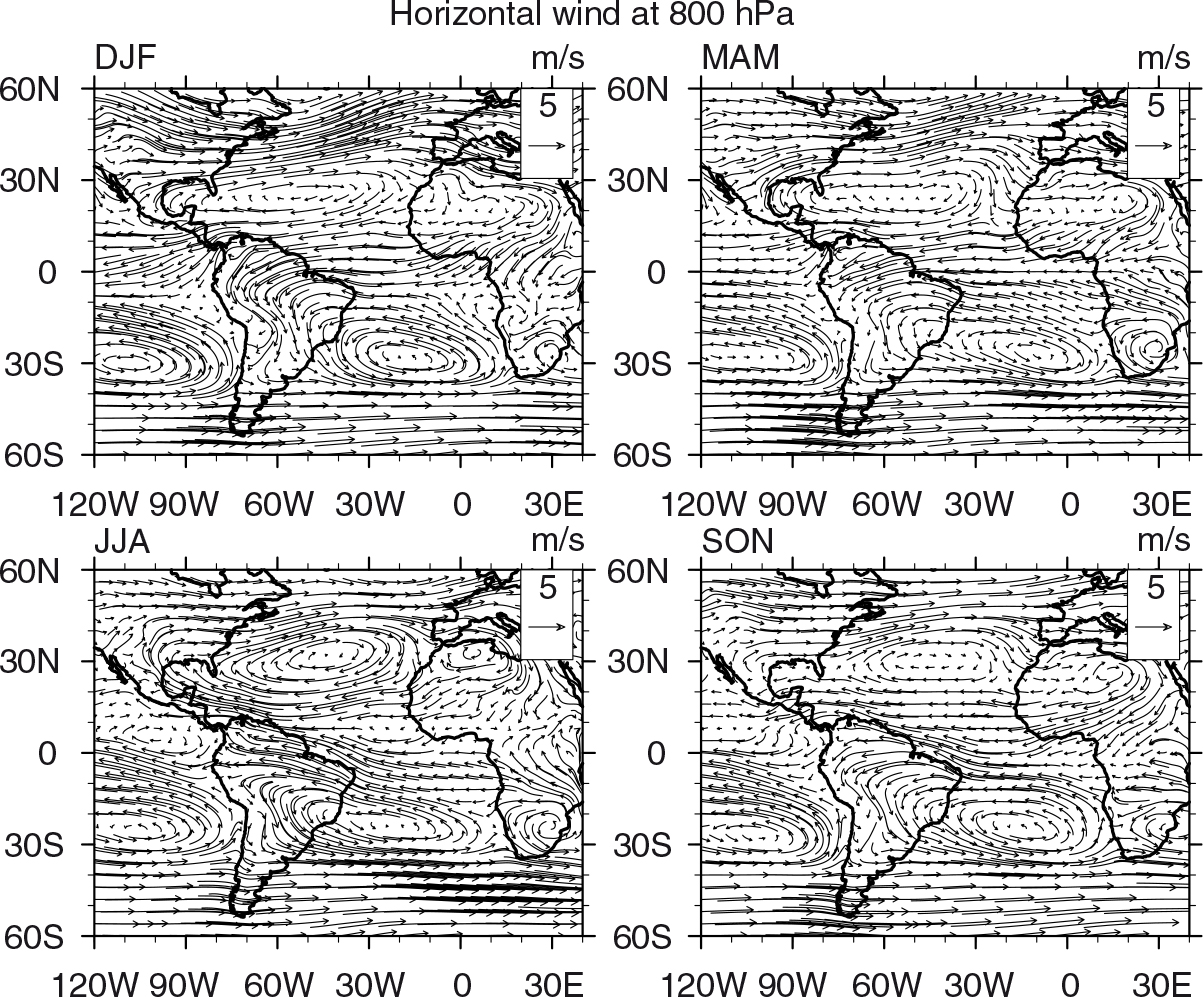
Fig. 10
Horizontal wind vector (m s−1) seasonal maps at 800 hPa from ECMWF ERA-Interim Global Reanalysis at 0.25°×0.25° resolution based on 2008–2012 data.
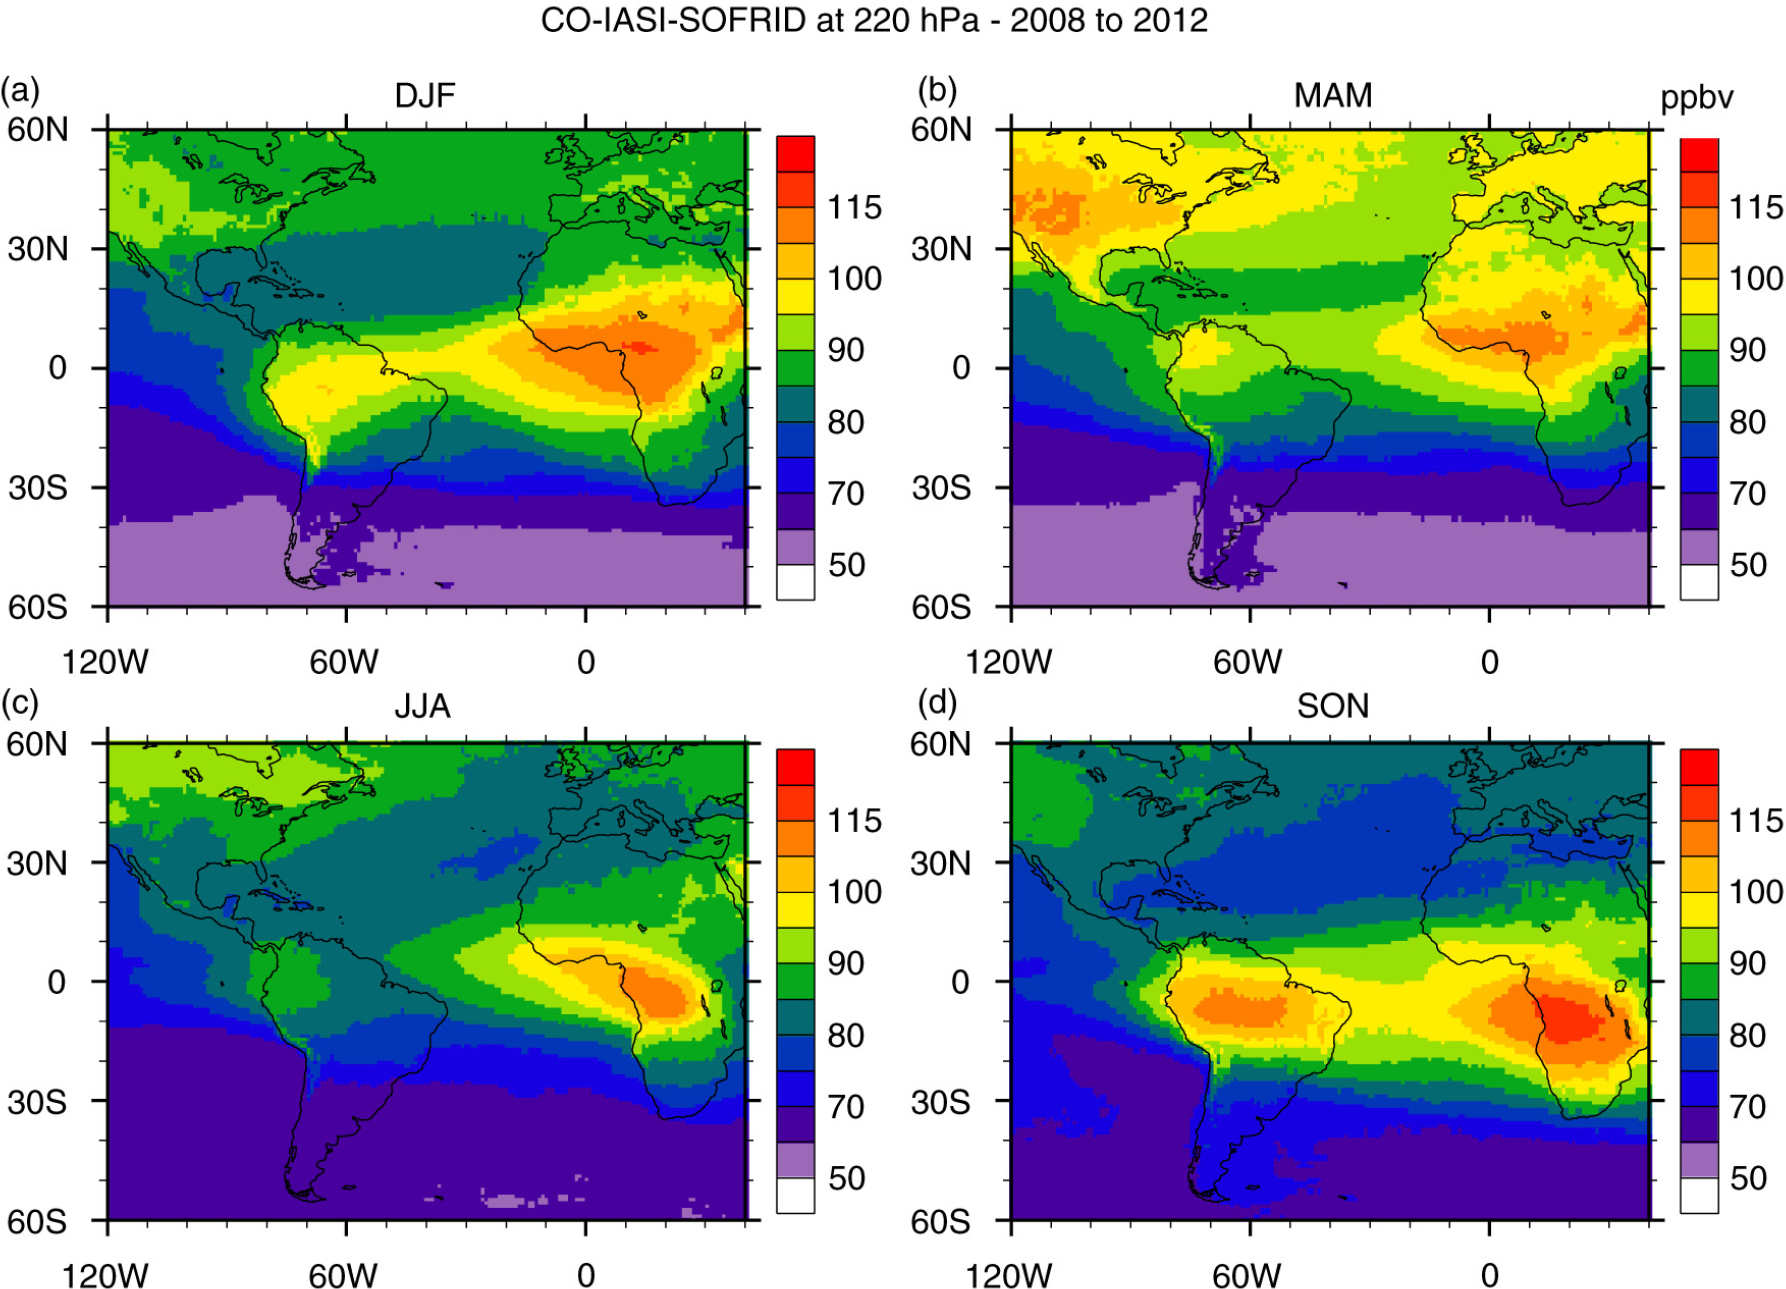
Fig. 11
Seasonal maps of carbon monoxide mixing ratio in ppbv at 220 hPa retrieved from IASI measurements on board MetOp-A satellite: (a) DJF; (b) MAM; (c) JJA; (d) SON based on data from years 2008 to 2012.
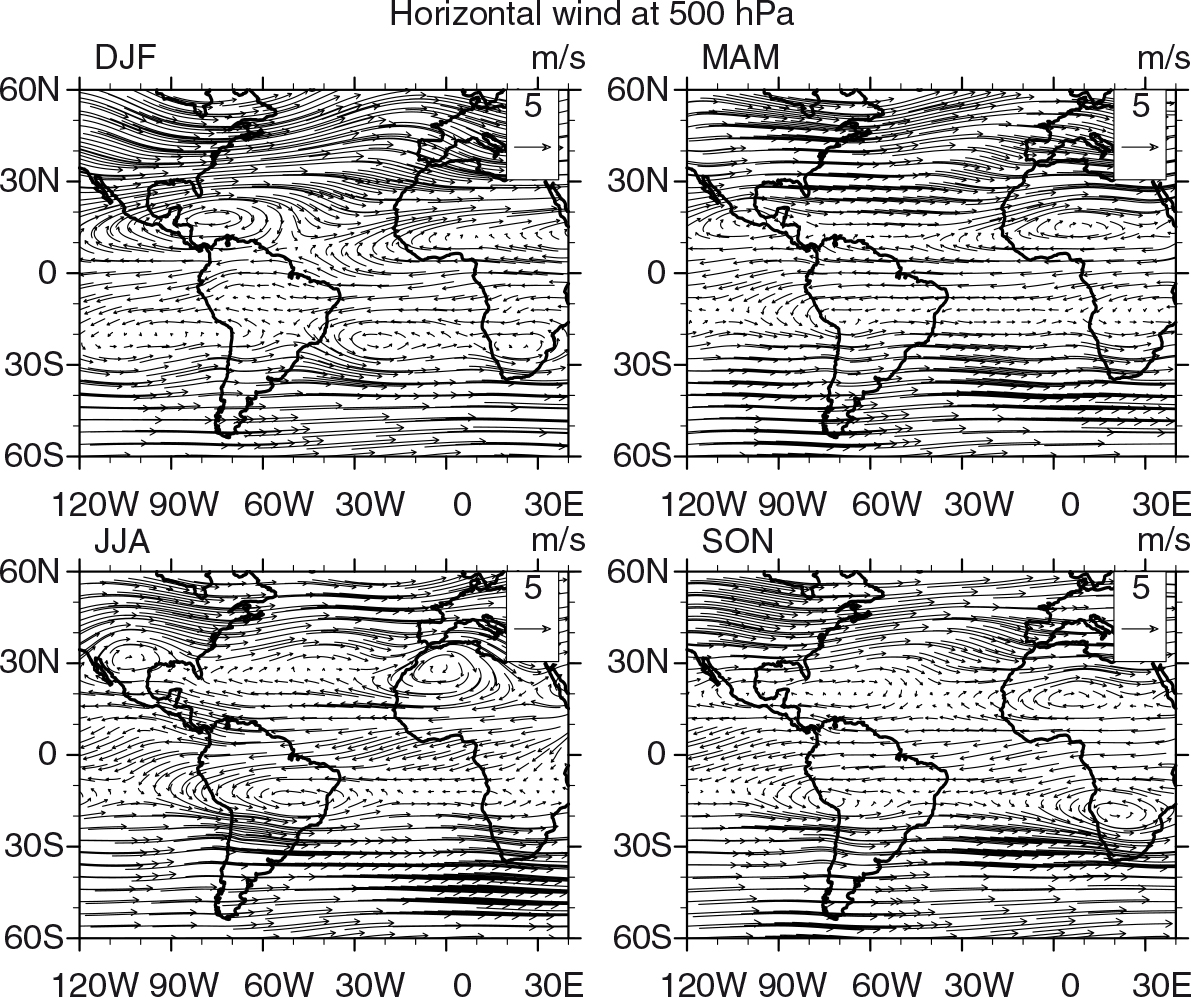
Fig. 12
Horizontal wind vector (m s−1) seasonal maps at 500 hPa from ECMWF ERA-Interim Global Reanalysis at 0.25°×0.25° resolution based on 2008–2012 data.
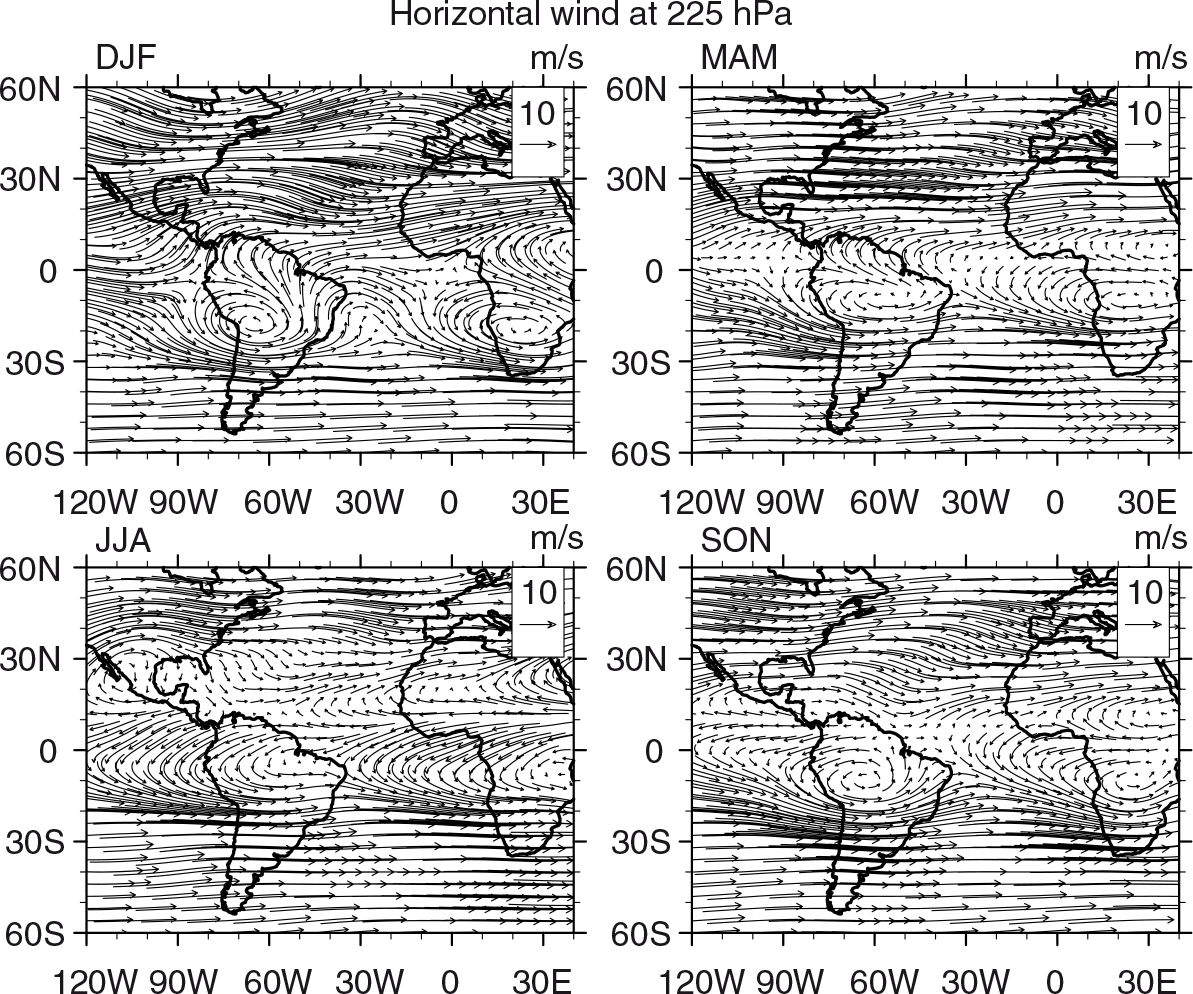
Fig. 13
Horizontal wind vector (m s−1) seasonal maps at 225 hPa from ECMWF ERA-Interim Global Reanalysis at 0.25°×0.25° resolution based on 2008–2012 data.
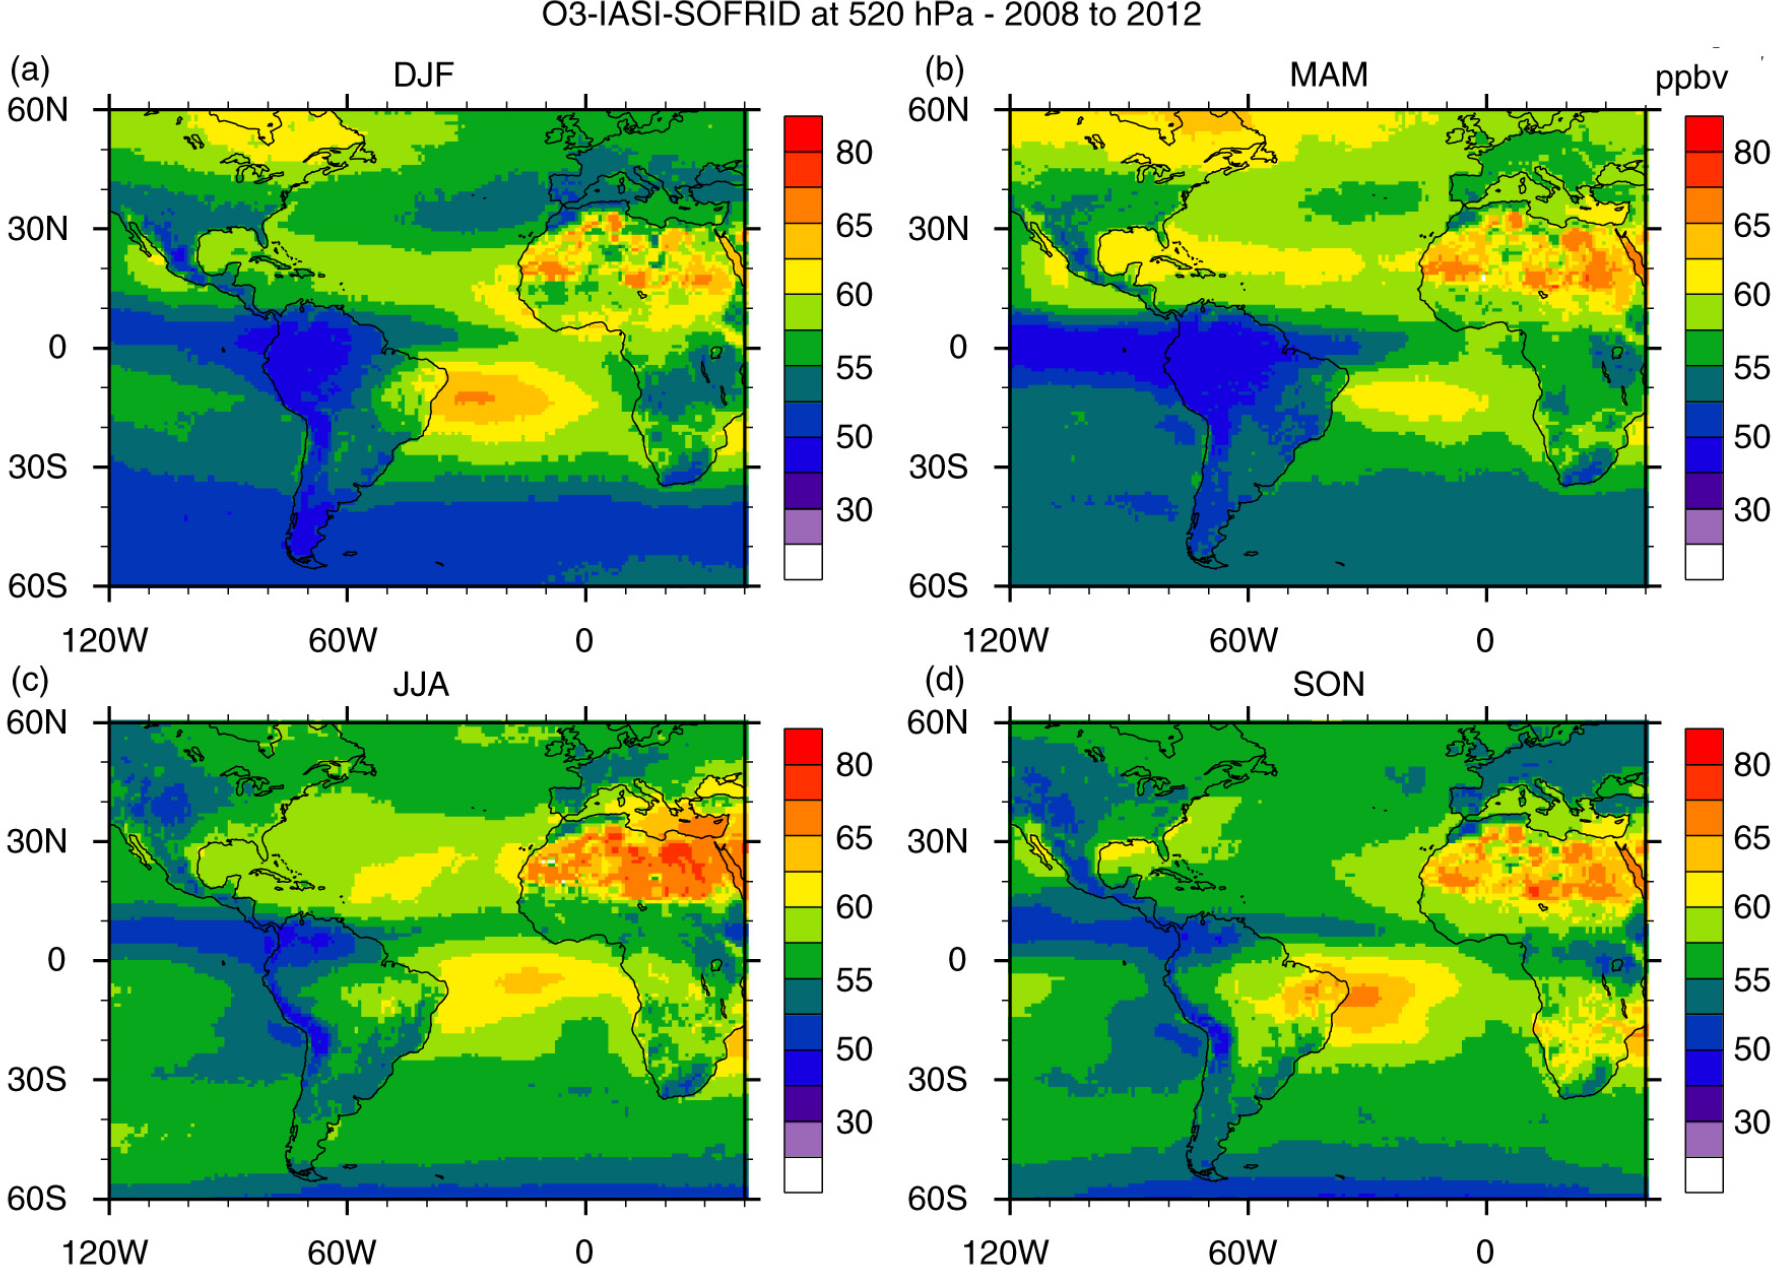
Fig. 14
Seasonal maps of ozone mixing ratio in ppbv at 520 hPa retrieved from IASI measurements on board MetOp-A satellite: (a) DJF; (b) MAM; (c) JJA; (d) SON based on data from years 2008 to 2012.
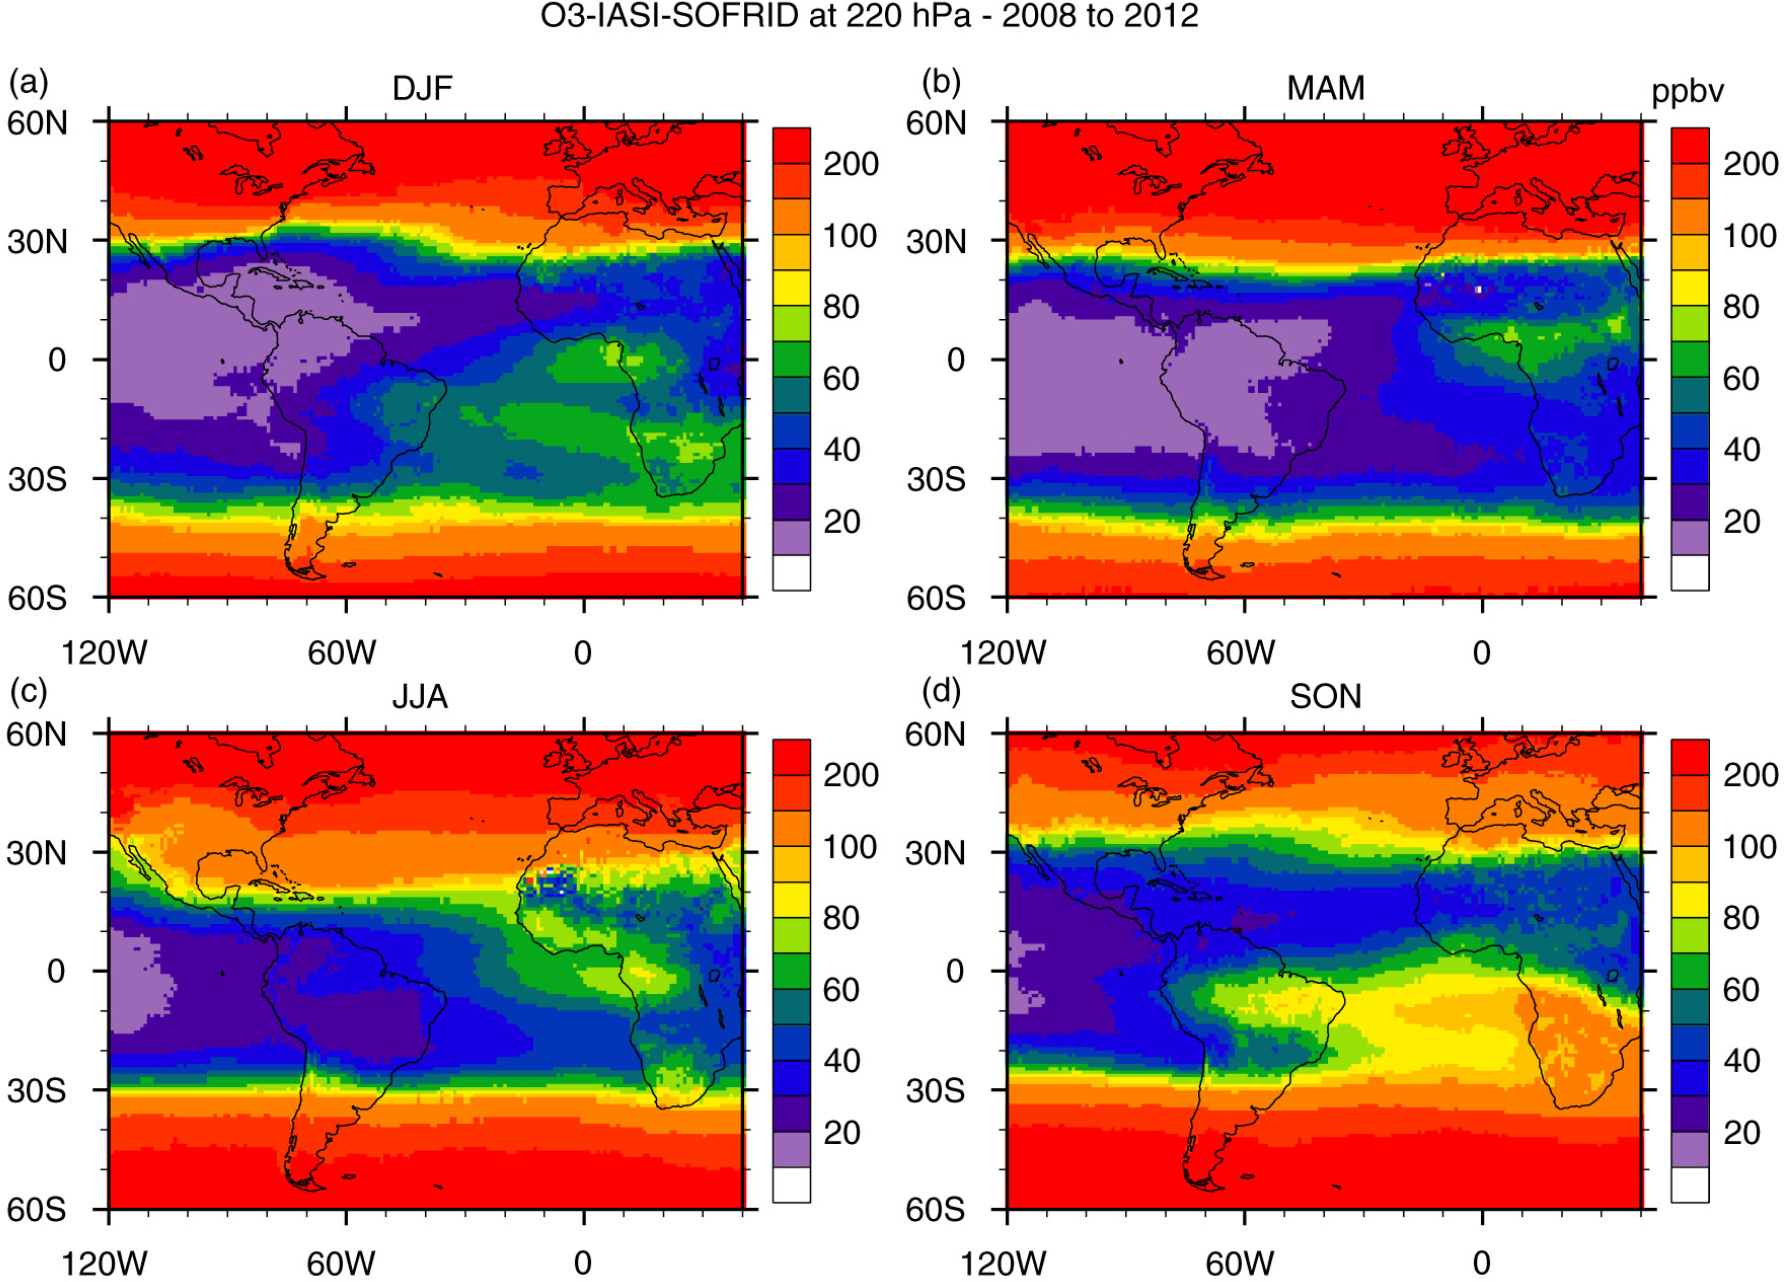
Fig. 15
Seasonal maps of ozone mixing ratio in ppbv at 220 hPa retrieved from IASI measurements on board MetOp-A satellite: (a) DJF; (b) MAM; (c) JJA; (d) SON based on data from years 2008 to 2012.
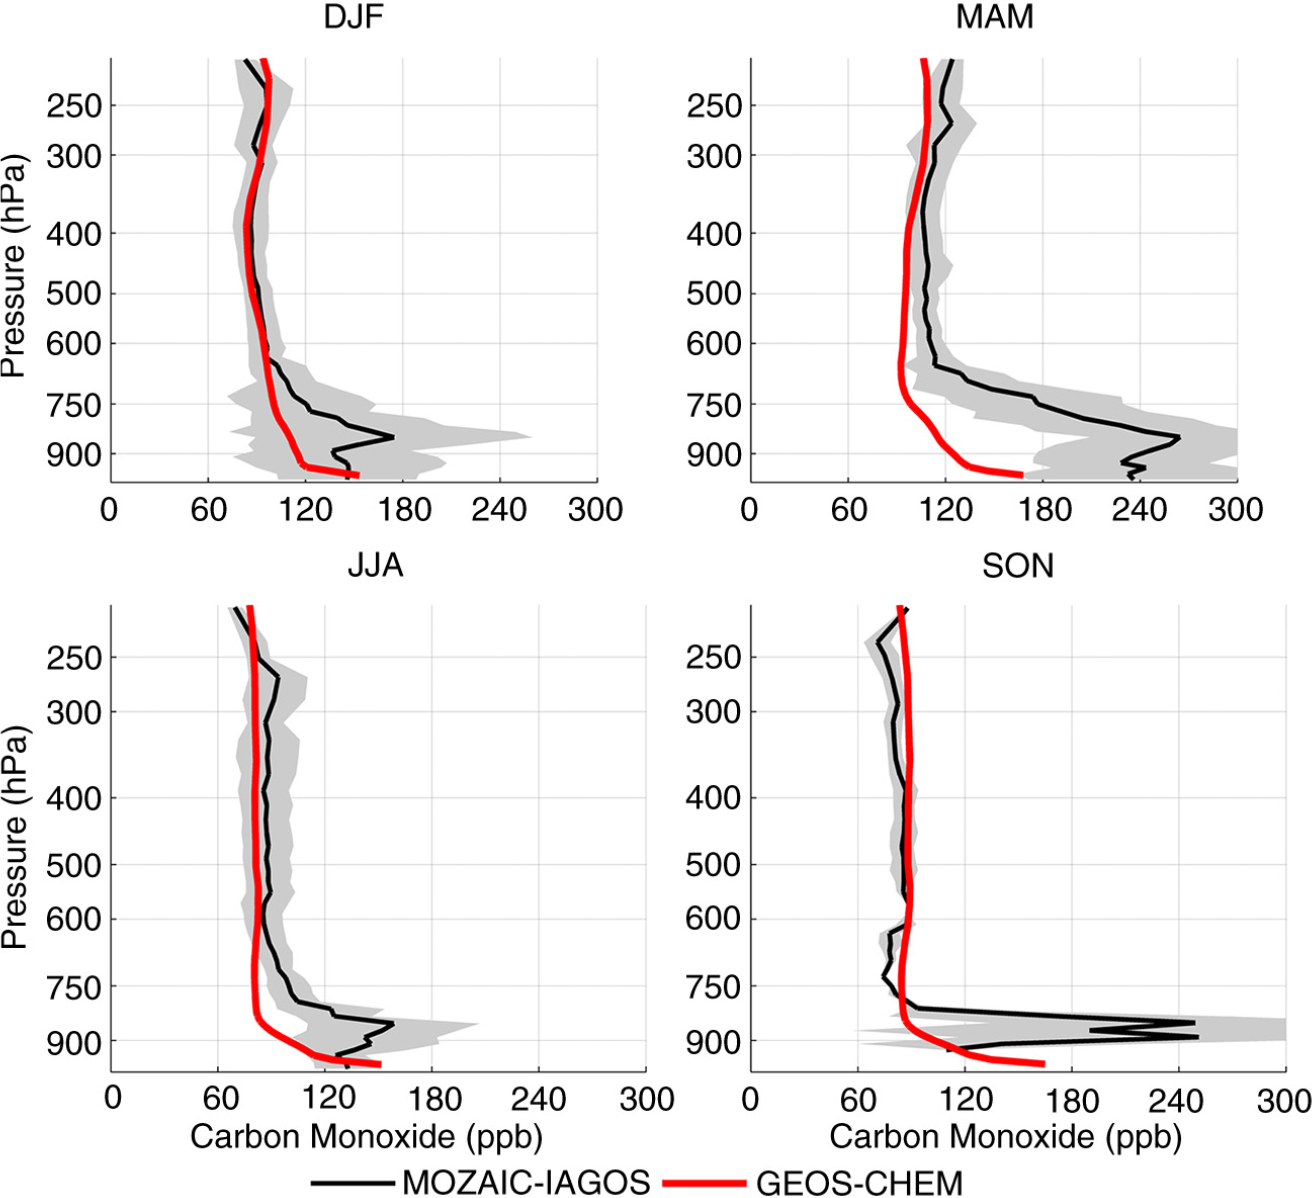
Fig. 16
Comparison of seasonal mean vertical profile of carbon monoxide concentrations measured over Caracas and estimated numerically with GEOS-Chem for the year 2007. Grey shading represents the SD of the measured concentrations and indicates their variability throughout the season.
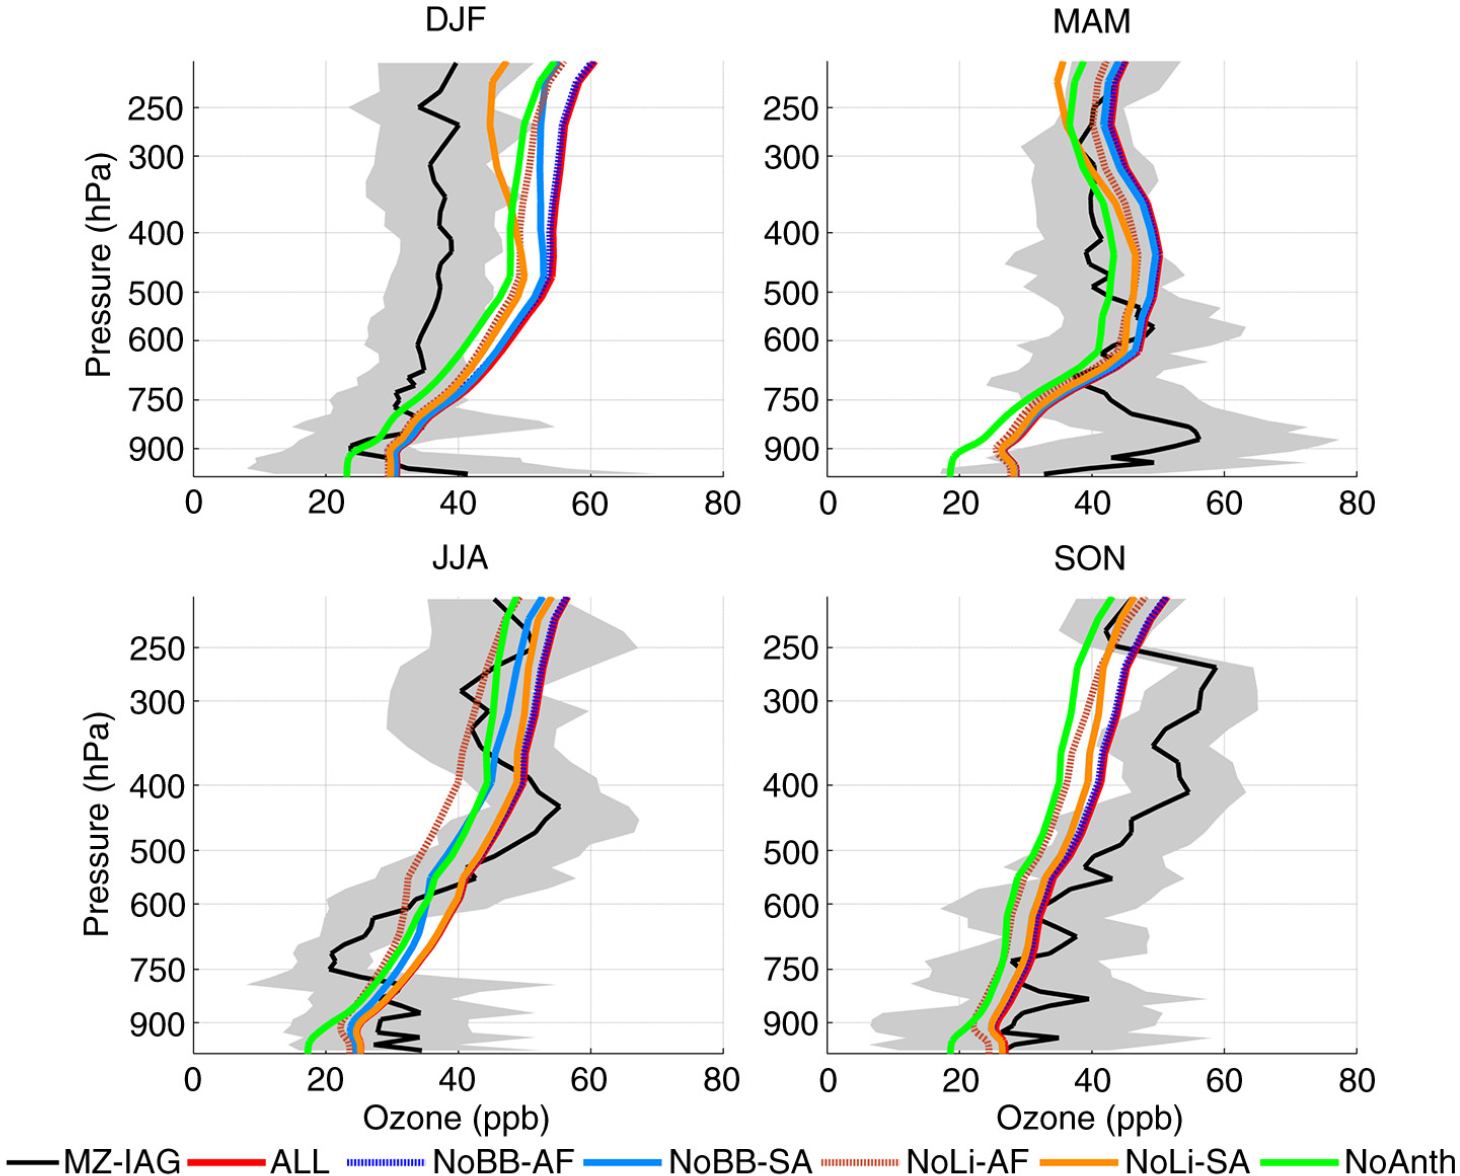
Fig. 17
Comparison of seasonal mean vertical profile of ozone concentrations measured over Caracas and estimated numerically with GEOS-Chem for year 2007. Five different runs were performed, considering all NO x emission sources and turning off NO x emissions from biomass burning and lightning from Africa and South America in sensitivity analysis tests. Grey shading represents the SD of the measured concentrations and indicates their variability throughout the season.
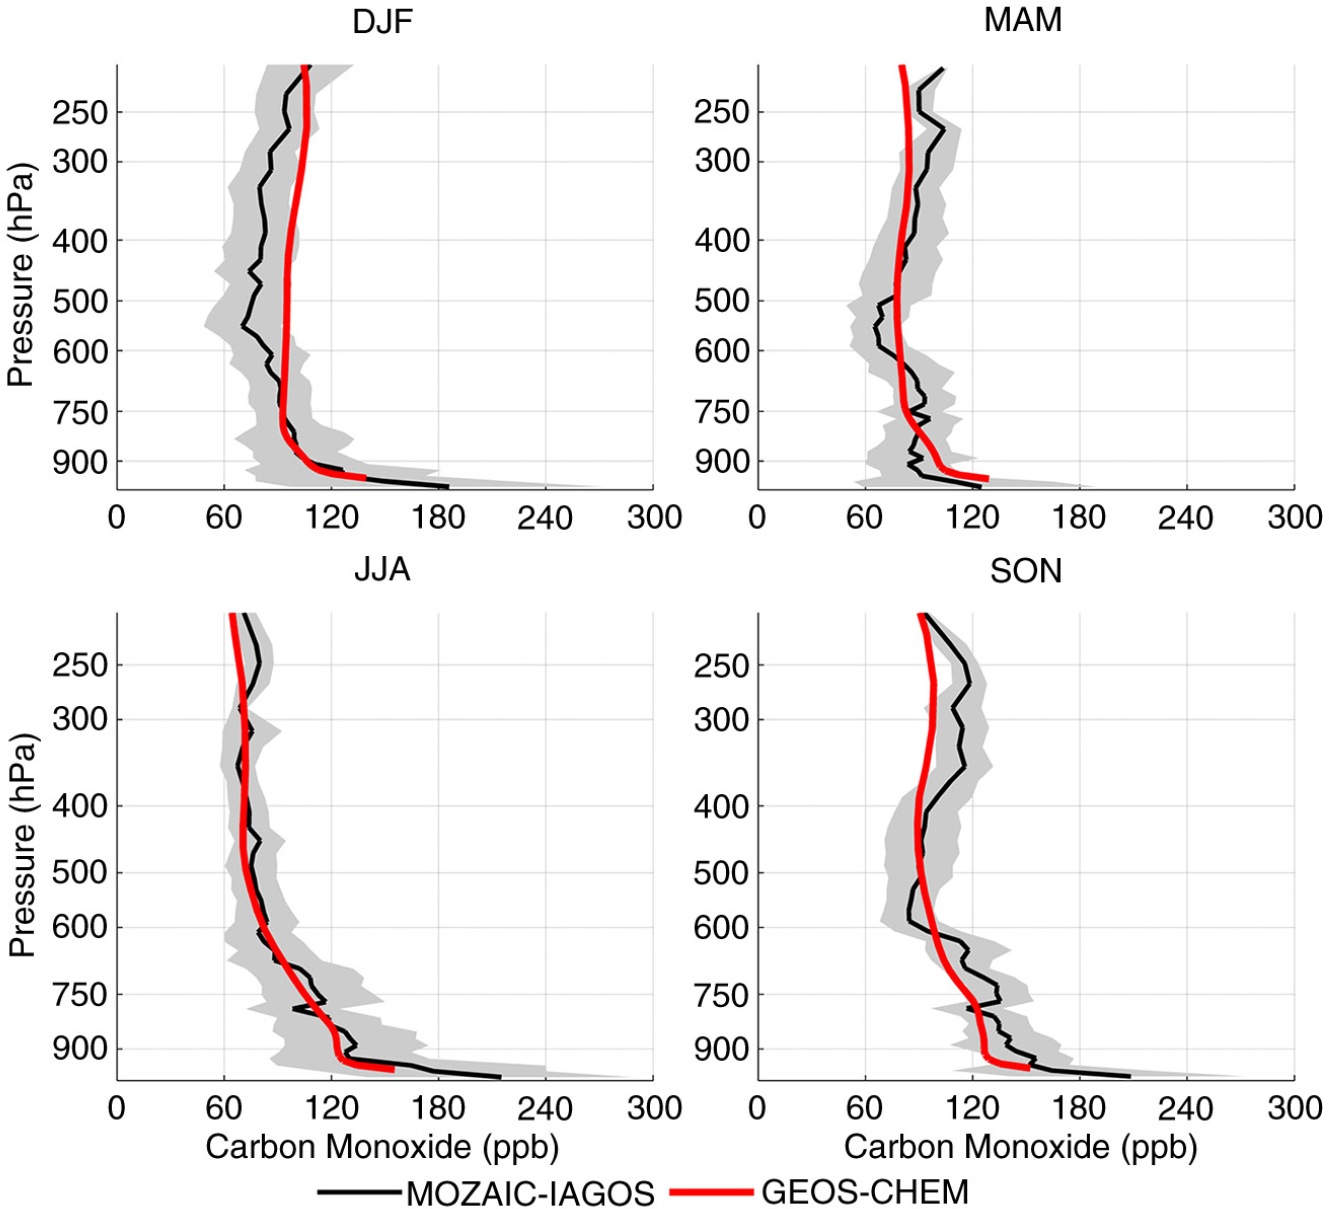
Fig. 18
Comparison of climatological seasonal mean vertical profile of carbon monoxide concentrations measured over Rio de Janeiro and São Paulo and estimated numerically with GEOS-Chem for the representative year 2009. Grey shading represents the SD of the measured concentrations and indicates their variability throughout the season.
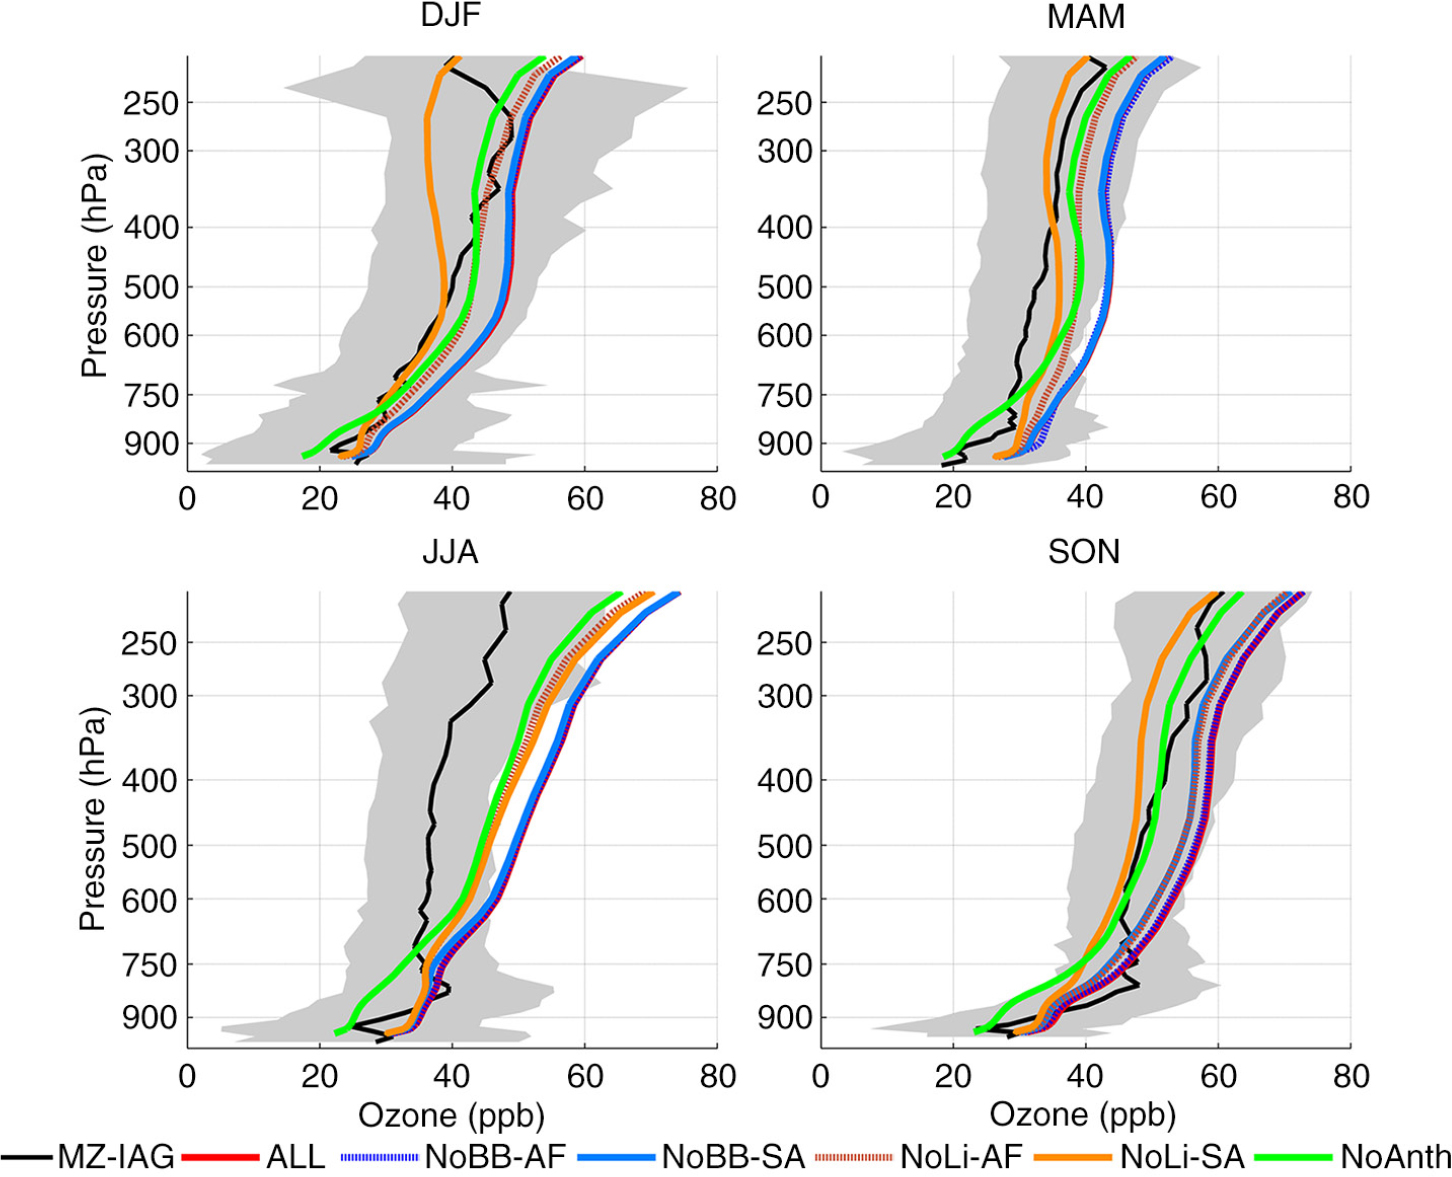
Fig. 19
Comparison of climatological seasonal mean vertical profile of ozone concentrations measured over Rio de Janeiro and São Paulo and estimated numerically with GEOS-Chem for year 2009. Five different runs were performed, considering all NO x emission sources and turning off NO x emissions from biomass burning and lightning from Africa and South America in sensitivity analysis tests. Grey shading represents the SD of the measured concentrations and indicates their variability throughout the season.