Have a personal or library account? Click to login
Instrumentation on commercial aircraft for monitoring the atmospheric composition on a global scale: the IAGOS system, technical overview of ozone and carbon monoxide measurements Cover

Instrumentation on commercial aircraft for monitoring the atmospheric composition on a global scale: the IAGOS system, technical overview of ozone and carbon monoxide measurements

Open Access
|Jan 2015

Figures & Tables

Fig. 1

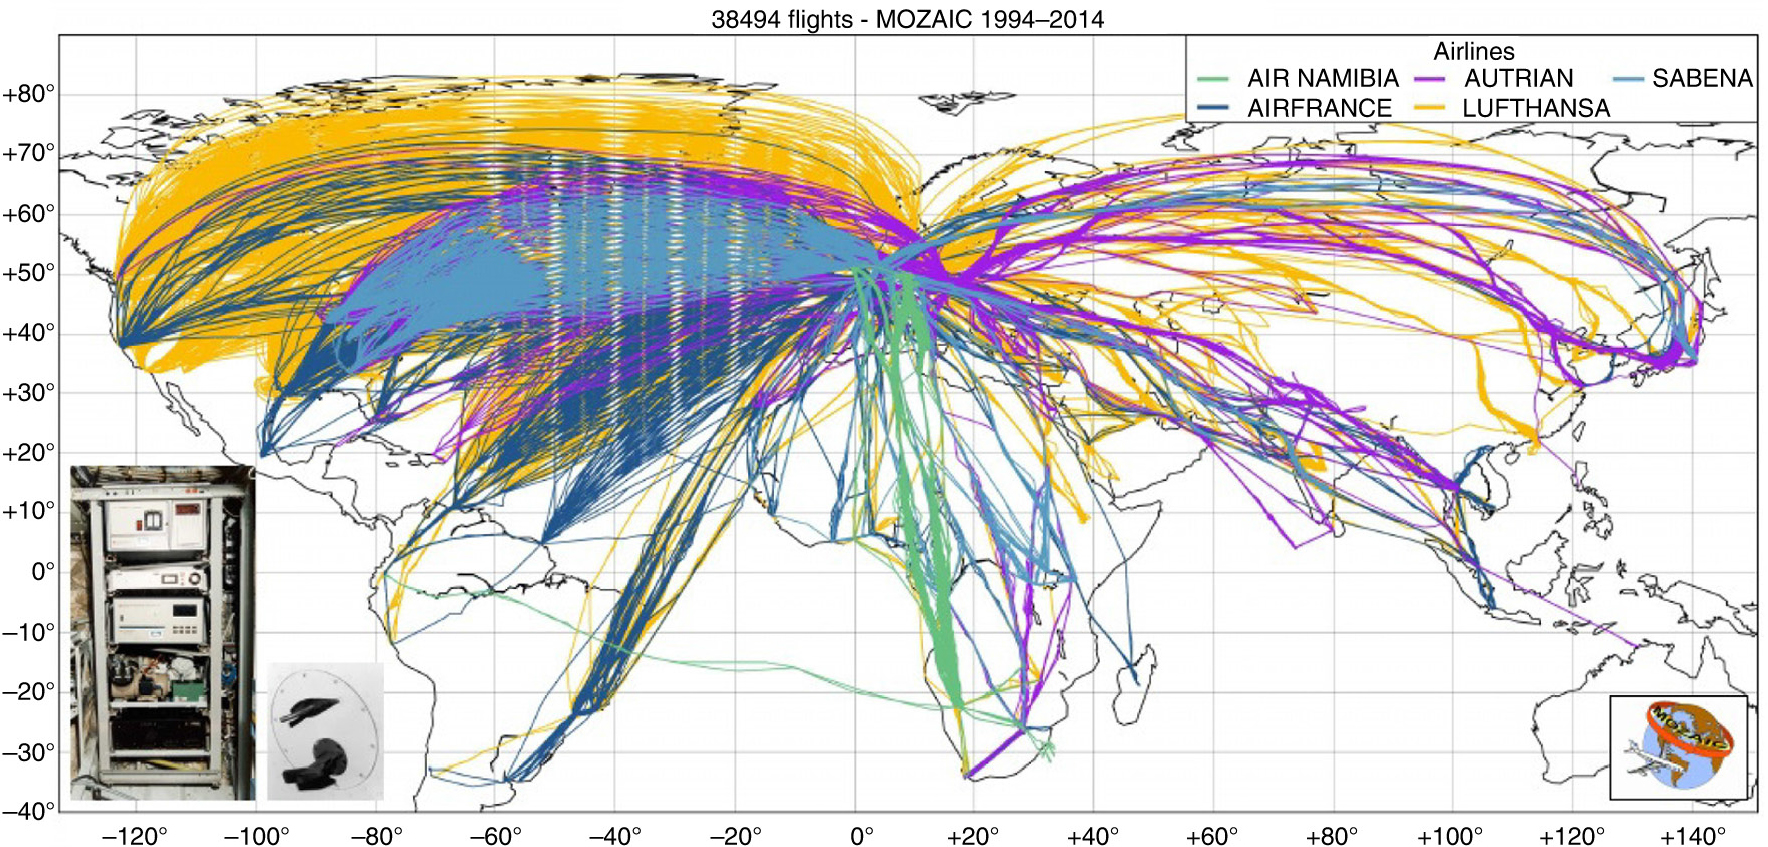
Map showing the spatial coverage of 38494 MOZAIC flights between 1994 and 2014. Airline names are shown on the top right corner, and the MOZAIC system and Inlet are seen on the bottom left corner.

Table 1. Parameters provided by the A340/A330 aircraft system

NamesUnitsPrecisionBaro altitudeam0.3Radio altitudebm0.1gps altitudem0.1Latitude/longitudedeg.0.01Air pressureHPa10Total air temperaturec°C0.25Static air temperatured°C0.25Aircraft ground speedm s−10.1Aircraft air speedm s−10.01Wind speedem s−10.01Wind direction(°)0.01Meridional wind speedm s−10.01Zonal wind speedm s−10.01

[i] aThe baro altitude is the geopotential height computed from the aircraft static pressure measurements using the International Civil Aviation Organization (ICAO, www.icao.int) standard atmospheric profile.

[ii] bRadio altitude is the altitude above surface, valid only below 2500 m.

[iii] cTotal air temperature (also named stagnation temperature) is measured by a temperature probe mounted in Rosemount housing on the surface of the aircraft.
[iv] dThe Static air temperature is calculated by aircraft computer, using the Mach number and the total air temperature.

[v] eWind speed and direction are calculated by the aircraft Air Data Computer.

Fig. 2

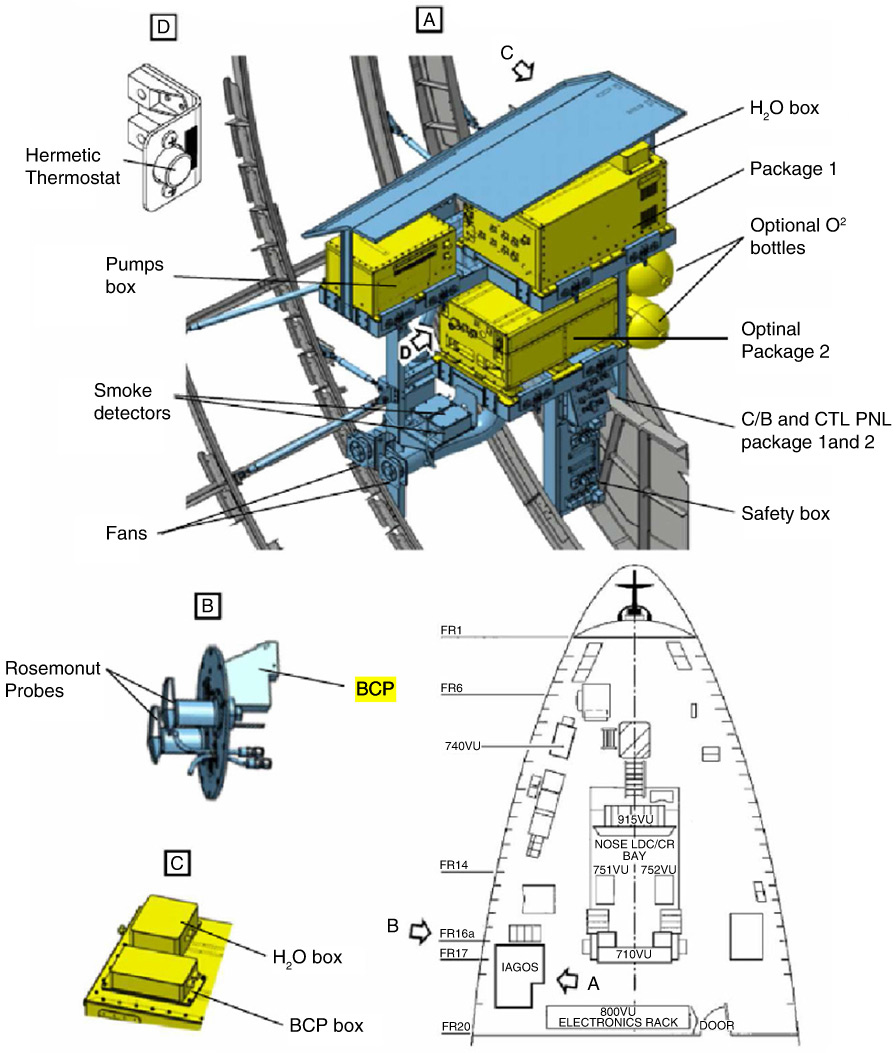
Scheme of the IAGOS system mounted on an Airbus aircraft (Package1+Optional Package2).
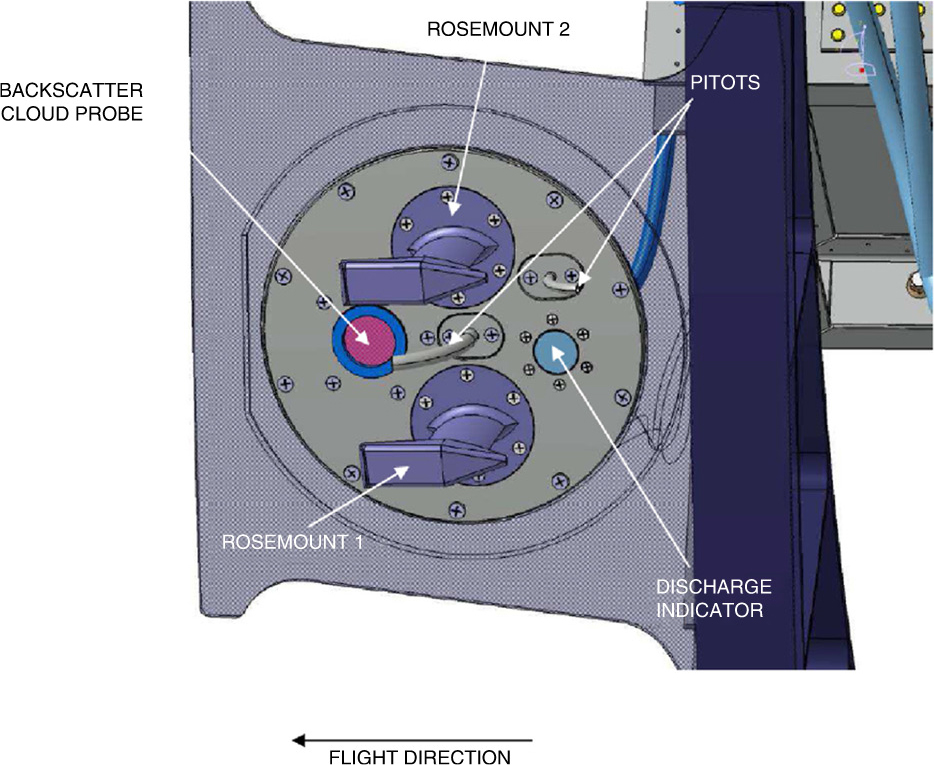
Fig. 3

Scheme of the IAGOS inlet plate fixed to aircraft fuselage.

Table 2. Aircraft currently equipped with the IAGOS instruments
AirlineTypeTail signInstalled in:DateLufthansaA340D-AIGTHamburg/FrankfurtJuly 2011China AirlinesA340B-18806TaipeiJune 2012Air FranceA340F-GLZUParisJune 2013Cathay PacificA330B-HLRXiamenJuly 2013IberiaA340EC-GUQTel-Aviv/MadridFebruary 2014LufthansaA330D-AIKOMaltaMarch 2015
Fig. 4

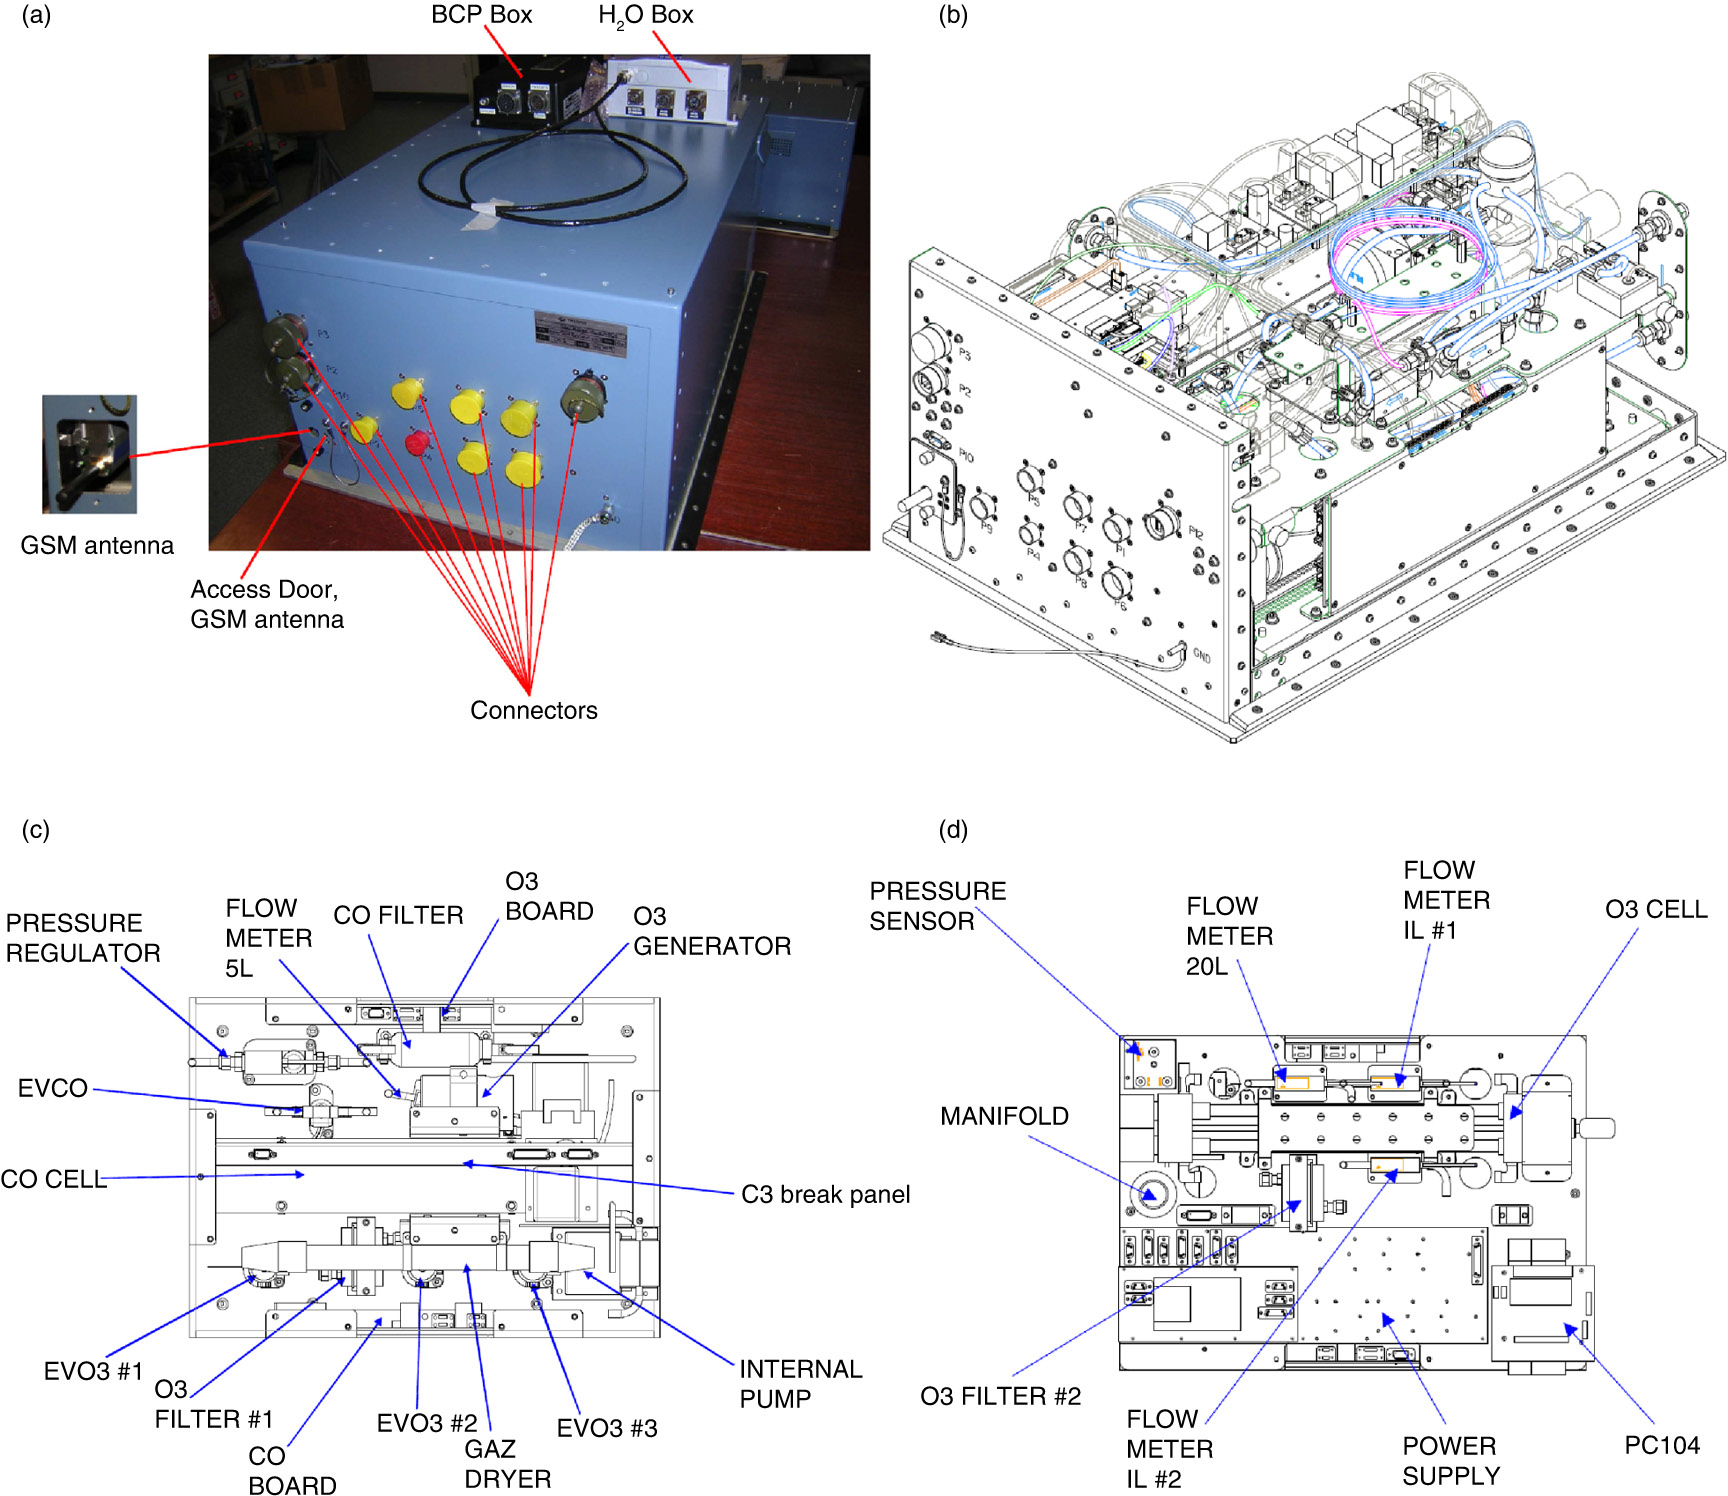
Package1 picture and schemes. Without H2O and BCP boxes, Package1 weighs 35 kg and the dimensions are 630×450×314 mm. The main elements are listed and described in Table 3. (a) Photo of Package1. BCP box and H2O box are fixed on top. The GSM antenna for data transmissions is seen on the connectors face bottom left side. (b) Scheme of Package1 inside. (c) Scheme of the upper shelf viewed from the top. (d) Scheme of the lower shelf viewed from the top.

Table 3. List and description of Package1 subassemblies
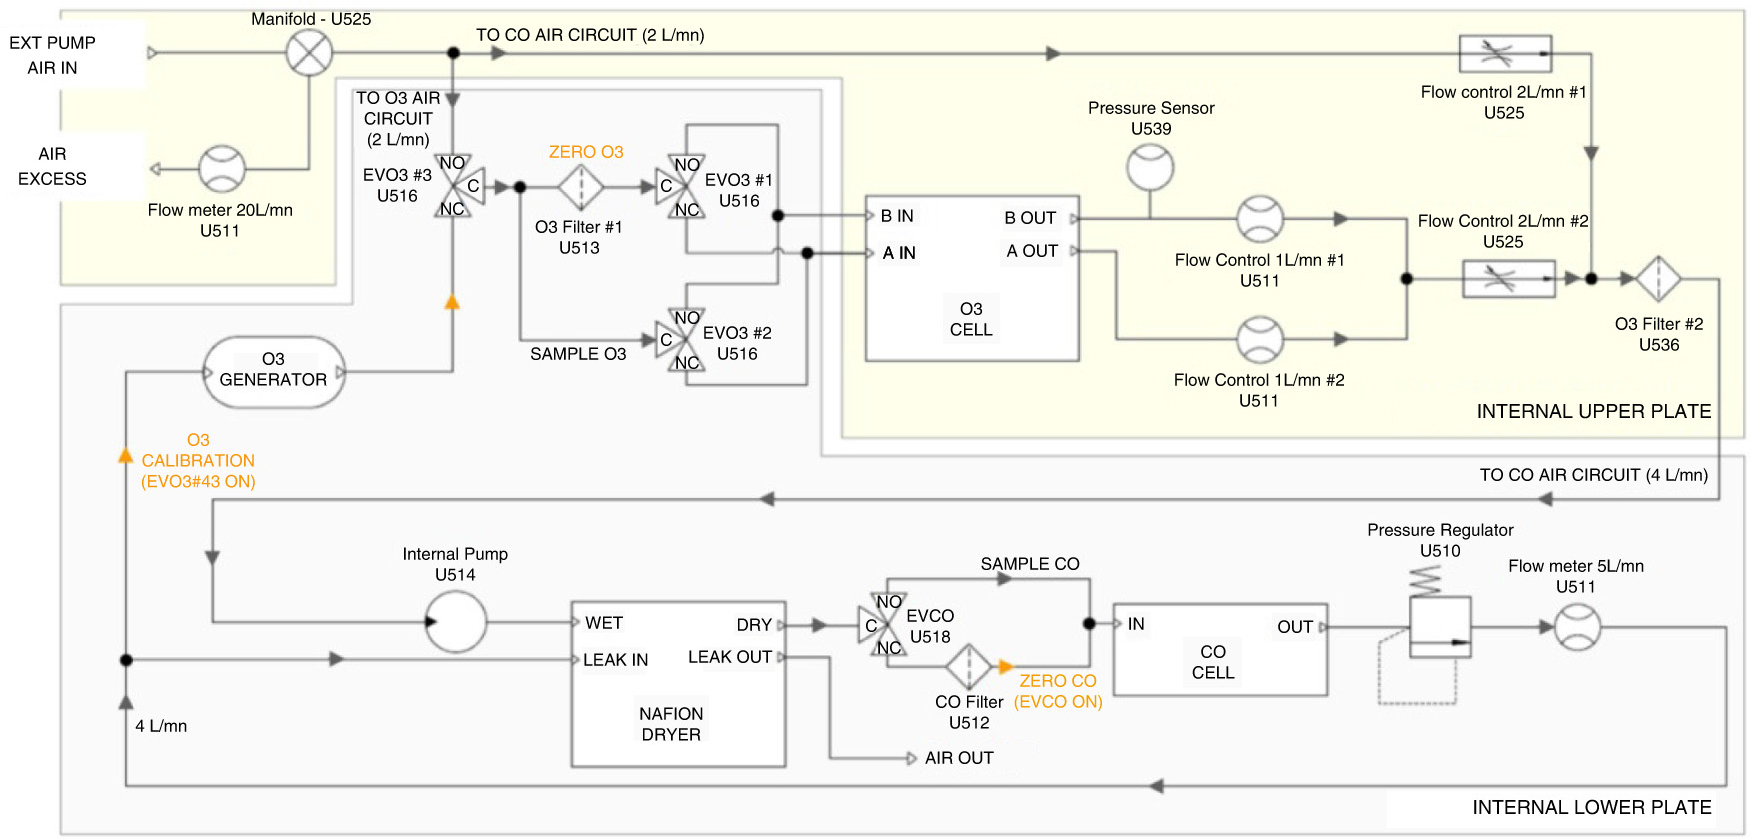
Main elementFunction and descriptionUpper shelf O3 deviceO3 absorption cells, UV source, UV detectors (Thermo Scientific for Model 49) O3 filterO3 filter (MnO2) for O3 zeroing (Thermo Scientific, PN 14697) Power supply boardSeveral protected voltages to the different elements (LGM Ingénierie) Data acquisition system PC1044 PC104 cards; Diamond Systems: Athena CPU, Serial ports(Relays Ballard Technology: PM429 for Arinc-429) FlowmetersCDK FSM series ManifoldTeflon bottle connected with Teflon tubing (Bioblock 15032) Pressure sensorPressure monitoring of the O3 cells (Thermo Scientific PN 9877) Flow controlsTeflon 1/8 inch tubes with length adjusted to provide 2 L min−1 for O3 path and 4 L min−1 for CO path (see blue and pink spiral tubing in Fig. 4b)Lower shelf CO deviceCO absorption cell, IR source, IR detector with its thermal regulation card, CO cell motor (Thermo Scientific for Model 48 Trace Level) Internal pumpKNF and NPK09 O3 processing boardControl and signal acquisition/processing for O3 device (LGM Ingénierie) CO processing boardControl and signal acquisition/processing for CO device (LGM Ingénierie) O3 generatorUsed for internal O3 calibration check (Thermo Scientific, FC001) Air drierNafion multitube for drying the air prior to the CO cell (Permapure PD100T-12) Gas pressure regulatorPressure regulation (2 bar) in the CO cell (Bronkhorst P702C-GAC-22-V-005A) O3 filterTo remove atmospheric O3 before CO measurements (Thermo Scientific, PN 14697) CO filterSofnocat catalyst from Molecular Products Ltd. filled in Swagelock 304L-HDF4-75-PD (75 cm3) ElectrovalvesThree Teflon valves for O3 (Teqcom), one stainless steel valve for CO (Thermo Scientific, 738) GSM modemWorldwide data transmission, four bands Wavecom, Package1 GSM Modem FastRack (evolution planned for 2015 with 3G Modem)
Fig. 5

Package1 air flow diagram within the upper and lower plates.
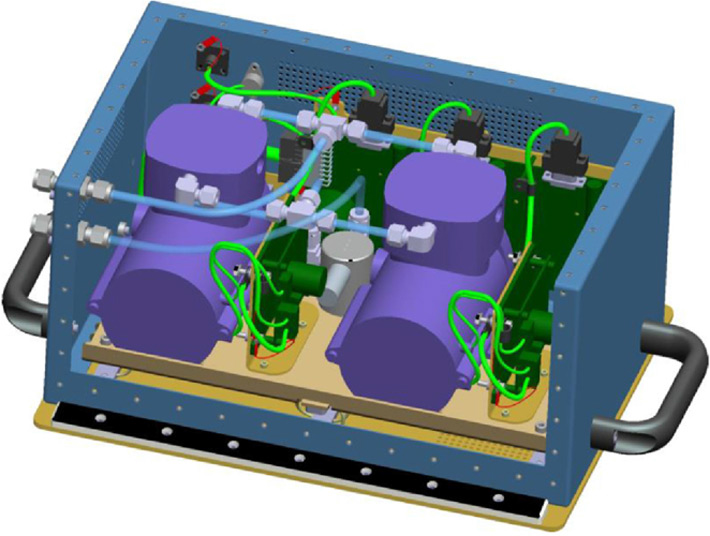
Fig. 6

IAGOS pump box – the box contains two pumps in parallel (see text), the electronic control cards and a Teflon solenoid valve. All tubing are Teflon-coated with a 1/4 inch diameter.

Table 4. Measured parameters stored during flights by the Package1

File Name ‘Refvol’ is P1 SNContentNumber of parameterFrequencyAYYYYMMDDHHMNSSIN.txtCO zeroing parameters810–20 minCYYYYMMDDHHMNSSIN.txtBCP data174 sDYYYYMMDDHHMNSSIN.txtCO module functional parameters111 minEYYYYMMDDHHMNSSIN.txtFlight chronological events2n/aHYYYYMMDDHHMNSSIN.txtH2O and T voltages34 sMYYYYMMDDHHMNSSIN.txtAircraft parameters144 sSYYYYMMDDHHMNSSIN.txtPump Box flow31 minVYYYYMMDDHHMNSSIN.txtCO measurements31 sXYYYYMMDDHHMNSSIN.txtO3 and pressure measurements34 sYYYYYMMDDHHMNSSIN.txtO3 module functional parameters111 minZYYYYMMDDHHMNSSIN.txtO3 in-flight calibration levels92 h

[i] YYYY, year; MM, month; DD, day; HHMMSS, hour, minutes, seconds in UTC (take-off time); IN, instrument number (Package1).

Table 5. Summary of the IAGOS O3 and CO instrument characteristics
O3COTechniqueUV absorptionIR correlationNoise and integration time±2 ppbv; 4 s±5 ppbv; 30 sPrecision±2%±5%Horizontal resolution (cruise speed 250 m s−1)1 km7.5 kmVertical resolution (max vertical speed 15 m s−1)max 50 mmax 450 m
Fig. 7

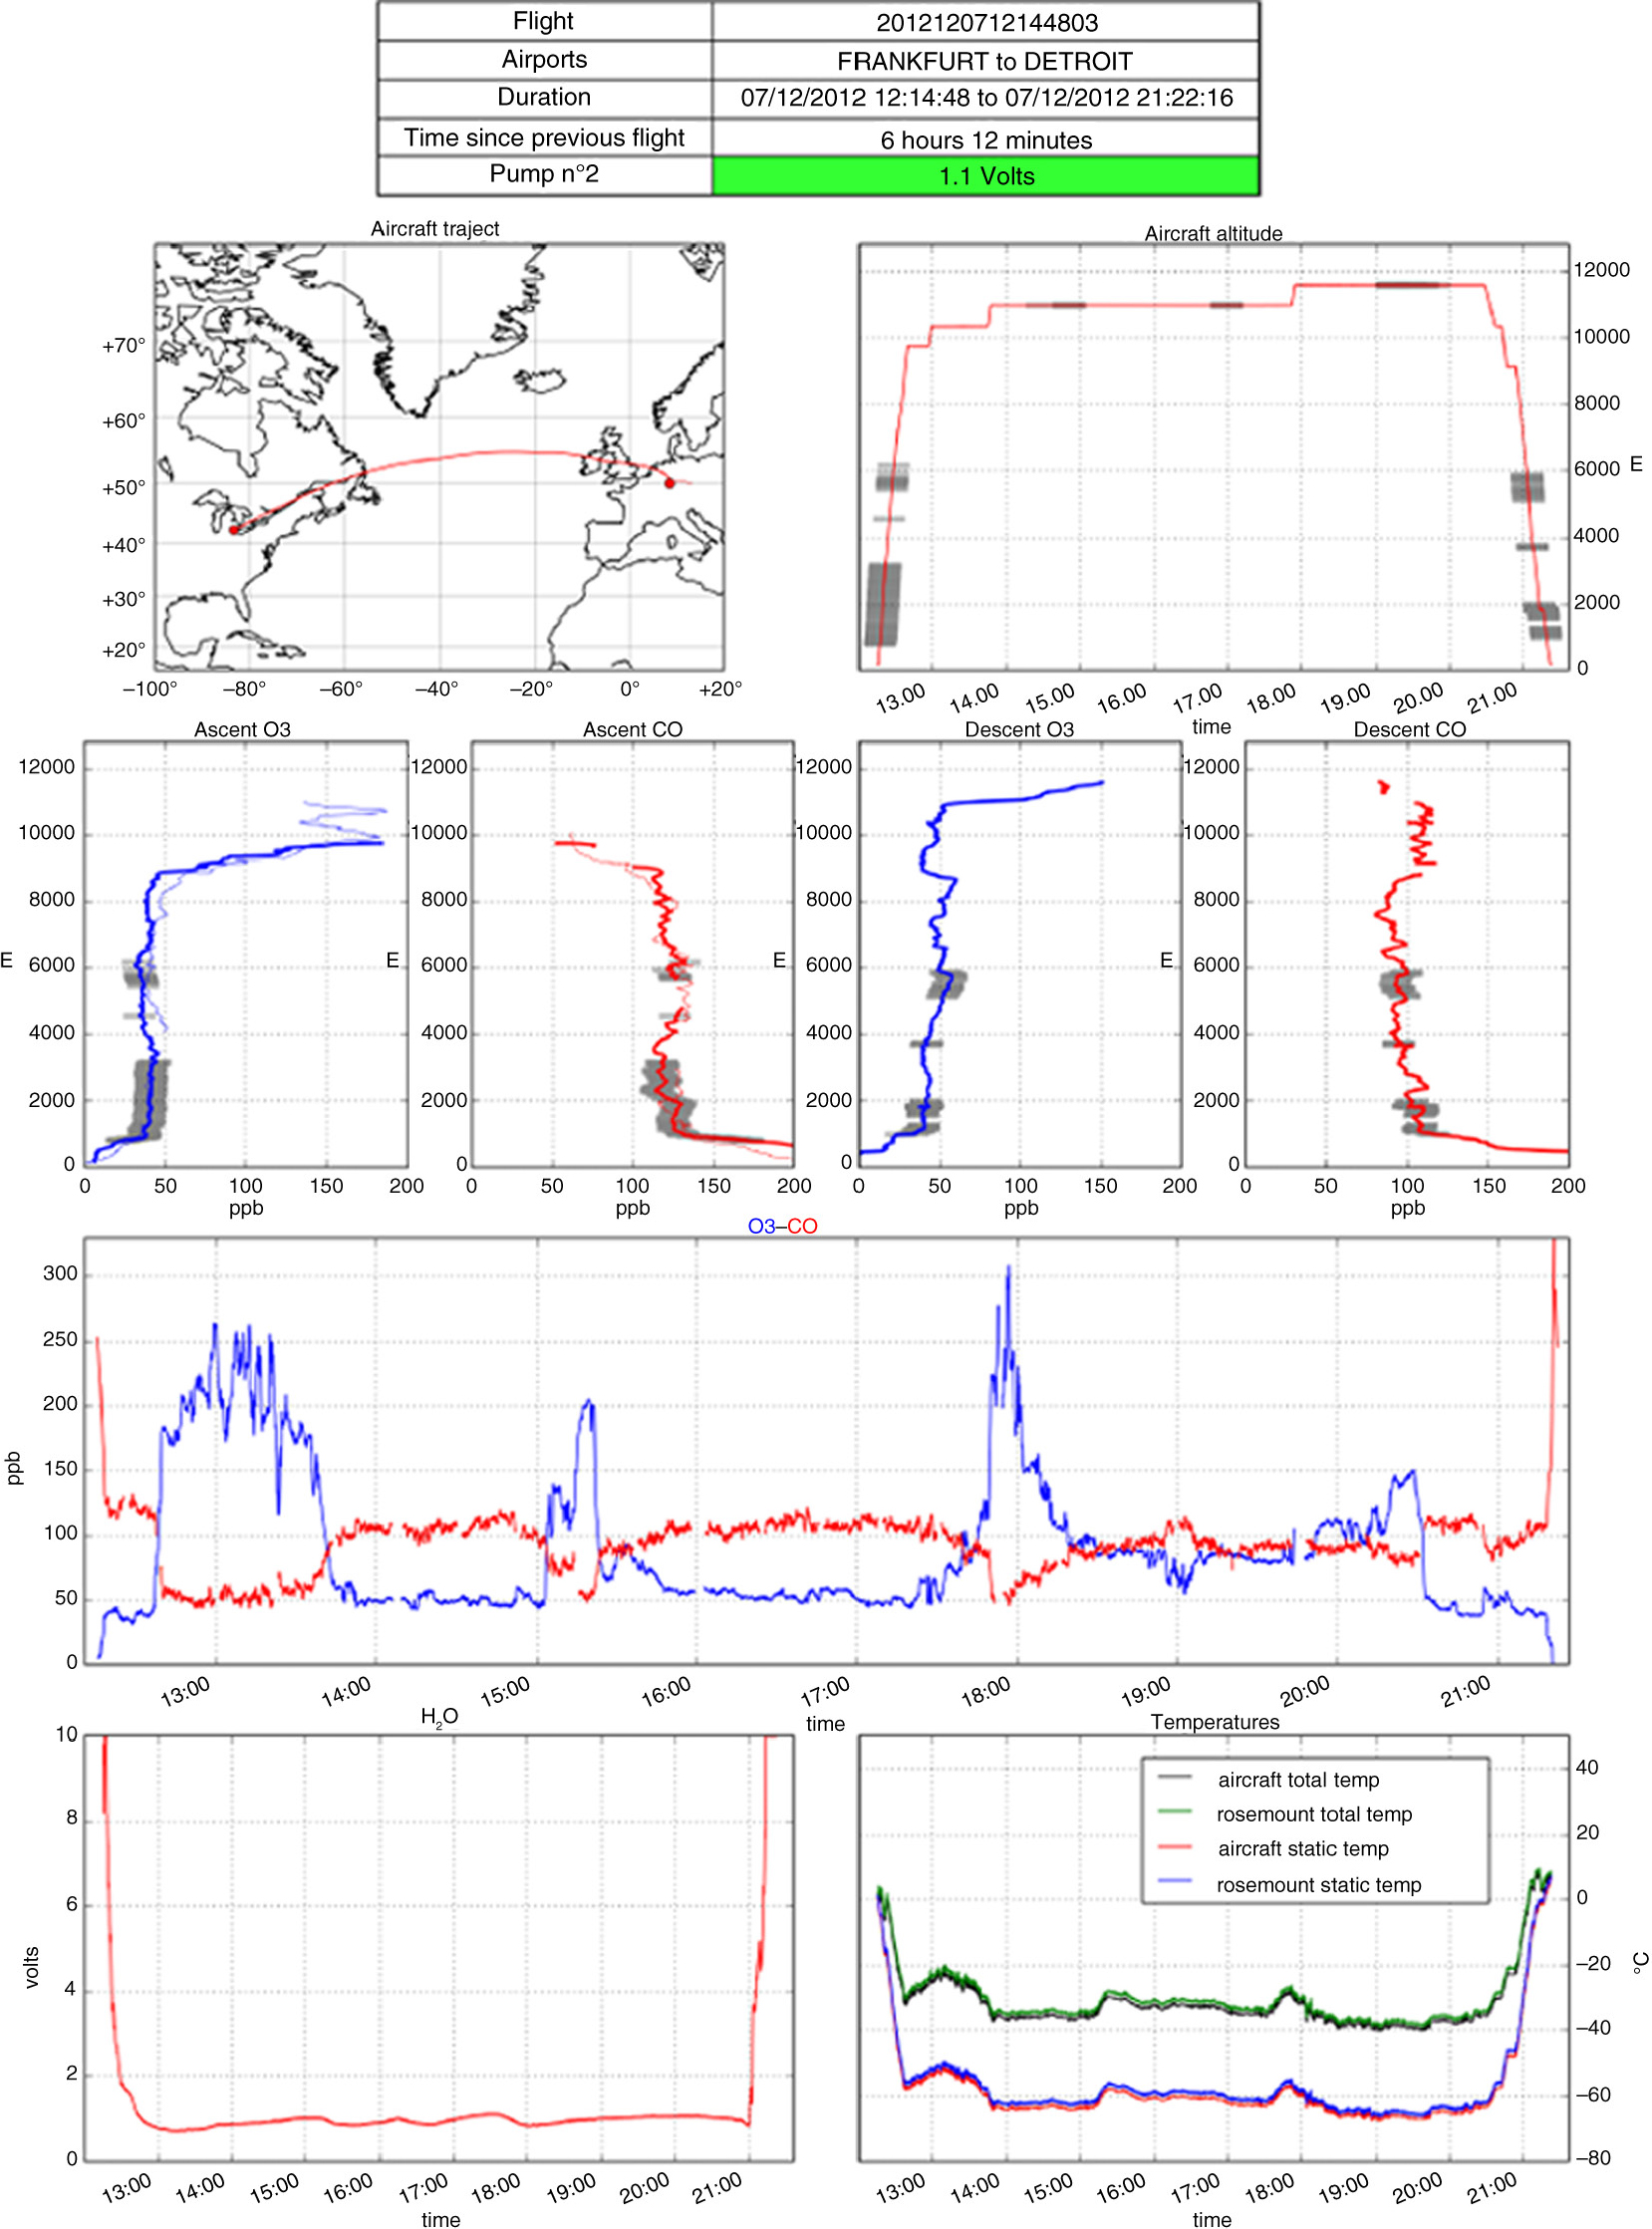
Quick-look example. On top, flight information and external pump flow check (here displayed in Volts). Graphs of the flight route, flight altitudes, O3 and CO vertical profiles and time series with clouds detected by the BCP shaded in grey. On the profiles, the thin dash lines represent the profile of the previous flight. On bottom, time series of H2O sensor voltage, and the total and static temperatures measured by the aircraft and by H2O sensor in its Rosemount housing (raw data not calibrated).
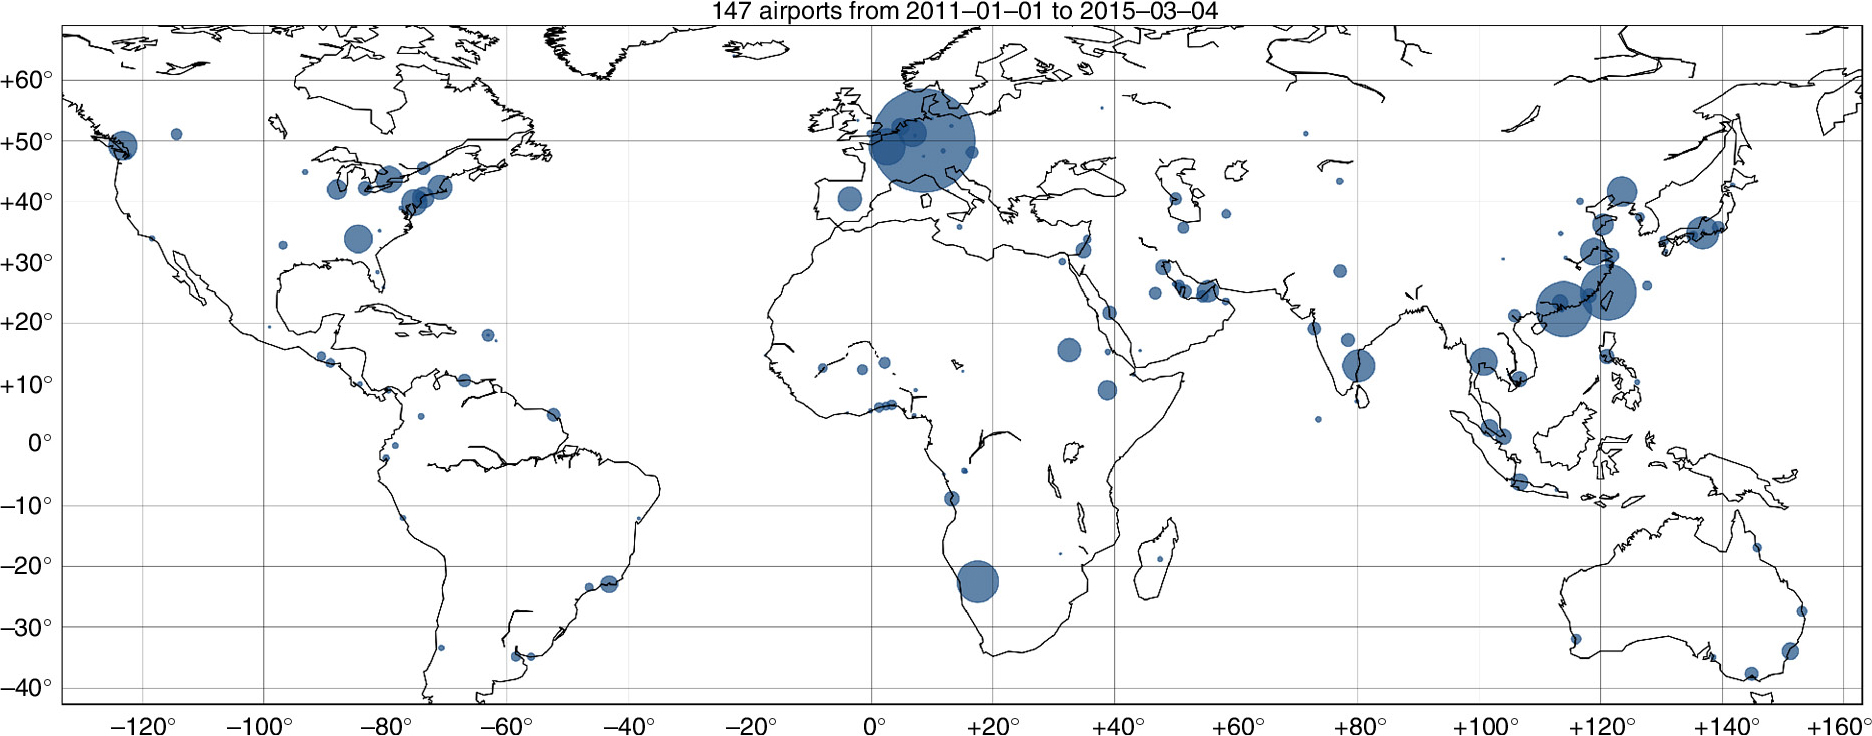
Fig. 8

The combined MOZAIC and IAGOS fleet have landed in more than 147 different airports around the world since July 2011. Symbol sizes are proportional to the total number of landings and takeoffs for a location. Monthly map of flights are available on the IAGOS website (www.iagos.fr/web).
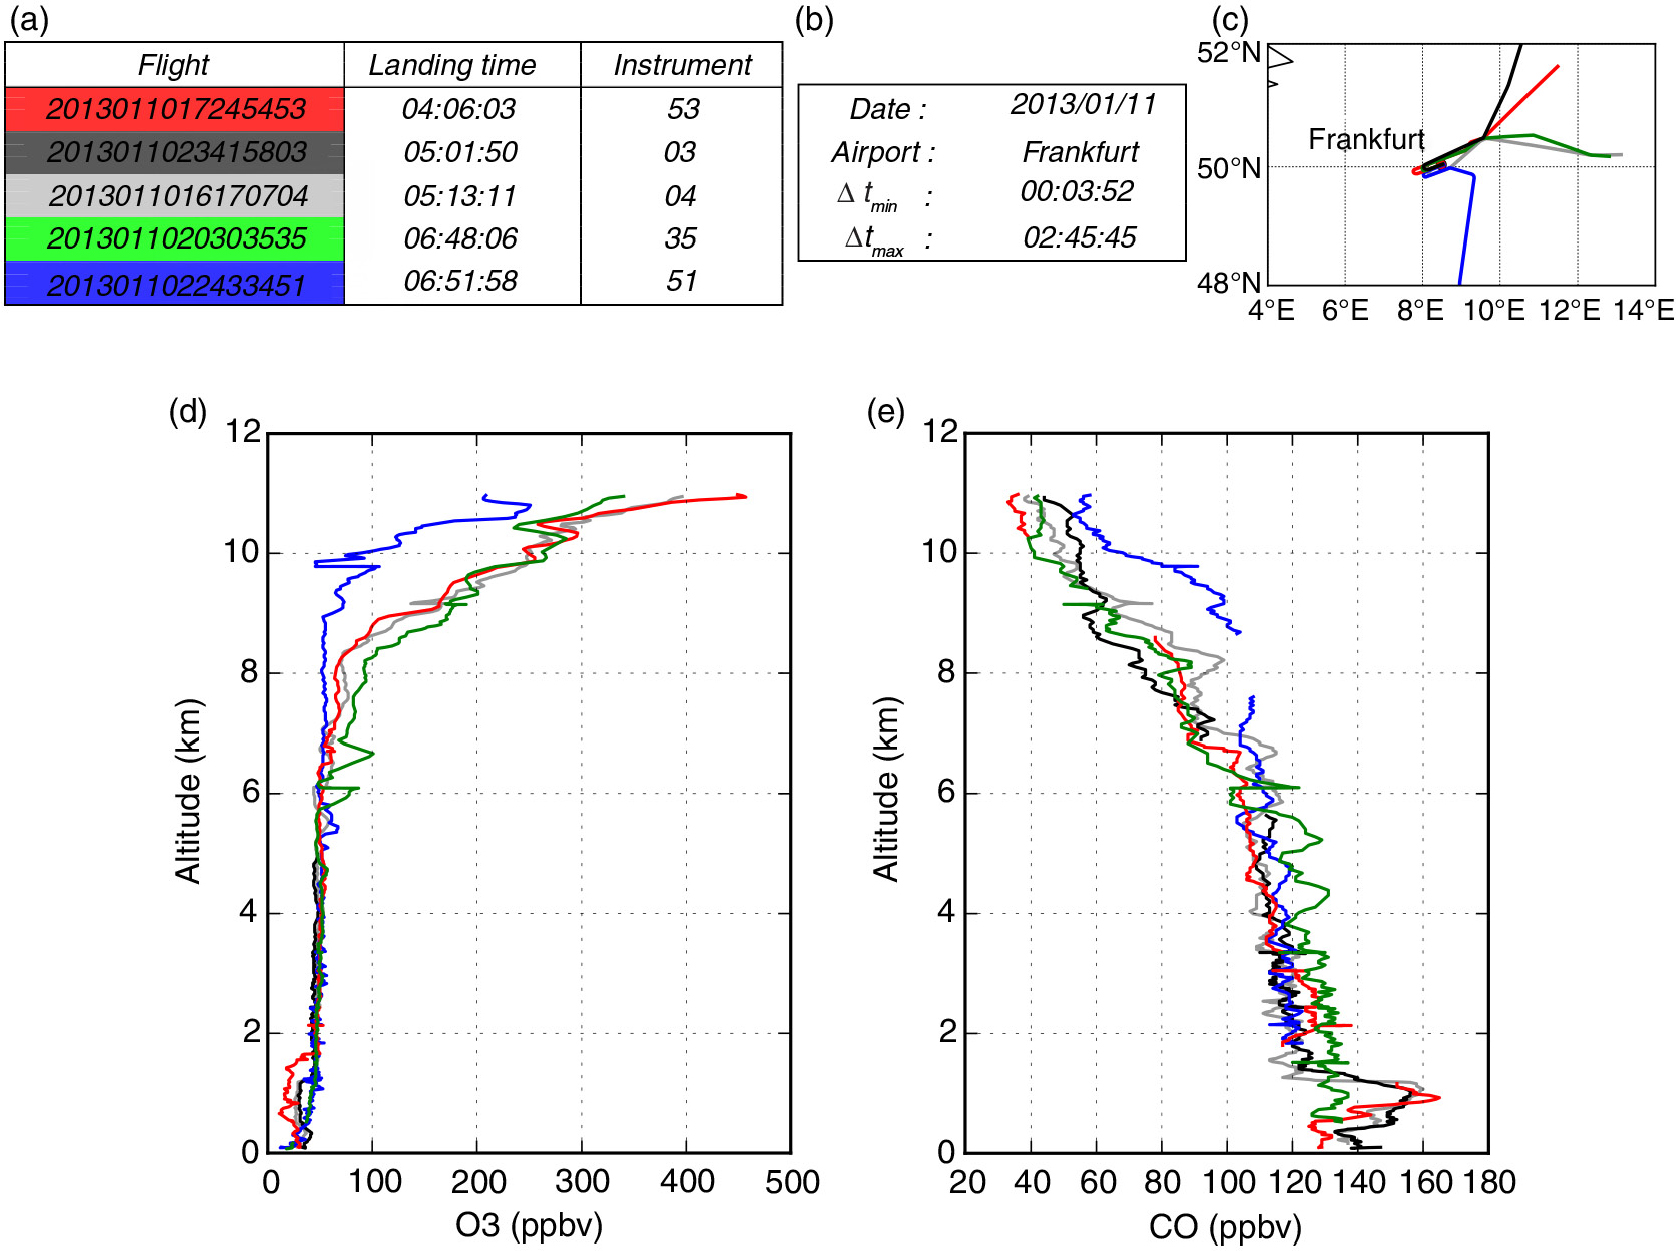
Fig. 9

Examples of flight profile intercomparison automatically made available within the IAGOS database as soon as at least two flights land or take-off within a 3-h time window at the same airport. 53, 35 and 51 are the MOZAIC instruments, and 03 and 04 are the IAGOS instruments. Colours found in the profile plots correspond to the flight in the table on top. (a) Flight landing times at Frankfurt, (b) quick information, (c) routes around Frankfurt, (d) O3 profile and (e) CO profile.
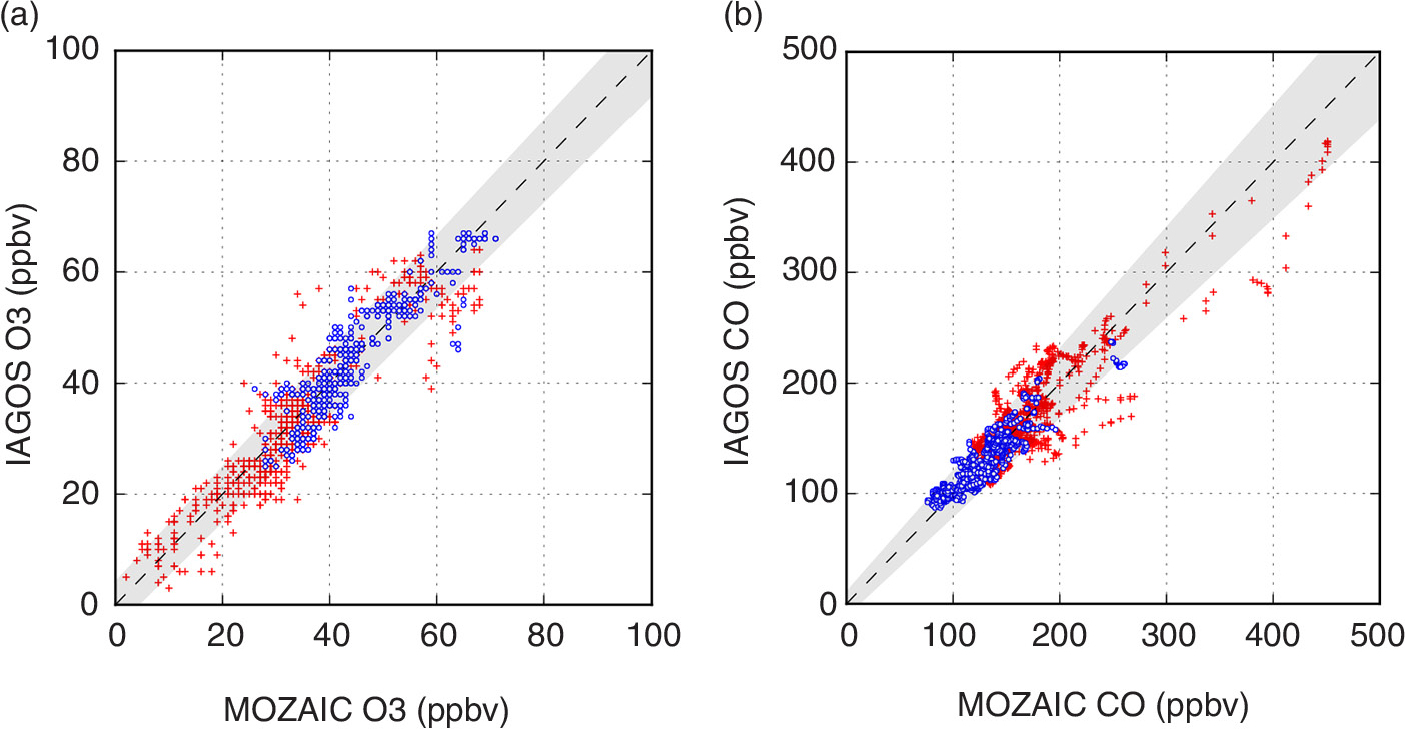
Fig. 10

Flight intercomparison scatterplots between the MOZAIC and the IAGOS instruments for O3 and CO concentrations measured during ascent and descent profiles. Scatterplots compile 32 and 55 validated (L1) intercomparison profiles, respectively, for (a) O3 and (b) CO recorded between July 2011 and December 2012. Dashed line is the 1:1 line and the grey shading represents the total instrument uncertainties. Red crosses and blue dots are the data measured below and above 1000 m, respectively.
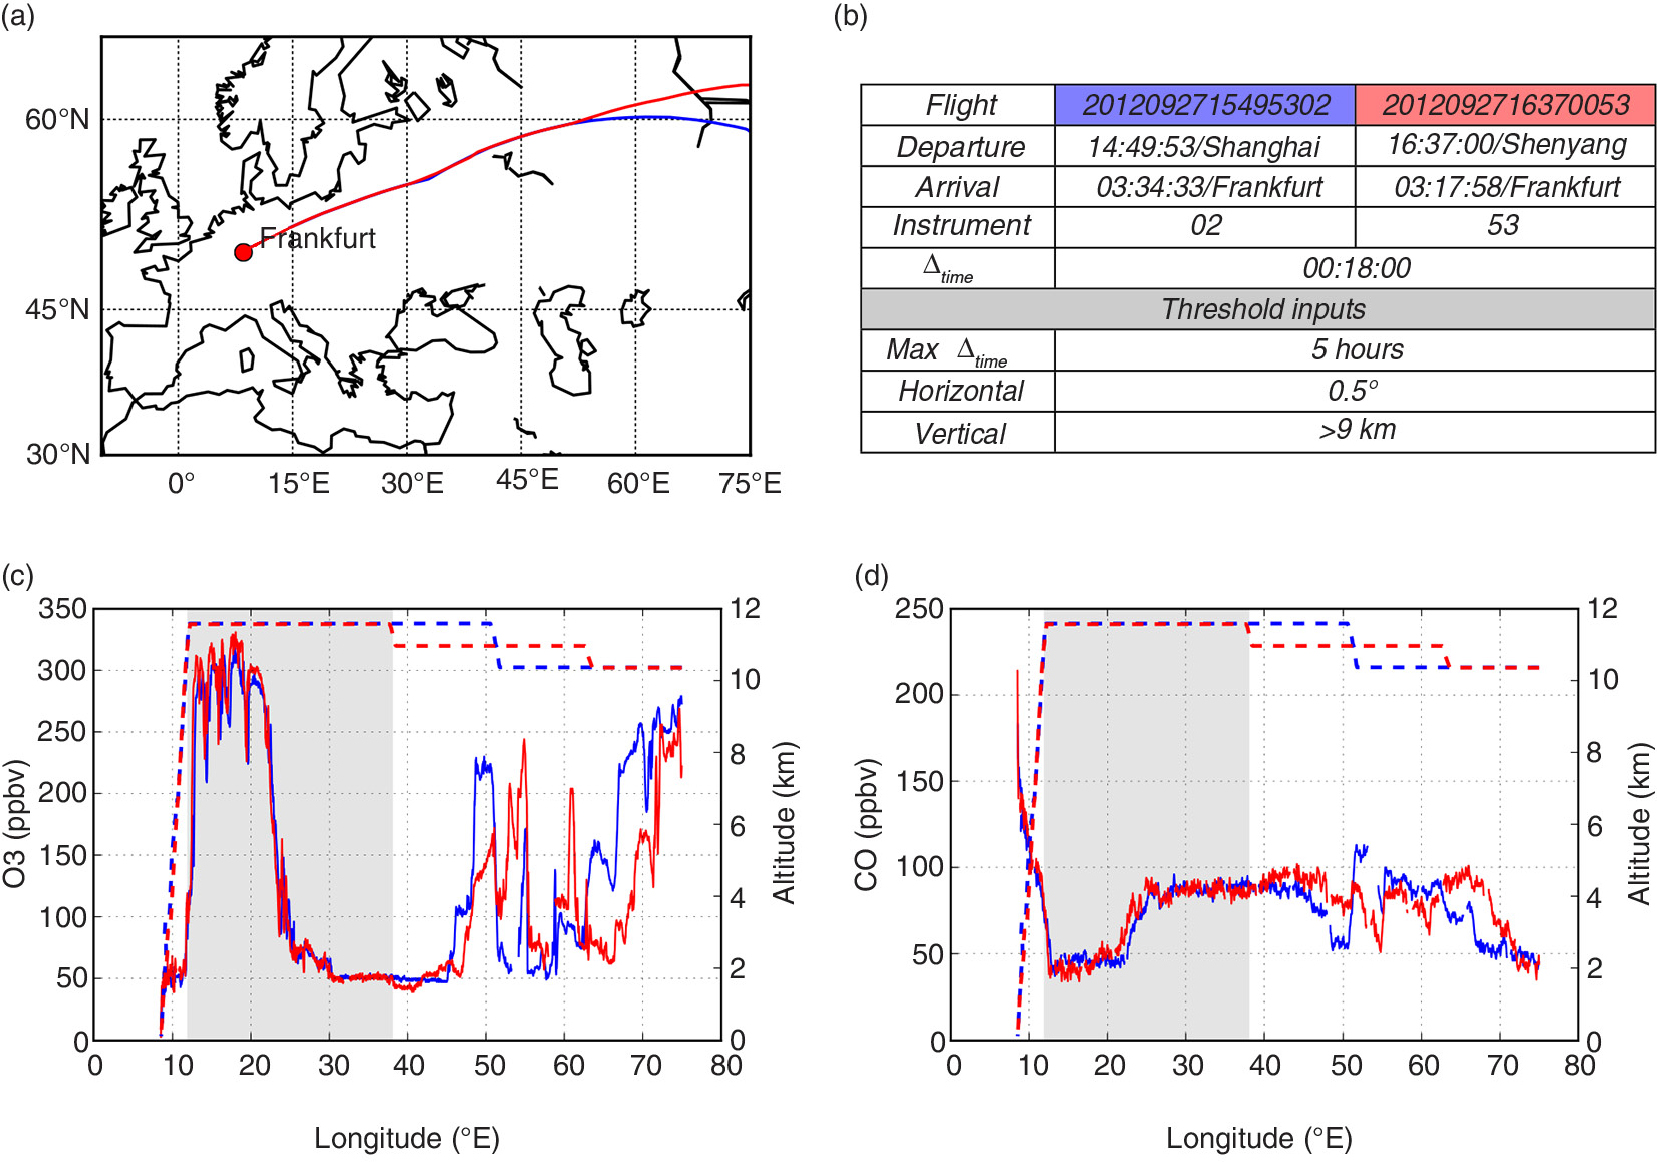
Fig. 11

Example of flight intercomparison at cruising altitudes (>9 km). Plots are automatically made available within the IAGOS database as soon as at least two flights shared the same route distant by <0.5° of latitude/longitude and within in a 5-h time window. (a) Flight routes, (b) flight intercomparison summary table, (c) O3 and cruising altitude and (d) CO and cruising altitude.

Language: English
Page range: 27791 - 27791
Submitted on: Mar 6, 2015
Accepted on: May 29, 2015
Published on: Jan 1, 2015
Published by: Stockholm University Press
In partnership with: Paradigm Publishing Services

© 2015 Philippe Nédélec, Romain Blot, Damien Boulanger, Gilles Athier, Jean-Marc Cousin, Benoit Gautron, Andreas Petzold, Andreas Volz-Thomas, Valérie Thouret, published by Stockholm University Press
This work is licensed under the Creative Commons Attribution 4.0 License.