
Table 1. Input used to drive the six STEM runs described in Section 2.2
[i] The GPP and LRU values below were fed as inputs to eq. (1) to calculate COS surface plant flux (F plant ). F plant was then used to drive STEM. [COS]/[CO2] was set to 1.1 based on INTEX-NA observations (Blake et al., 2008) for all STEM runs.
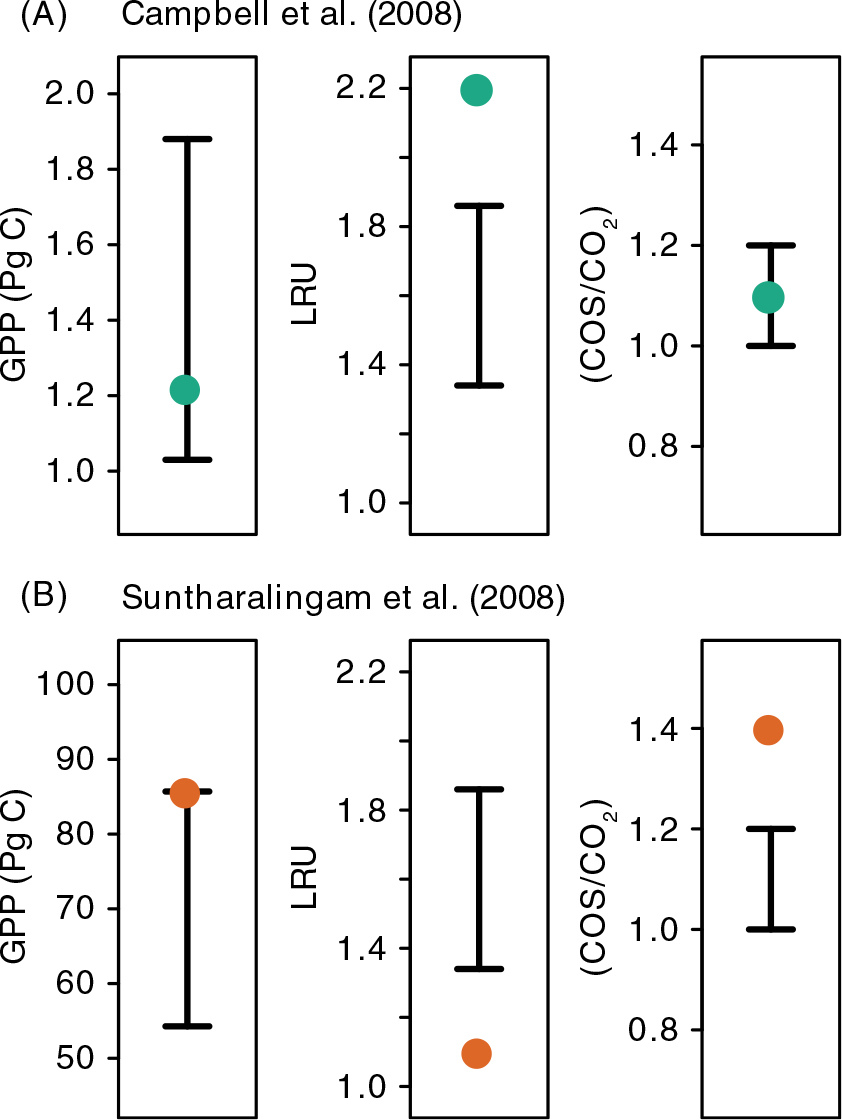
Fig. 1
COS plant flux parameters used in previous atmospheric modelling studies (points) and the range of possible parameters (lines). Two atmospheric COS modelling studies have been reported including a study of the Midwestern and Eastern U.S. growing season (top row; Campbell et al., 2008) and the Northern Hemisphere seasonal variation (bottom row; Suntharalingam et al., 2008). Line widths are the range of model input based on ecosystem model variability for GPP, ground-based experiments for LRU and atmospheric observations for [COS]/[CO2].
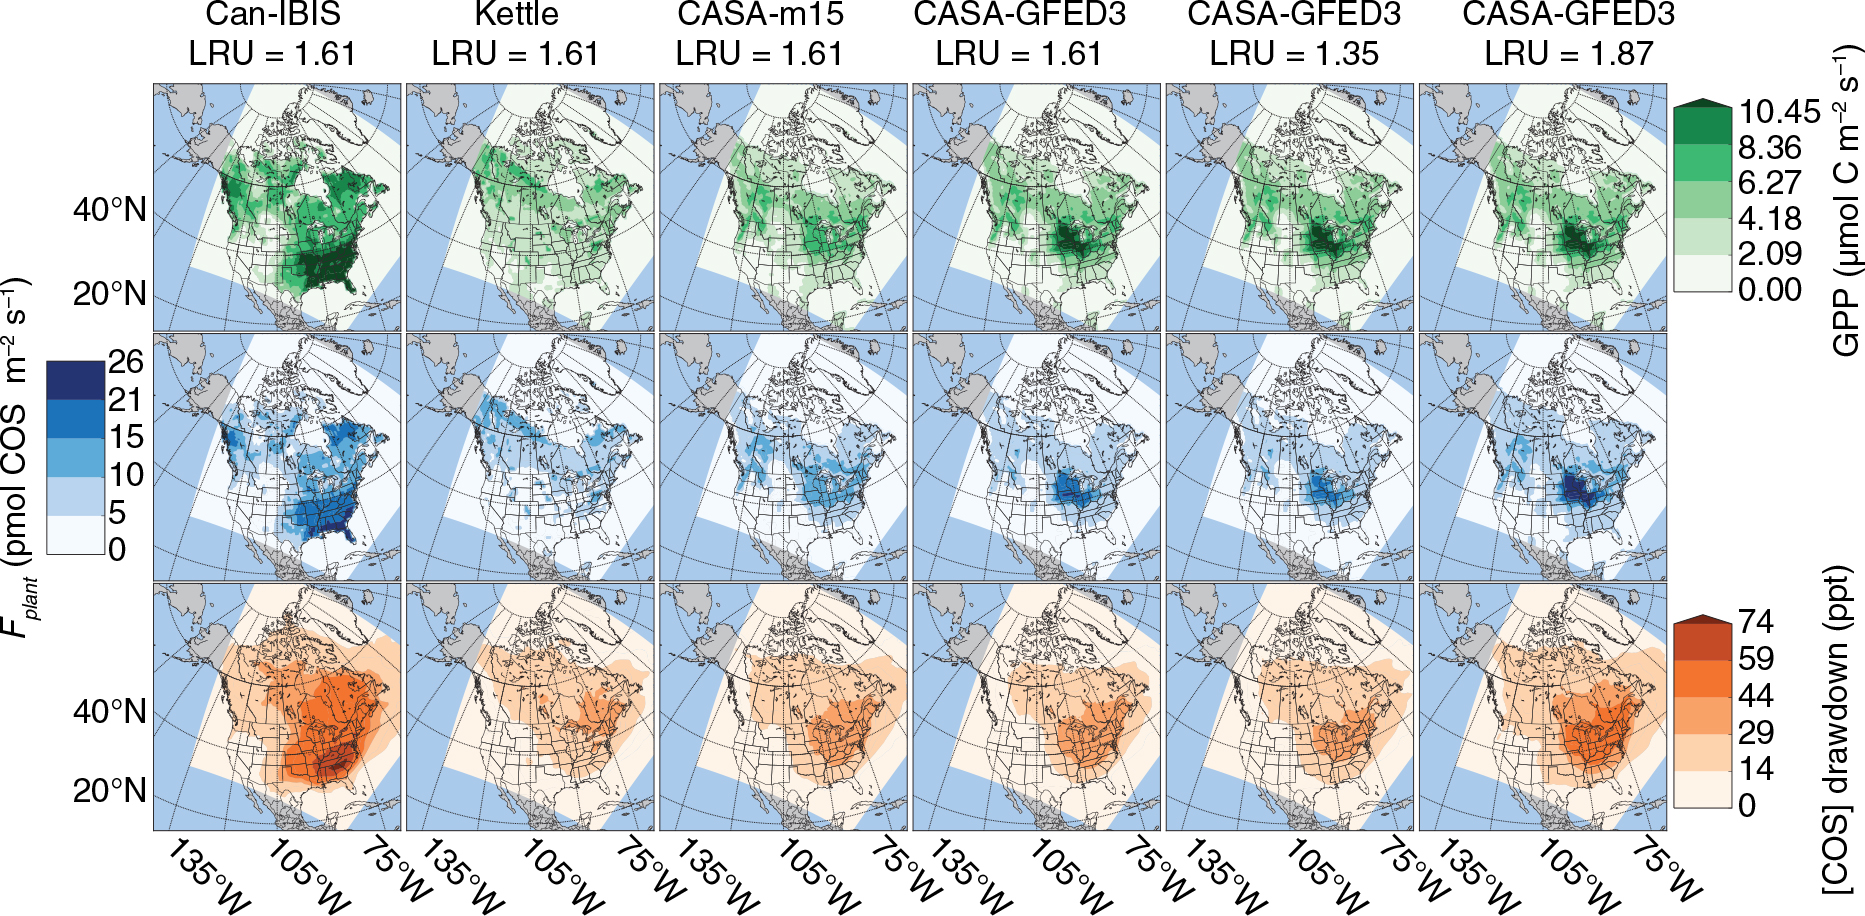
Fig. 2
First row: July and August mean gross primary productivity (GPP). Second row: July and August mean COS plant flux (F plant ). Third row: July and August mean COS vertical drawdown. F plant was calculated from GPP by eq. (1) and passed as a driver to STEM. Vertical drawdown was simulated by STEM; it is the decrease in COS concentration between the surface and the upper atmosphere due to plant uptake. The six STEM runs (columns) are described in Section 2.2 and Table 1.
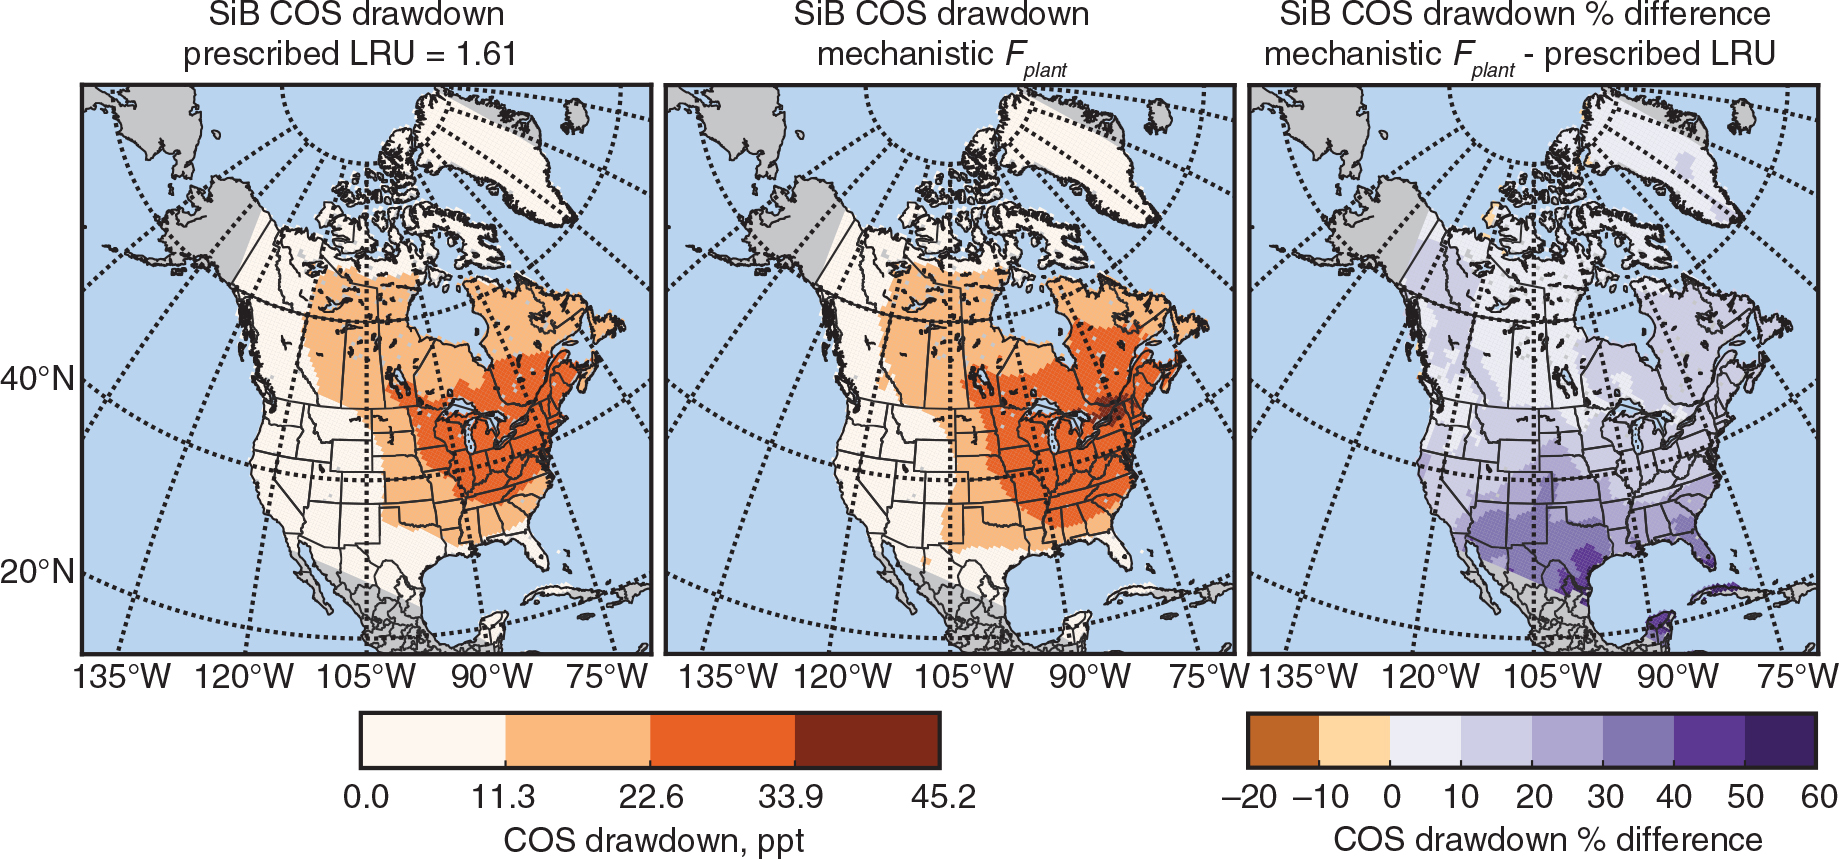
Fig. 3
STEM COS vertical drawdown driven by SiB COS plant fluxes. In the left panel SiB F plant was calculated from SiB GPP by eq. (1) using LRU=1.61. In the centre panel F plant was calculated using SiB's mechanistic F plant . The right panel shows the percent difference. The difference ranges from 0 to 30% over almost all of the United States and Canada; this is consistent with the roughly 30% (1.61±0.26) LRU range of Stimler et al. (2012). The absolute vertical drawdown difference (not shown) ranges from −0.3 to 7.0 ppt.
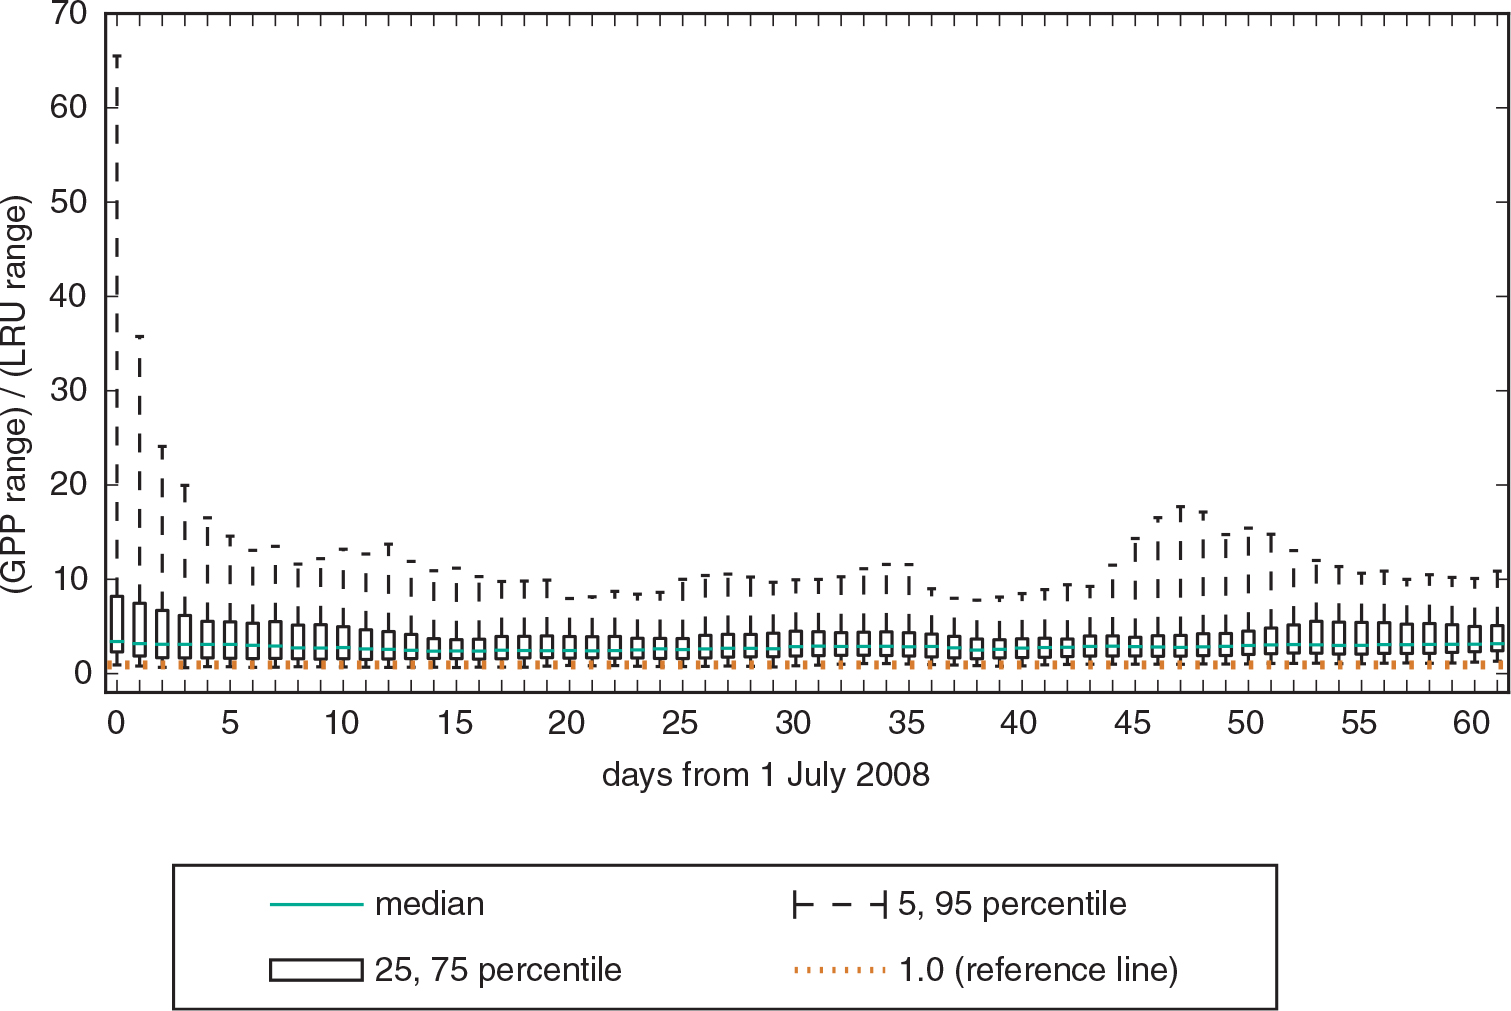
Fig. 4
Box and whisker plots showing the relative sensitivities of simulated COS vertical drawdown to uncertainty in leaf relative uptake (LRU) and gross primary productivity (GPP). Vertical drawdown is the imposed background COS concentration of 450 ppt minus the STEM-simulated surface COS concentration. Ratios are (GPP range)/(LRU range). GPP range and LRU range were calculated from mid-day mean COS vertical drawdown. GPP range is maximum minus minimum drawdown among the four GPP-varying runs (Can-IBIS, Kettle, CASA-m15, CASA-GFED3). LRU range is the maximum minus minimum drawdown among the three LRU-varying runs (CASA-GFED3 LRU=1.35, CASA-GFED3 LRU=1.61, CASA-GFED3 LRU=1.87). STEM runs are described in Section 2.2 and Table 1. Each box and whisker plot summarises 1 d mid-day mean drawdown for all STEM grid cells. Almost all of the ratios are greater than 1.0 and all medians are between 2.4 and 3.4. This suggests that GPP uncertainty consistently produces more [COS] variability than LRU uncertainty by a factor of roughly 3.