
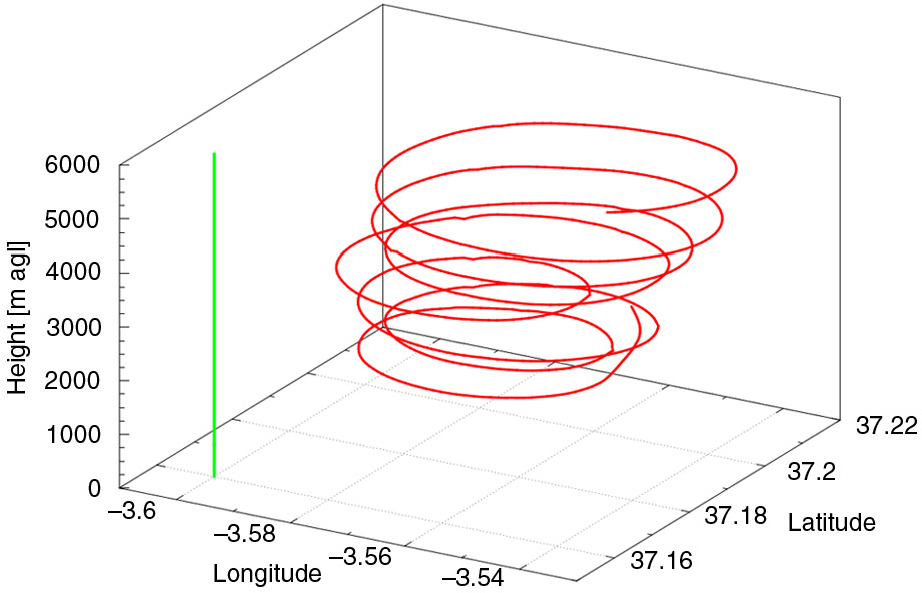
Fig. 1
Ascending track of the INTA C212-200 aircraft during the flight on 27 June 2011 around 10:45 UTC. Green line represents the vertical of CEAMA station.
Table 1. Aerosol-particle optical and physical properties calculated from optical properties
AOD-related
Angström exponent(1)σ sp -related
Angström exponent(2)α, β-related
Angström exponent(3)Single scattering albedo(4)AODPBL(5)AODFT(6)Lidar ratio(7)Particle linear depolarisation ratio(8)β dust (9)m dust (10)
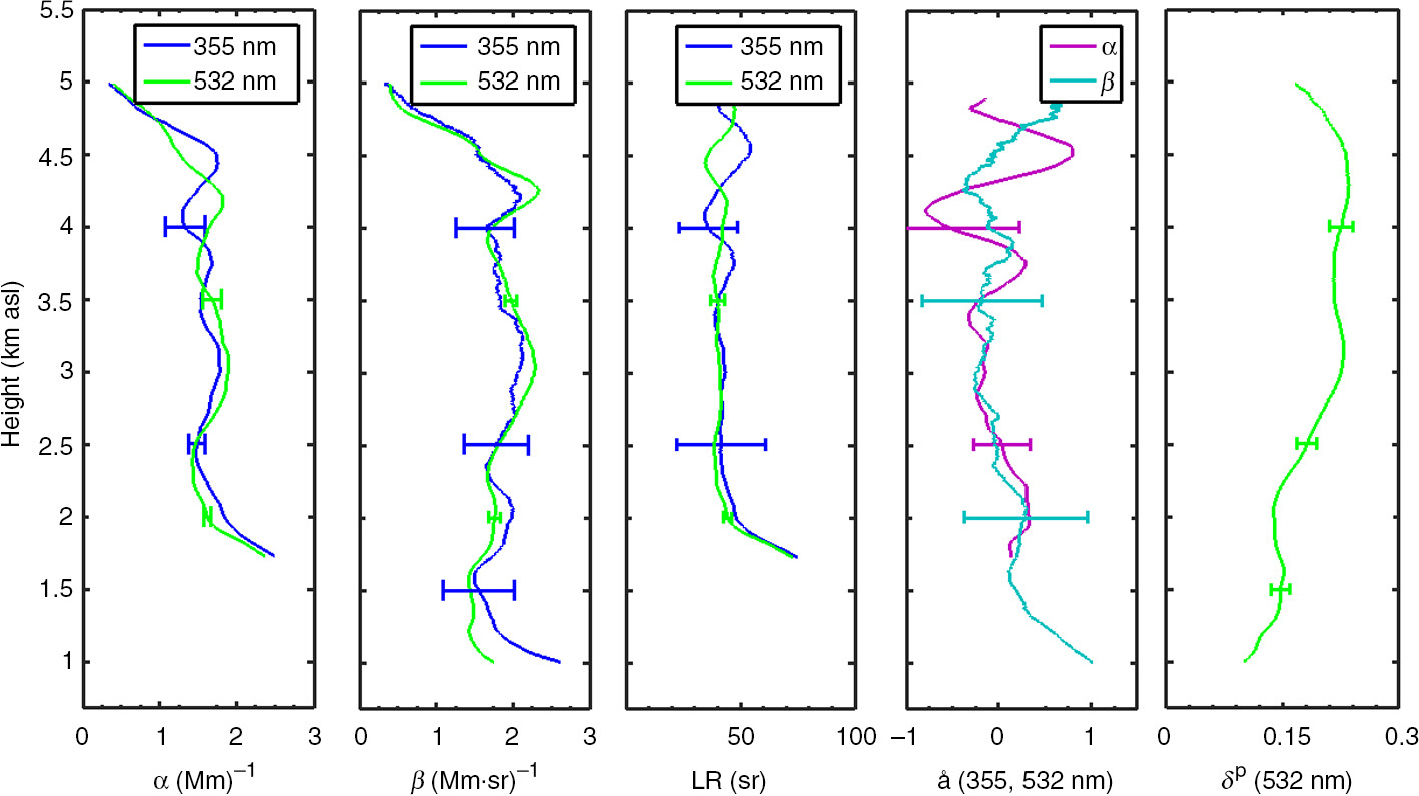
Fig. 2
From left to right, aerosol extinction (α) and backscattering (β) coefficients and lidar ratio (LR) at 355 and 532 nm, backscatter- and extinction-related Angström exponent [åβ(355, 532 nm) and åα(355, 532 nm), respectively] and particle linear depolarisation ratio, δp(532 nm), at 00:00–01:00 UTC on 27 June 2011.
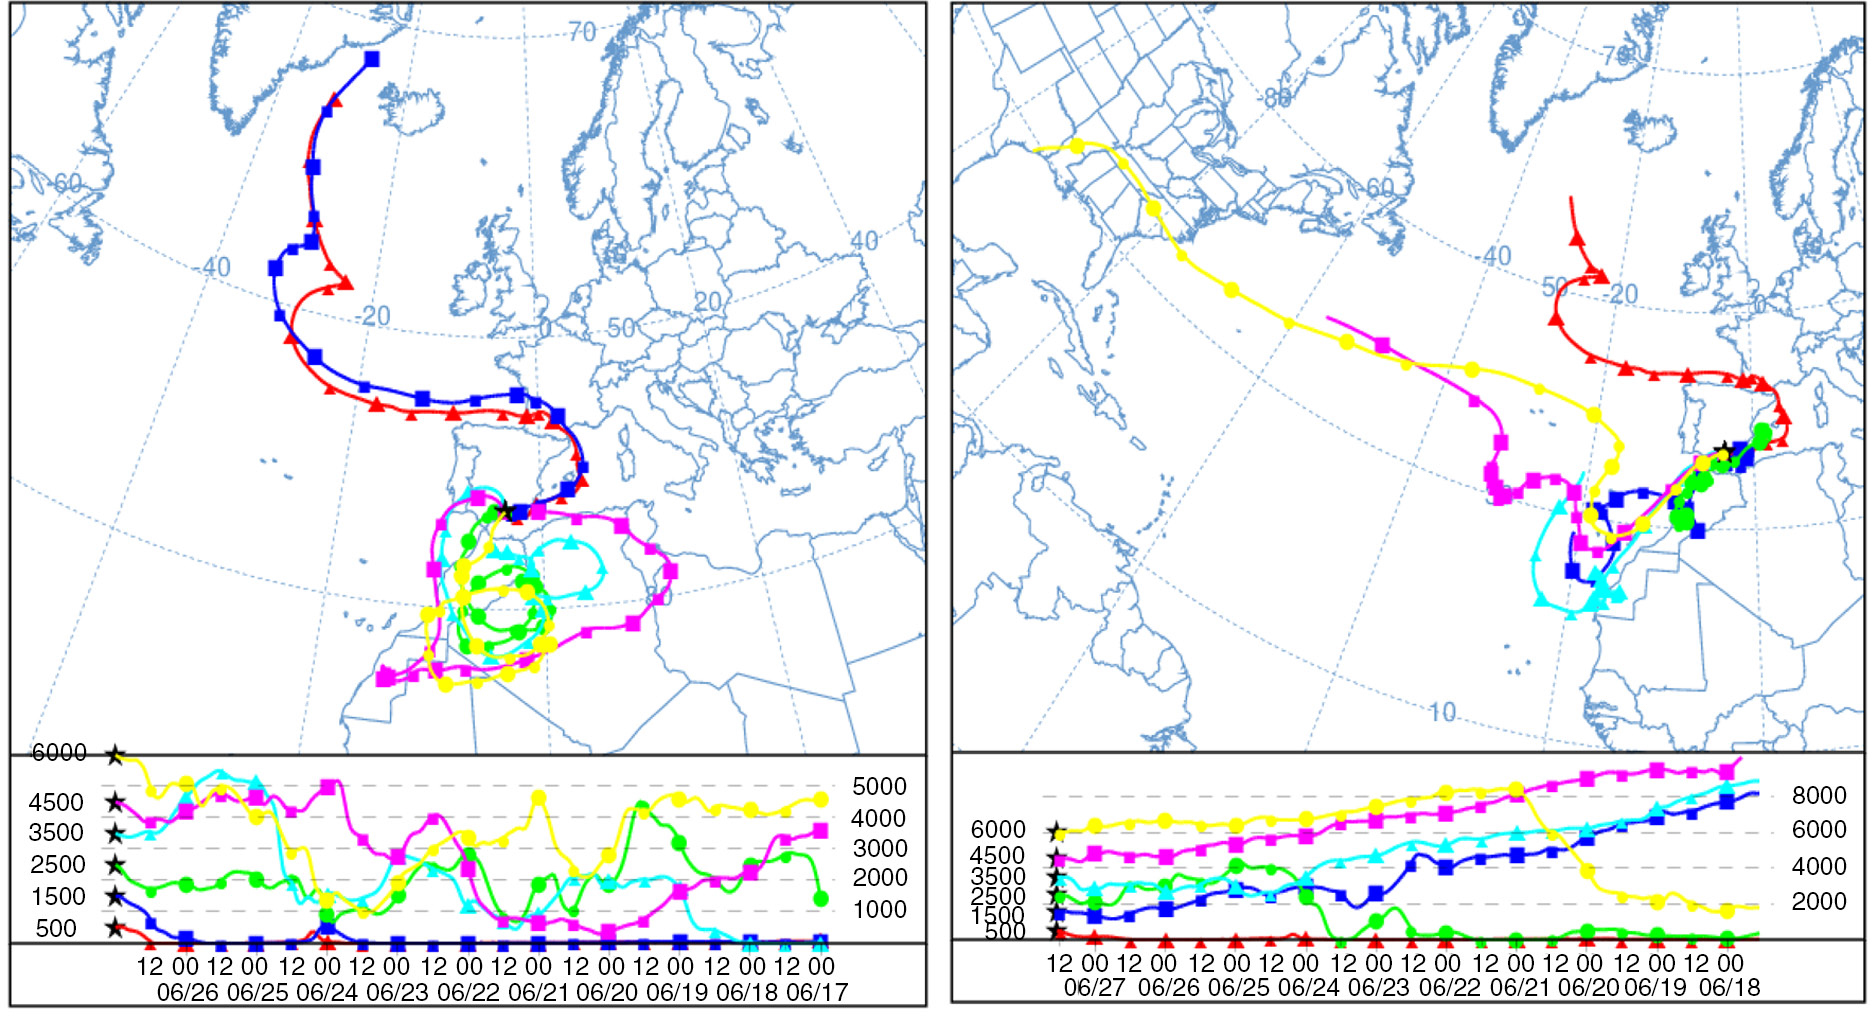
Fig. 3
HYSPLIT backward trajectories ending at 00:00 (left) and at 13:00 UTC (right) on 27 June 2011 at 500, 1500, 2500, 3500, 4500 and 6000 m agl (Granada, 37.16°N, 3.61°W).
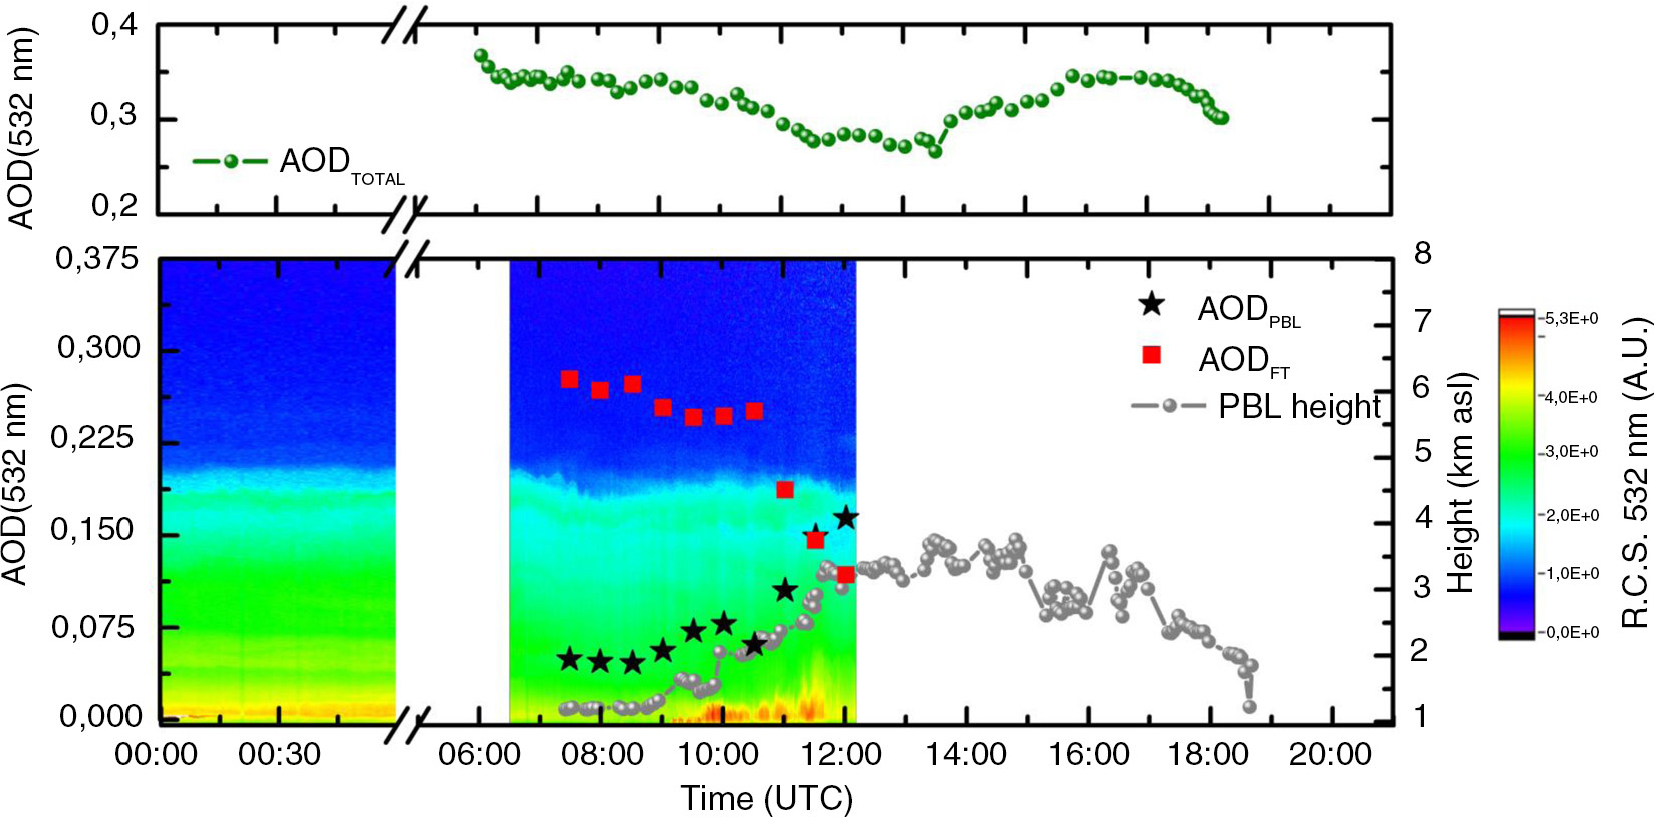
Fig. 4
Top: temporal evolution of the total AOD at 532 nm (green). Bottom: temporal evolution of PBL height (grey) and the PBL and FT contribution to AOD(532 nm) (black and red, respectively) on 27 June 2011. Colour maps represent the lidar range corrected signal at 532 nm on 27 June 2011 from 00:00 to 01:00 and 06:30 to 12:15 UTC.
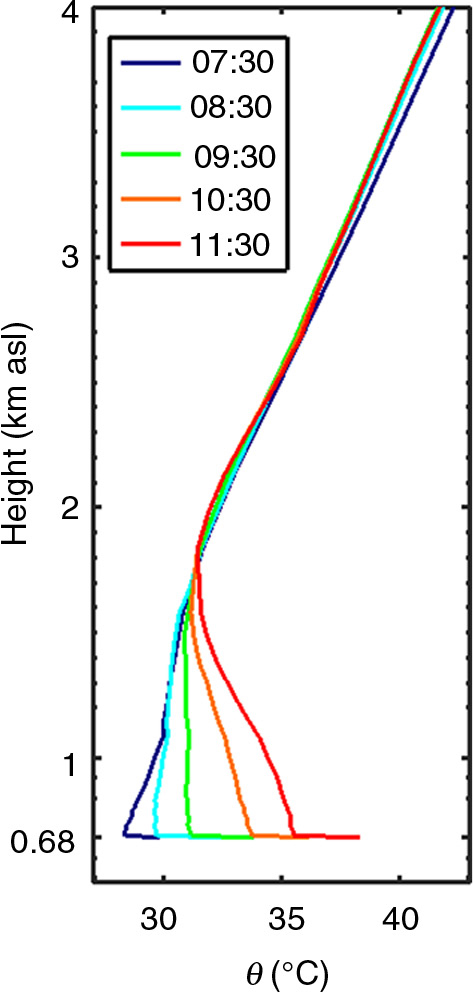
Fig. 5
Hourly mean potential temperature evolution at different hours showed by the label (UTC) on 27 June 2011.
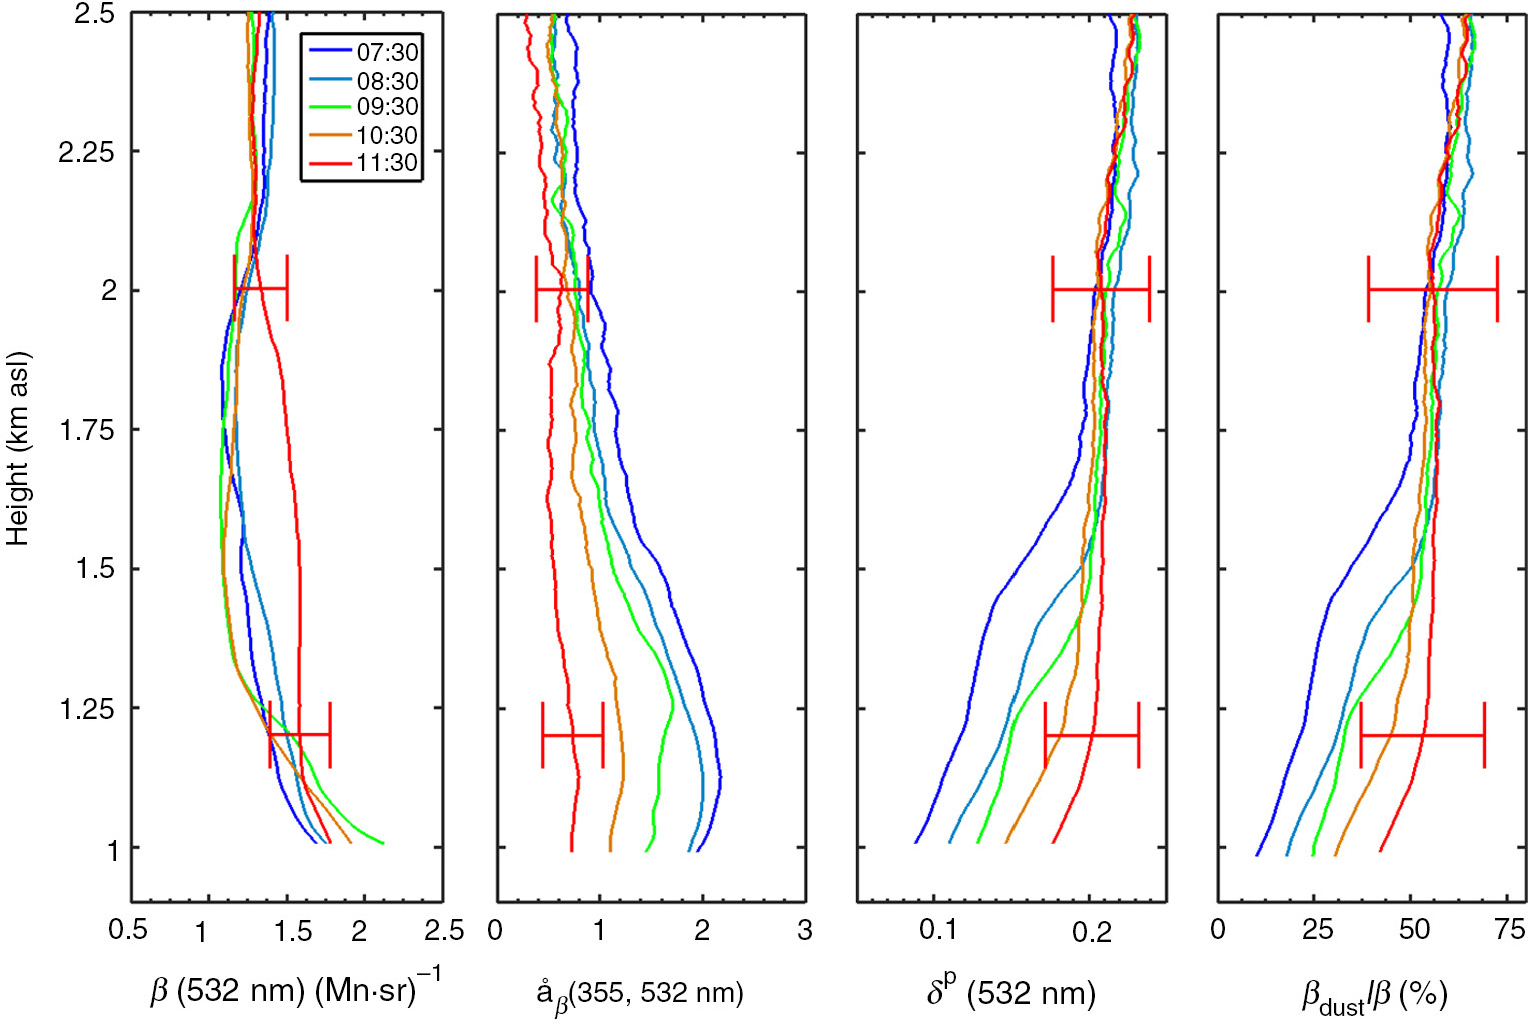
Fig. 6
β(532 nm), åβ (355 532 nm), δp (532 nm) and βd/β(%) profiles retrieved using 30-min averaged lidar signals at different hours following the label (UTC) on 27 June 2011. Only error bars corresponding to 11:30 UTC are shown for clarity.
Table 2. Thirty-minute mean and standard deviation of in-situ and lidar optical properties at surface and between 1 and 1.1 km asl, respectively, and the PBL height at two different hours during the morning of 27 June 2011
δp (532 nm)[1–1.1 km]0.08±0.020.19±0.03Åβ(355, 532 nm)[1–1.1 km]2.1±0.10.8±0.1βdust/β [1–1.1 km] (%)12±1045±10PBL height (km asl)1.2±0.052.8±0.1åsp(450, 700 nm)1.23±0.050.86±0.05
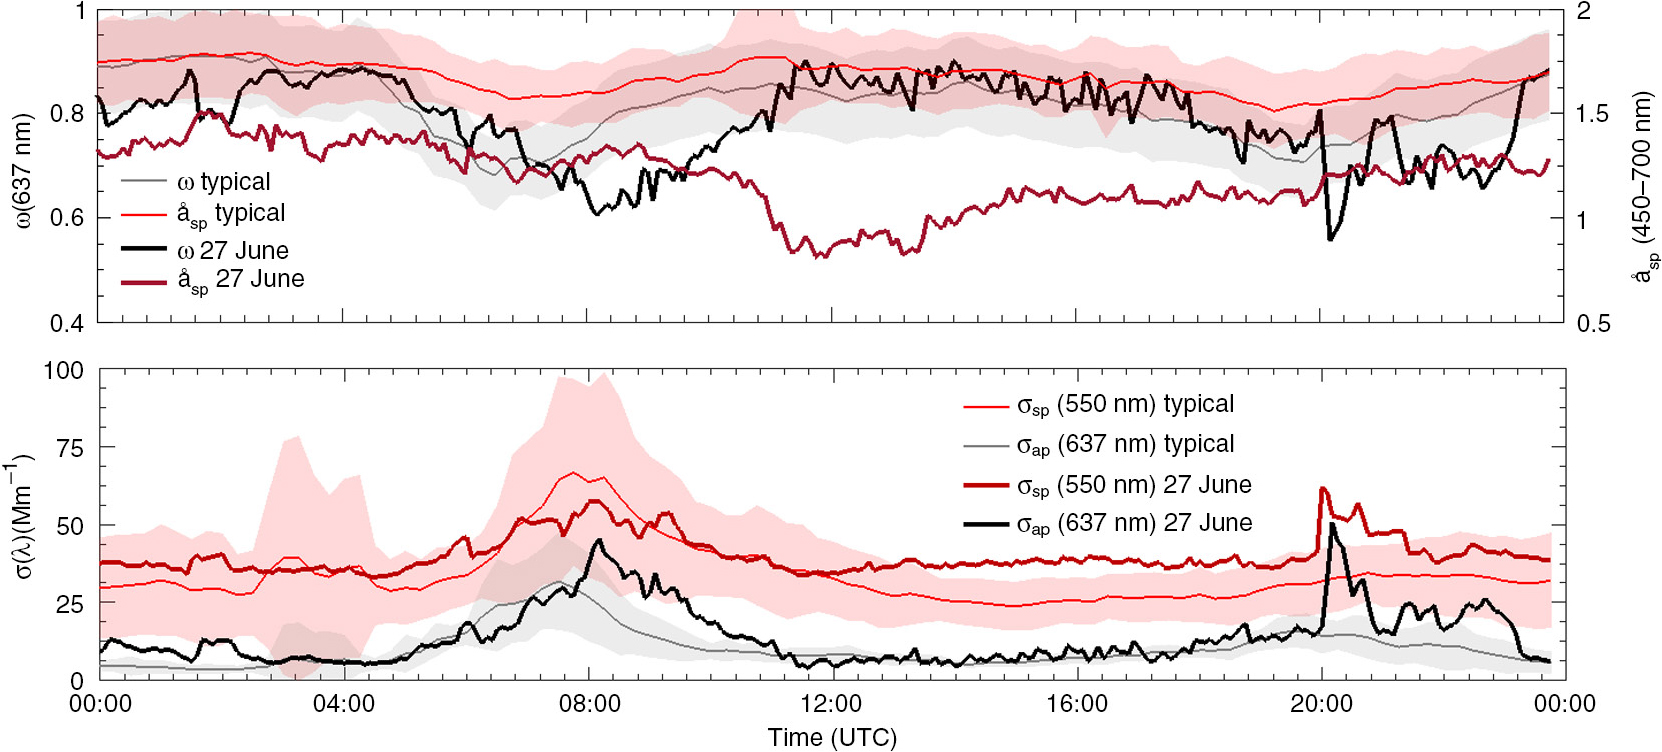
Fig. 7
Temporal evolution of in-situ properties: (a) åsp(450, 700 nm), ω (637 nm) and (b) σsp (550 nm), σap (637 nm). Thick lines correspond to data on 27 June and thin lines correspond to the mean of June 2011 for working days not affected by Saharan mineral dust at surface level. Shaded regions indicate the standard deviation.
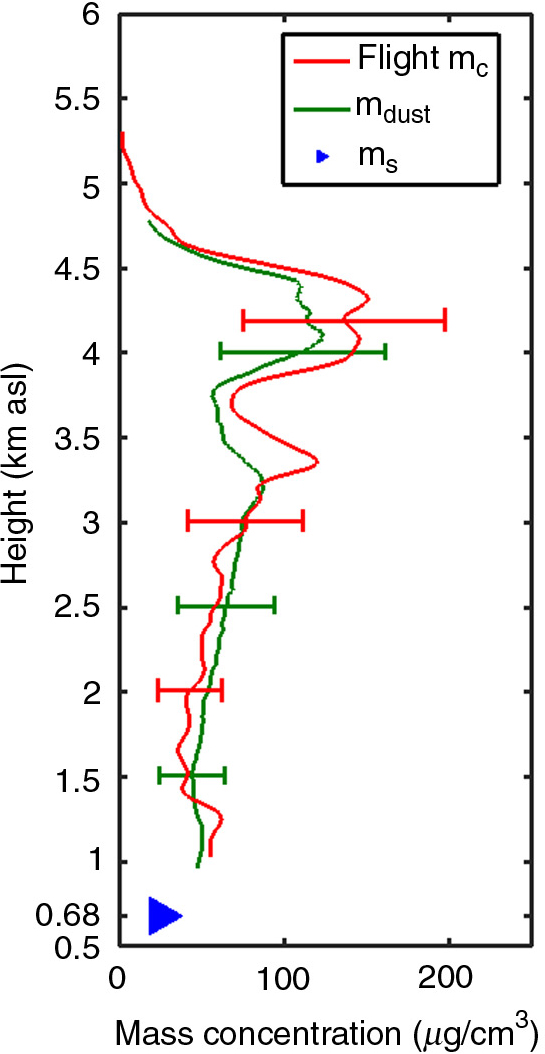
Fig. 8
Dust mass concentration (m dust ) retrieved by POLIPHONat 10:30 UTC, coarse-mode mass concentration (m c ) derived from airborne measurements at 10:45 UTC and mean mass concentration of particles with diameters between 1 and 10 µm (m s ) (µg/m3) in the period 10:00–11:00 UTC at surface level (0.68 km asl) on 27 June 2011.