
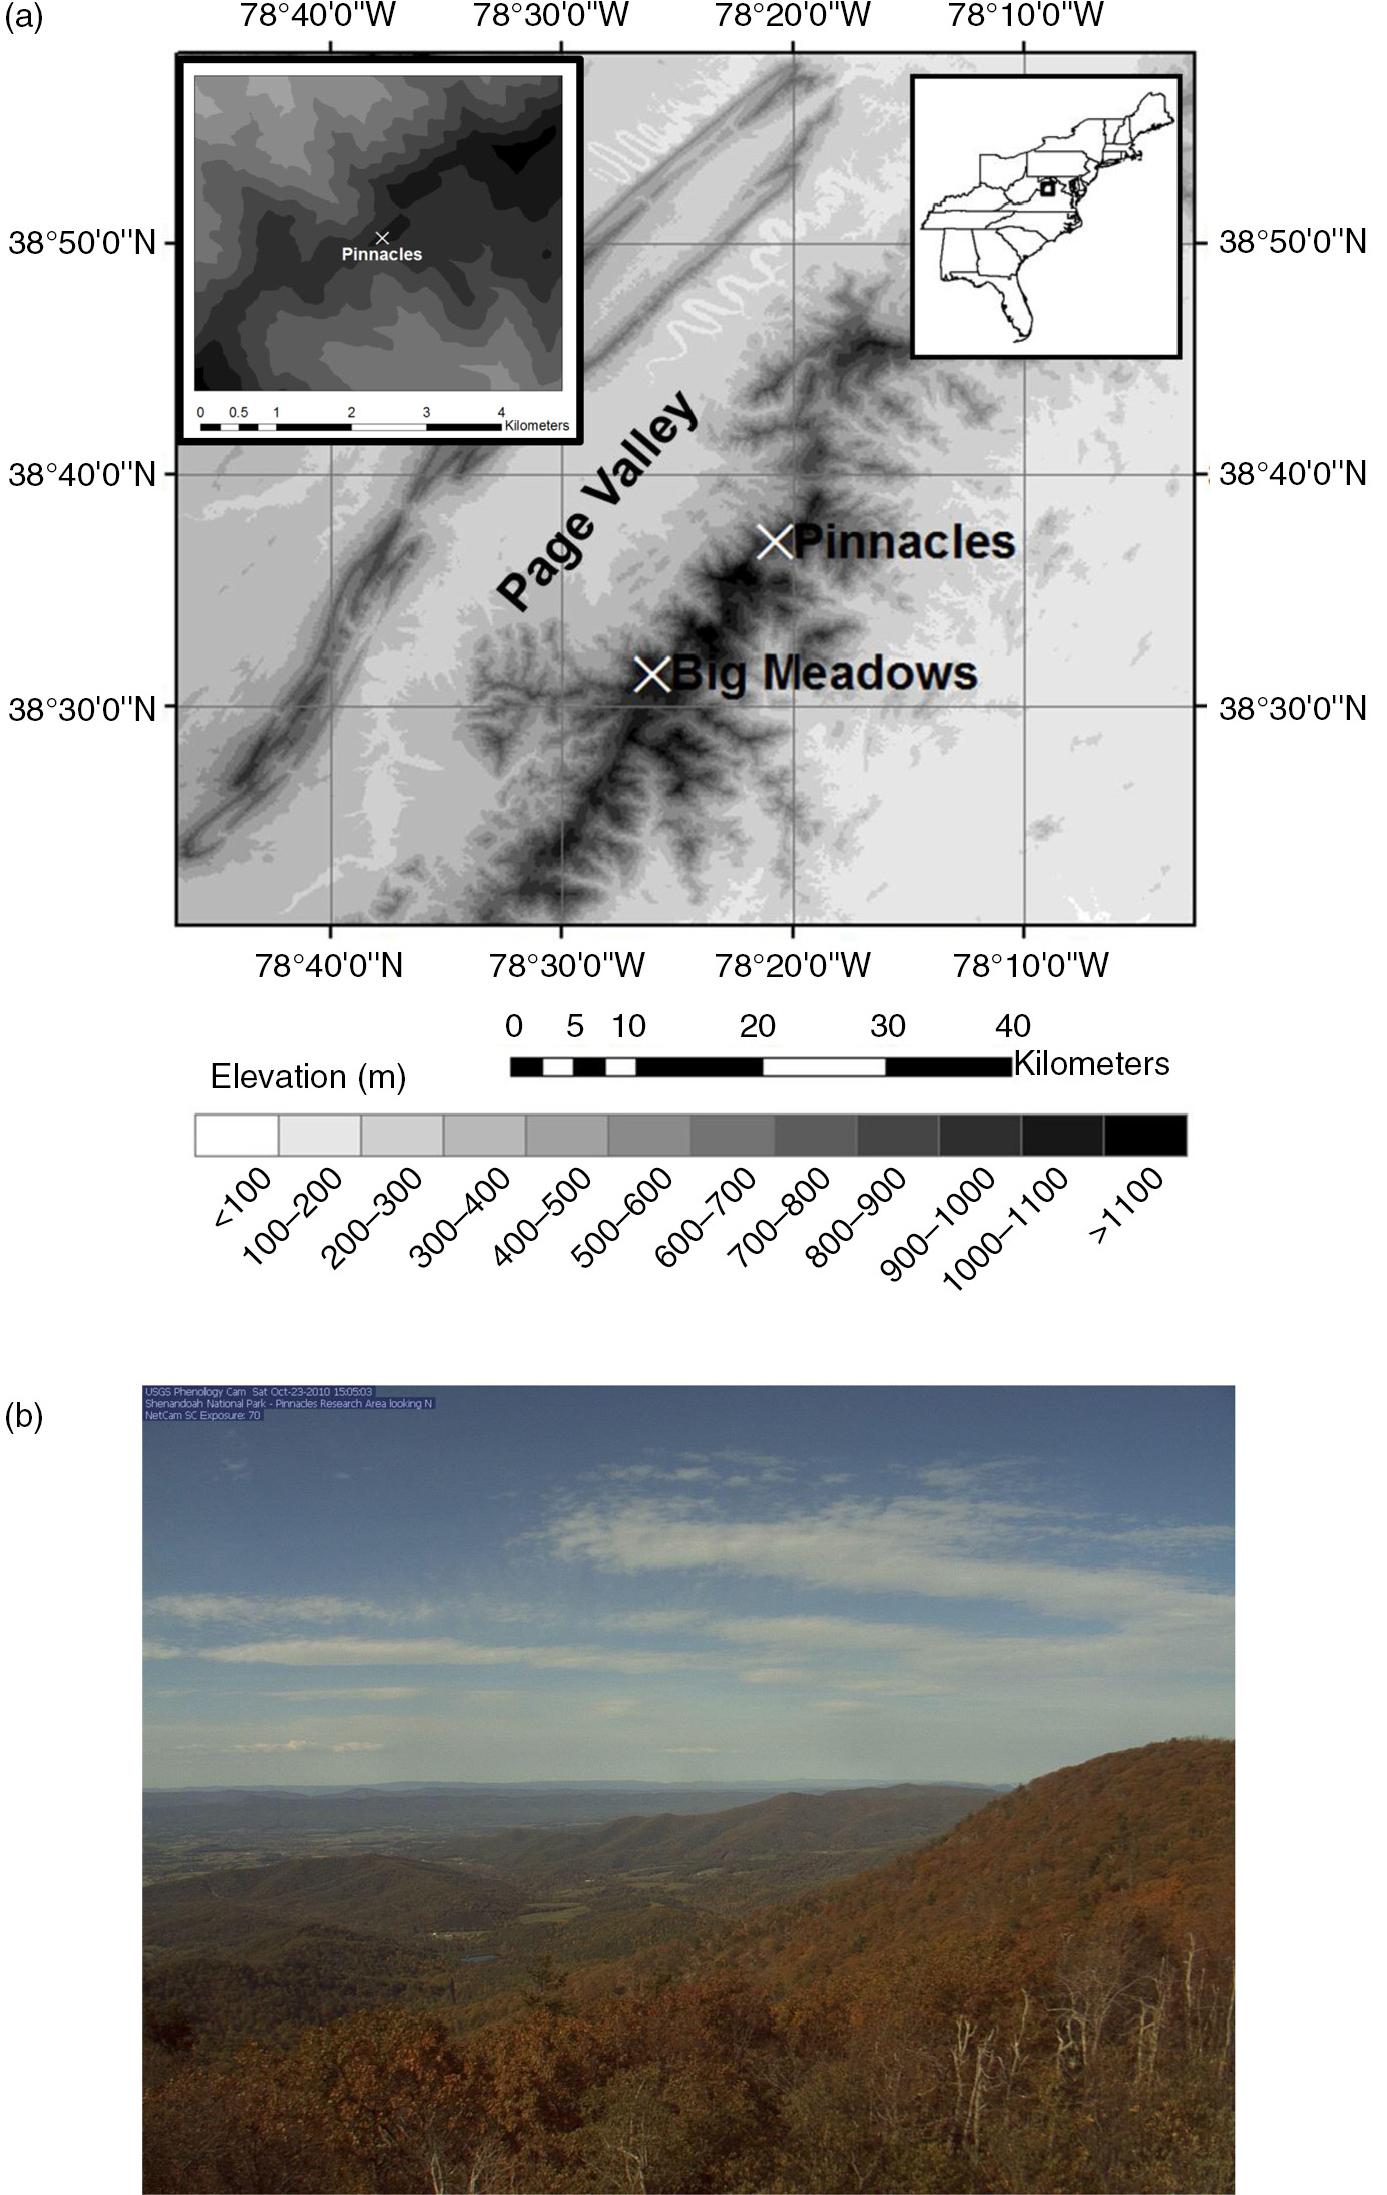
Fig. 1
Topographic map (a) indicating the location of Pinnacles (white X) relative to Big Meadows and the Page Valley. Shading shows elevation msl. The inset map at the top left shows the topography in a 5 km×5 km box surrounding Pinnacles. The inset map at the top right indicates the study location, denoted by a black box, in the eastern US. Topography data are from the US Geological Survey and have a 10 m resolution. Panel (b) shows a web camera image taken at 1205 LST 23 Sept 2012 from the site showing the Page Valley northwest of Pinnacles.
Table 1. Meteorological variable, sampling instrument, sampling height(s) and sampling technique for each meteorological variable measured at Pinnacles. Data from the CMP3 pyranometer are used to compute CI.
Air temperature and humidityVaisala HMP45C2, 5, 10, 1730 min means of 1 Hz samplesBarometric pressureVaisala CS105 pressure sensor1430 min means of 1 Hz samplesCO2 flux, latent heat fluxCSAT sonic anemometer, Li-COR 7500 water vapour and CO2 gas analyser1730 min means of 10 Hz samplesIncoming and outgoing shortwave and longwave radiationHukseflux 4-component net radiometer1730 min means of 1 Hz samplesIncoming shortwave radiationKip and Zonen CMP3 pyranometer1730 min means of 1 Hz samplesRainfallTR-525I tipping bucket rain gauge330 min totalSensible heat fluxCSAT sonic anemometer1730 min means of 10 Hz samplesWind directionMetOne 034B windset10, 1730 min sampleWind speedMetOne 034B windset10, 1730 min means of 1 Hz samples
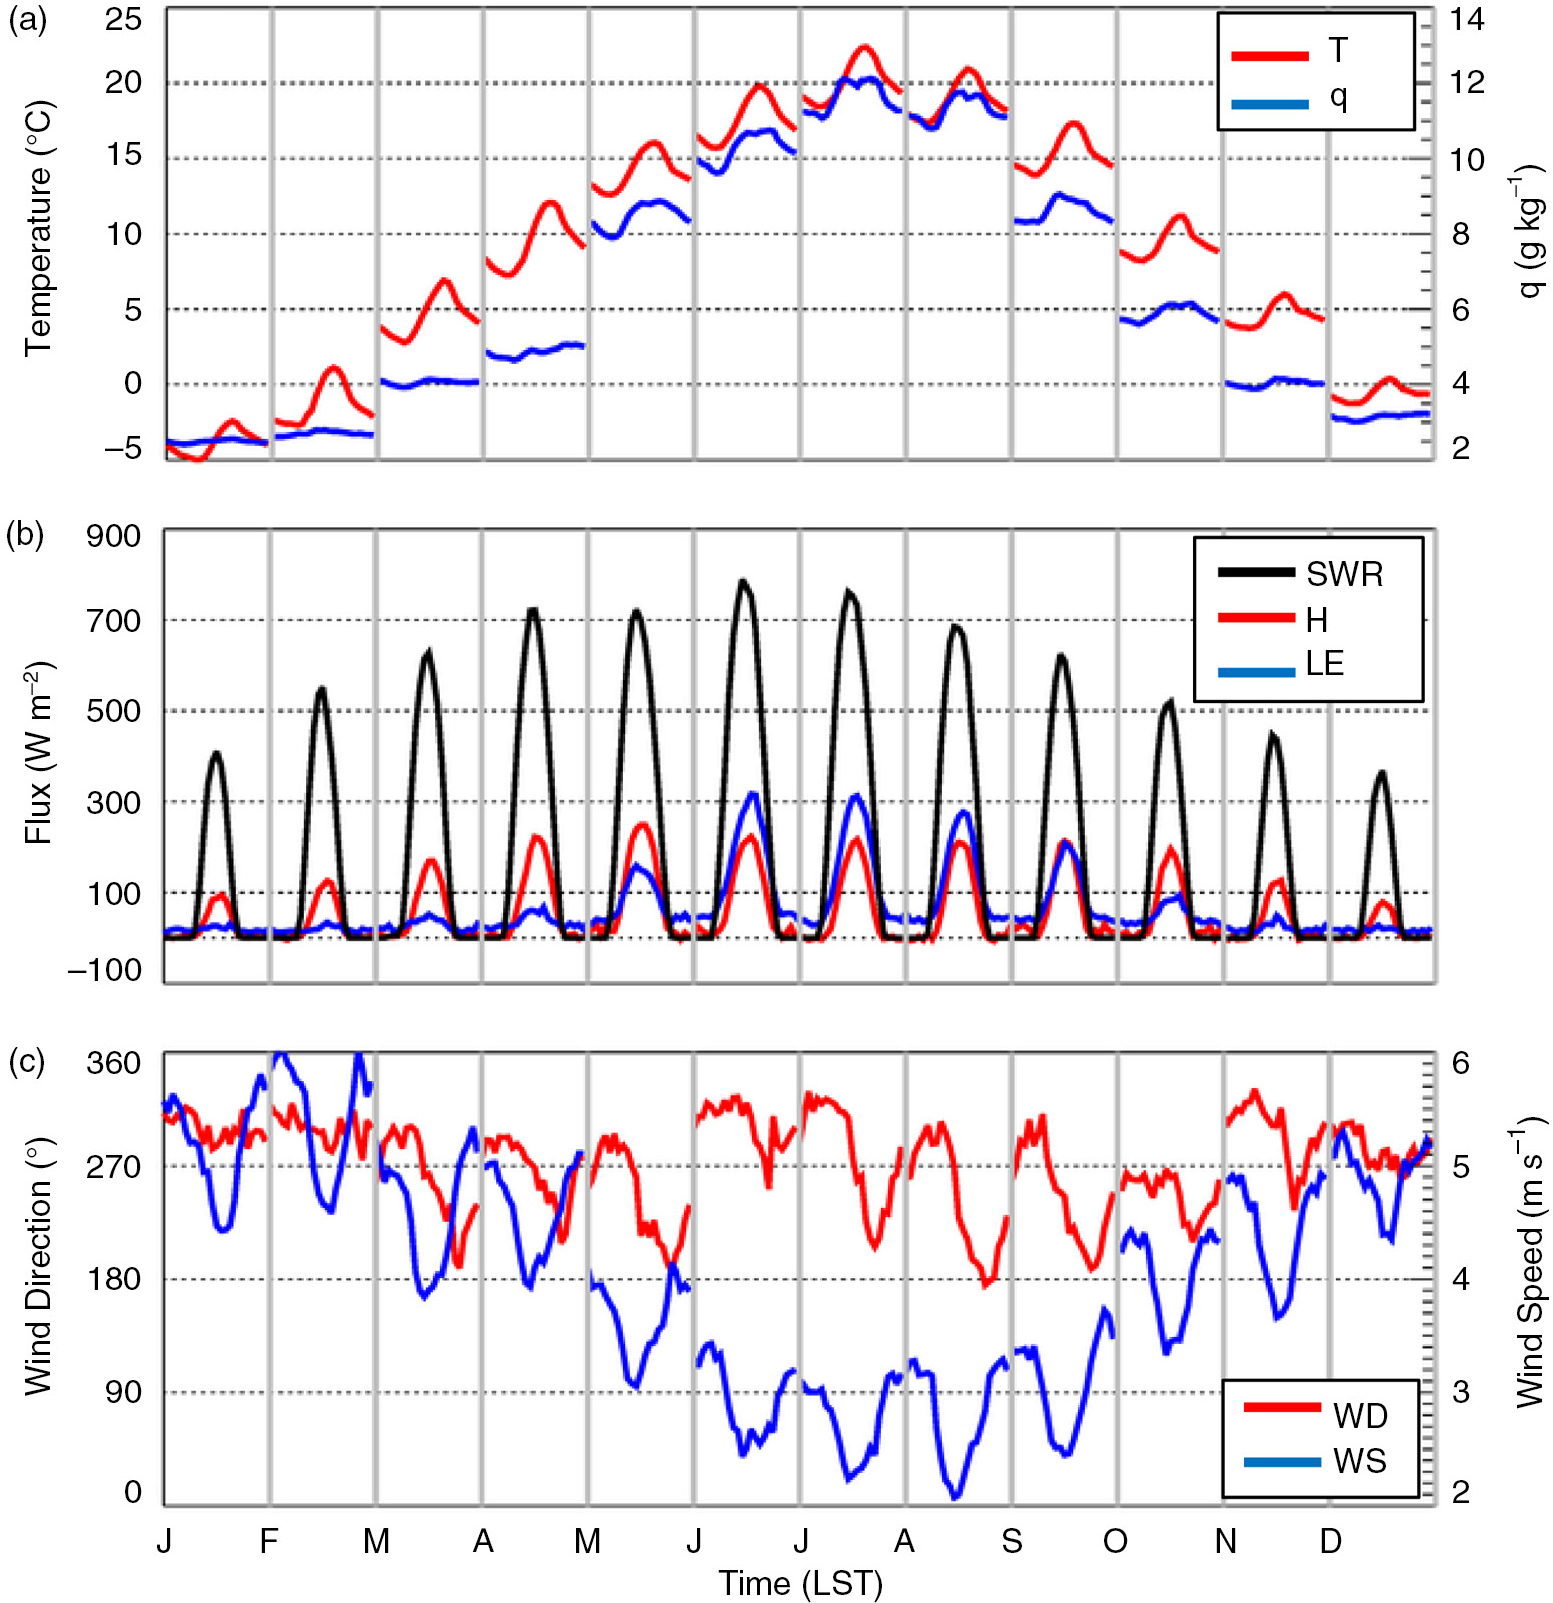
Fig. 2
Mean diurnal time series by month of temperature (T) (red line) and water vapour (q) (blue line) (a); shortwave radiation (SWR) (black line), sensible heat (H) (red line) and latent heat (LE) (blue line) (b); wind direction (WD) (red line) and wind speed (WS) (blue line) (c). Vertical grey lines distinguish different months. Means represent measurements from 1 January 2009 to 31 December 2012. All measurements are made at 17 m agl at Pinnacles. Sensible and latent heat fluxes < − 20 W m−2 are not included in the mean cycle. Because these are mean diurnal time series by month, the time series are discontinuous.
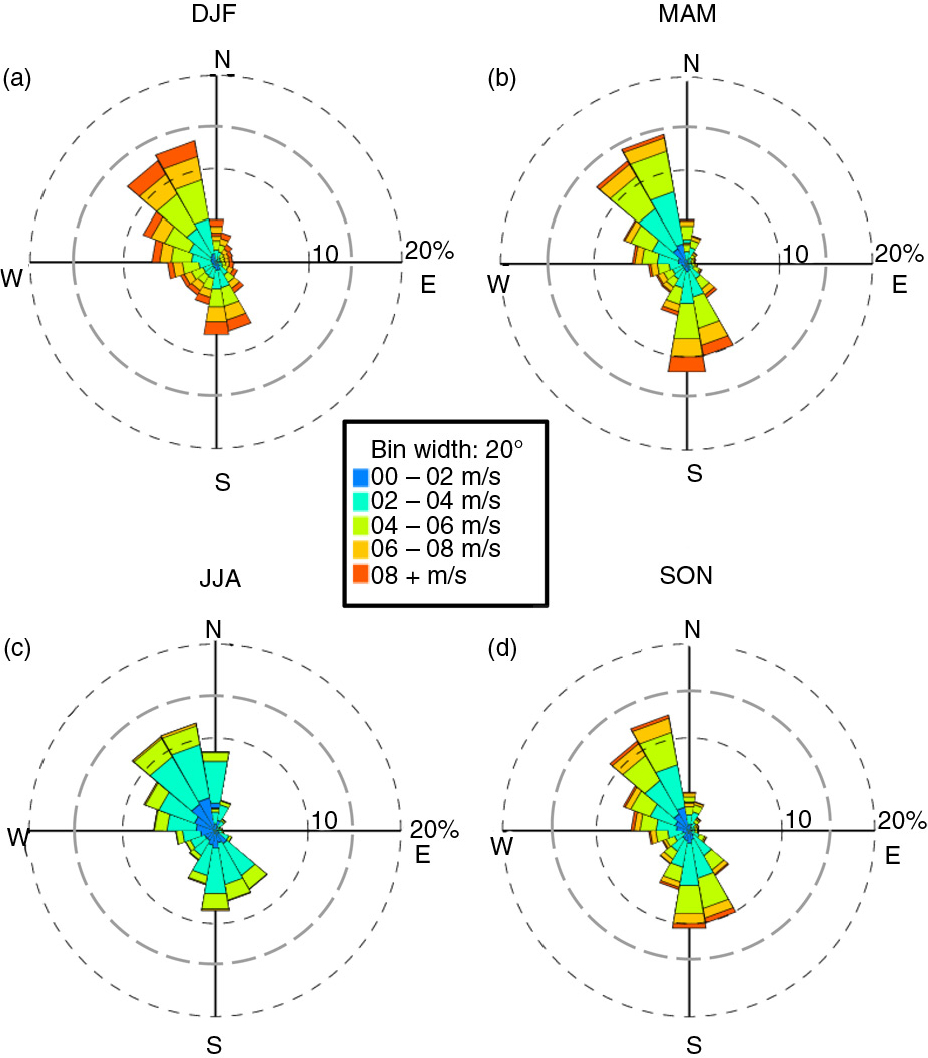
Fig. 3
Wind distribution at 17 m agl at Pinnacles in winter (DJF) (a), spring (MAM) (b), summer (JJA) (c) and fall (SON) (d) from 1 January 2009 to 31 December 2012. Data completion percentage is 83.2%, 86.8%, 58.5% and 79.2%, respectively.
Table 2. Monthly mean and median CO; monthly mean and median afternoon (1200–1600 LST) CO; monthly mean and median night-time (0000–0400 LST) CO; and monthly maximum and minimum CO. All values are measured at 17 m agl at Pinnacles for the period 1 January 2009–31 December 2012.
Jan156.7 (151.1)156.6 (150.7)155.6 (151.0)335.7101.5Feb158.4 (156.5)158.5 (156.5)159.5 (157.2)250.498.3Mar160.3 (159.2)160.3 (159.0)161.0 (159.6)241.5108.3Apr159.3 (156.4)157.5 (154.8)161.1 (157.7)448.994.9May146.3 (144.9)148.0 (145.1)146.3 (145.2)240.994.6June140.8 (136.9)140.9 (136.8)140.7 (137.6)224.882.8July135.9 (131.5)138.1 (133.6)134.6 (131.6)229.380.8Aug140.8 (137.9)141.2 (137.1)140.1 (138.6)289.576.6Sept131.8 (130.4)132.4 (129.6)132.0 (131.2)274.868.1Oct126.8 (124.7)127.0 (125.5)125.9 (124.4)254.580.4Nov138.4 (134.9)139.7 (136.9)137.9 (134.4)251.765.7Dec141.4 (139.4)142.7 (139.8)140.6 (138.5)28996.4
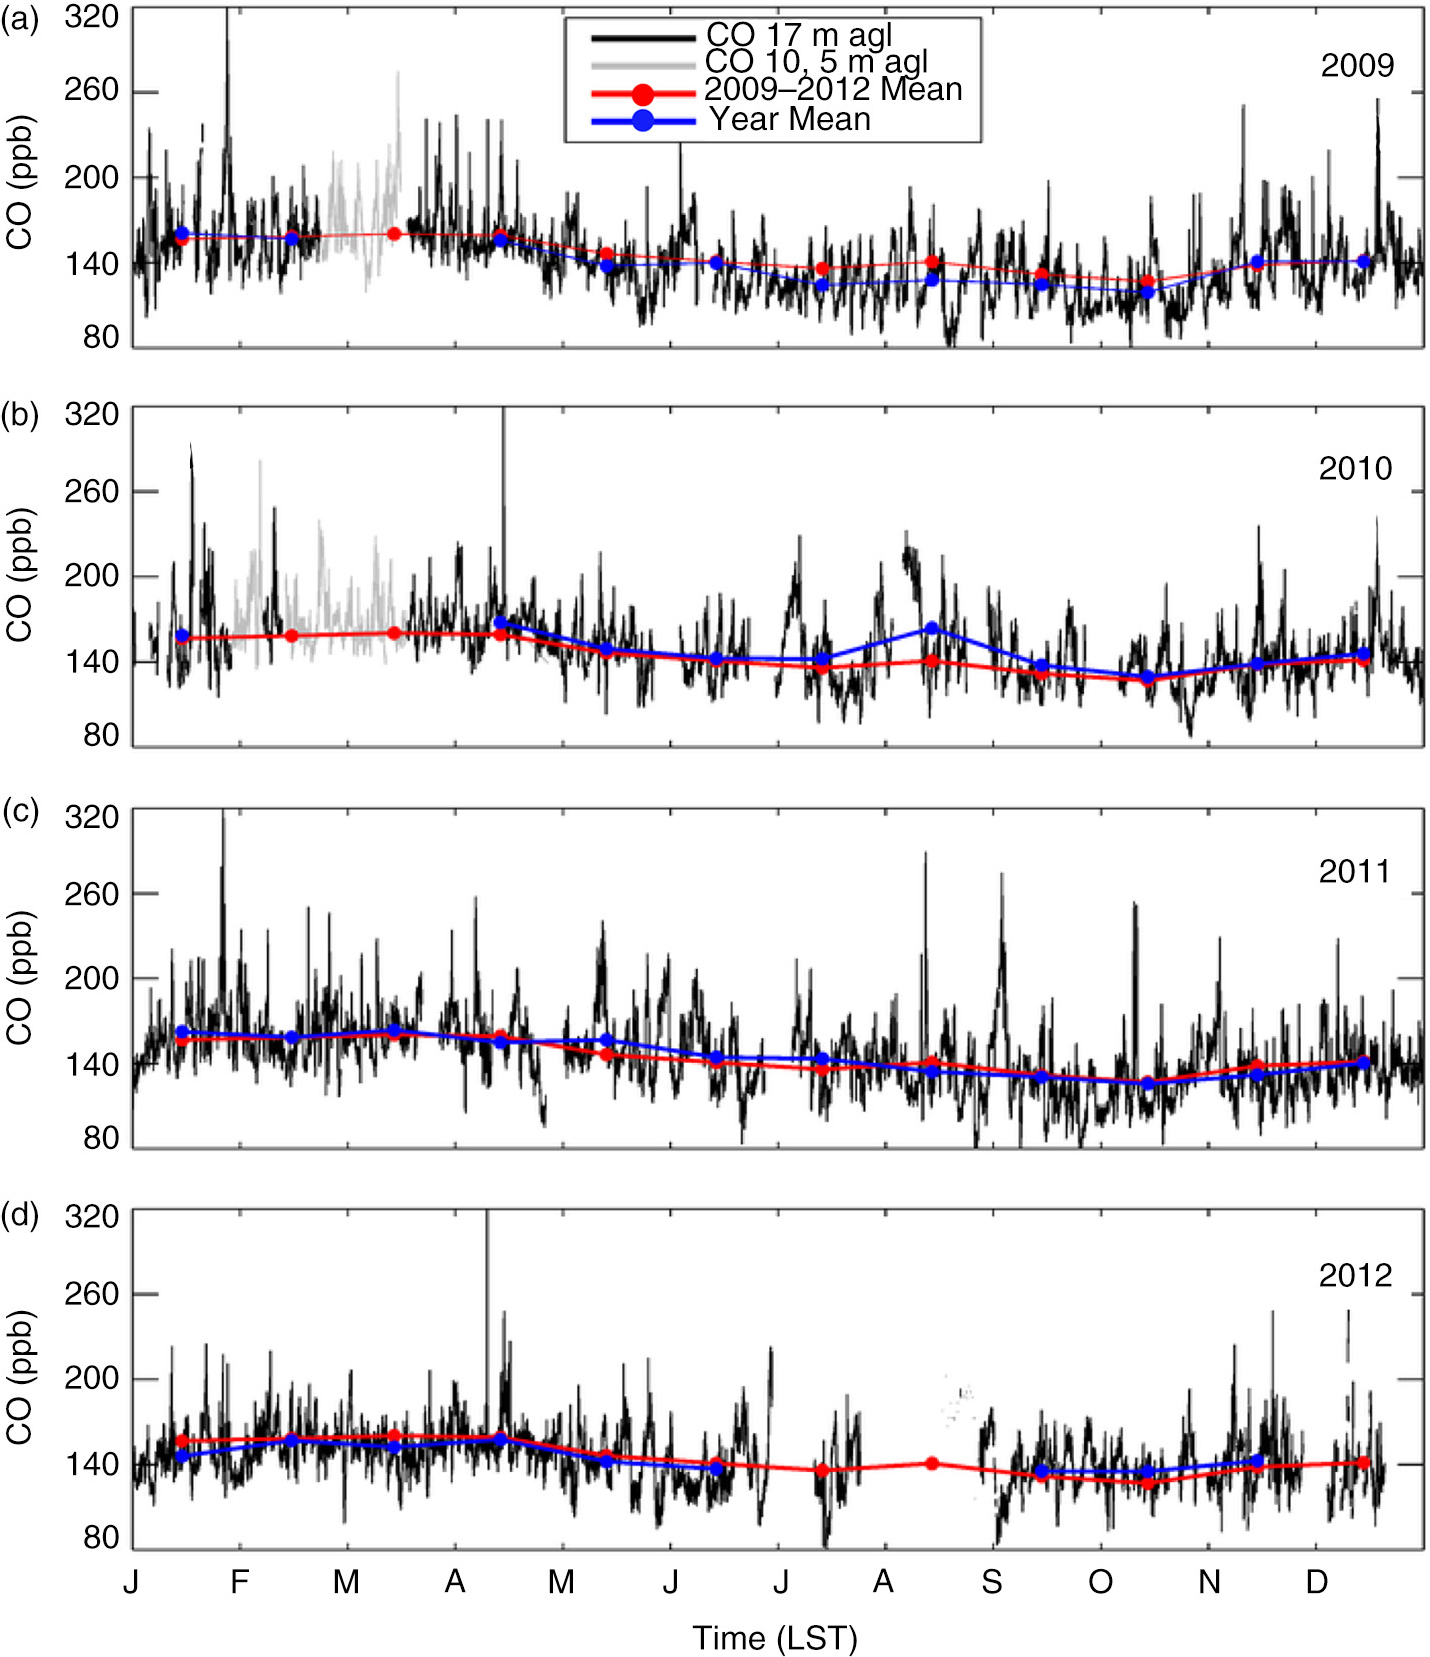
Fig. 4
Half-hour mean CO at 17 m agl at Pinnacles in 2009 (a), 2010 (b), 2011 (c) and 2012 (d) (black line). Data gaps have been filled in using data from 5 m and 10 m agl (grey line) when available. Superimposed red and blue lines represent monthly means for all years and the individual years, respectively, for months with >50% data completion. Data completion at 17 m agl for 2009, 2010, 2011 and 2012 is 89.2%, 74.7%, 93.1% and 78.3%, respectively. Measurements with an uncertainty >10 ppb are not shown.
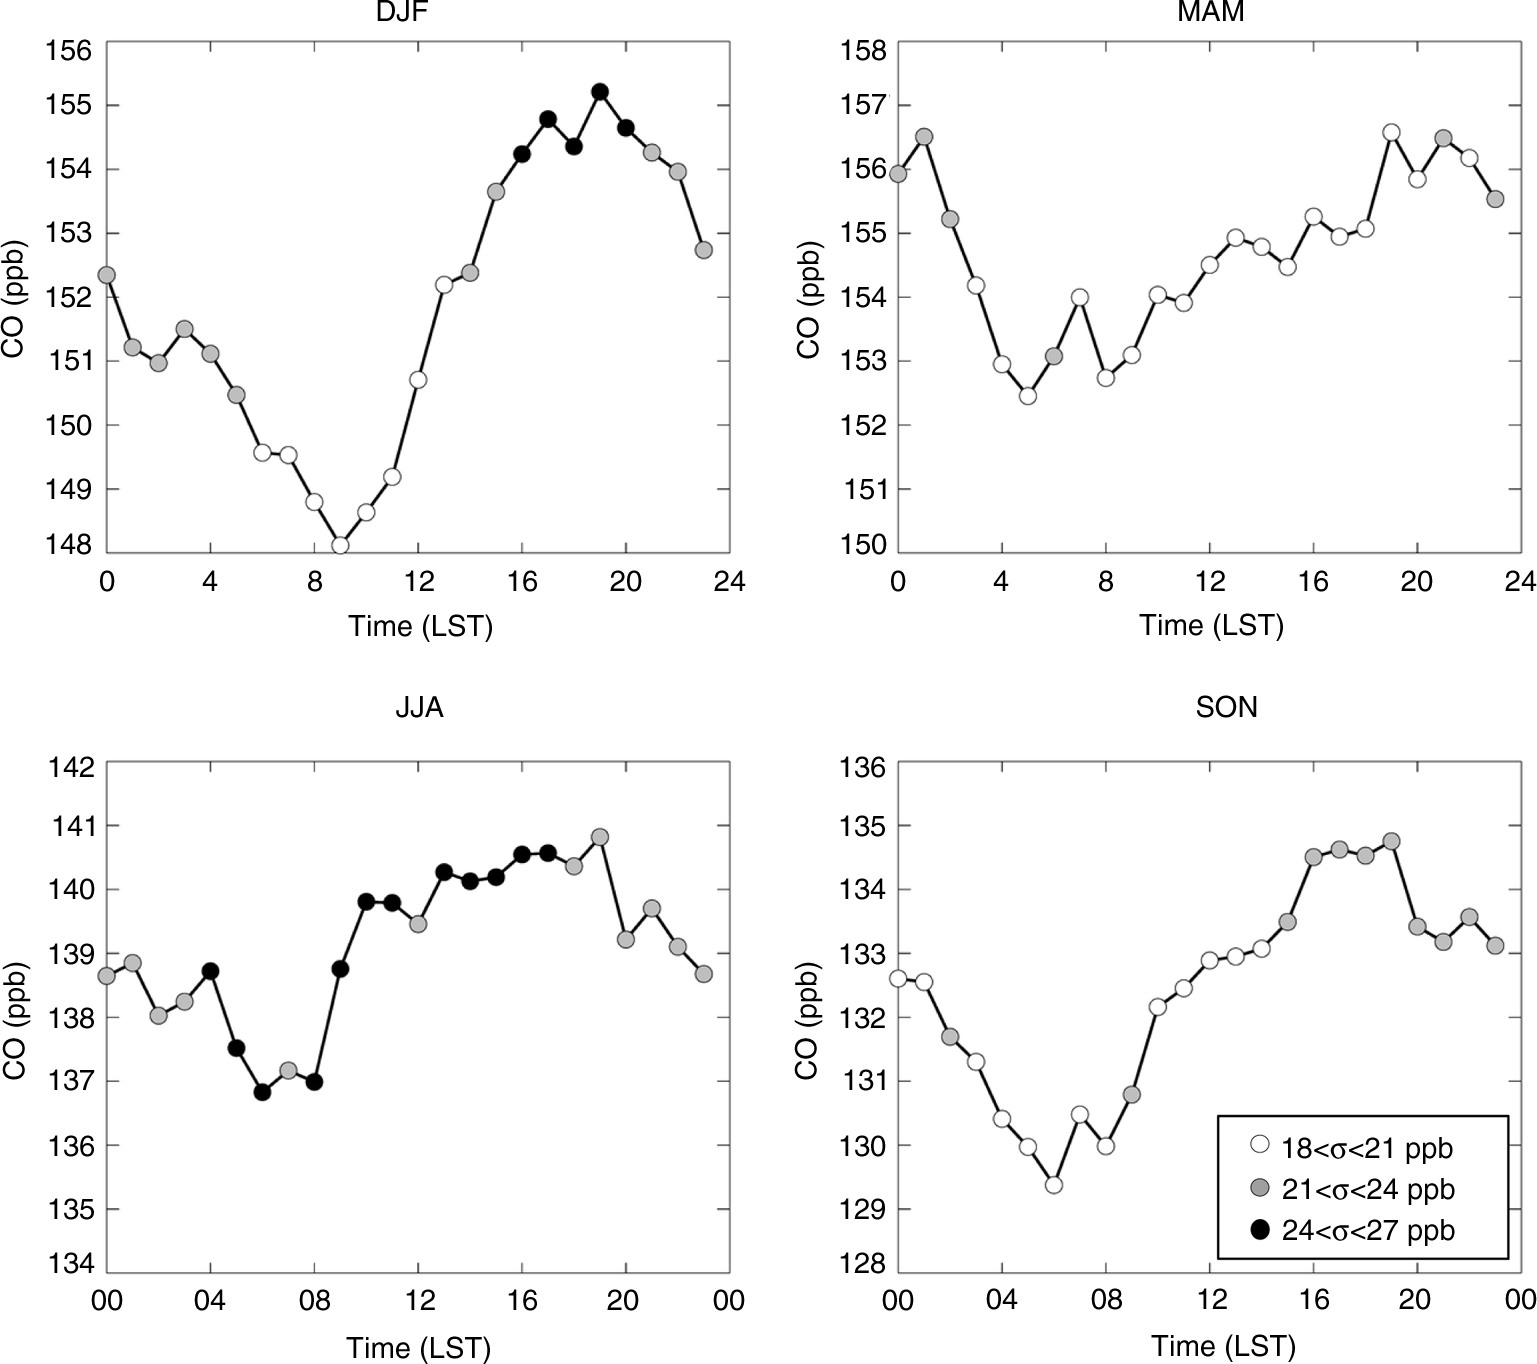
Fig. 5
Mean diurnal CO cycle at 17 m agl at Pinnacles from 1 January 2009 to 31 December 2012 in winter (DJF) (a), spring (MAM) (b), summer (JJA) (c) and fall (SON) (d). White, grey and black circles indicate standard deviations 18–21, 21–24 and 24–27 ppb, respectively. Data completion for winter, spring, summer, and fall is 80.7%, 84.7%, 78.4% and 91.9%, respectively. Note different values but the same range for each y-axis.
Table 3. CO amplitude in different seasons from other mountaintops in the literature at which CO has been studied. CO amplitudes are not available (NA) in all seasons at all sites.
Mount Kenya36789152520 Henne et al., 2008Jungfraujoch3580310115 Forrer et al., 2000Lulin Atmospheric Background Station286222162023Ou-Yang et al., 2014Mount Bachelor2763NA8NANAWeiss-Penzais et al., 2006Mei-Feng, Taiwan226950201075Lin et al., 2011Whistler21823353MacDonald et al., 2011Mount Tai1534NANA110100 Gao et al., 2005Pinnacles10177546This study
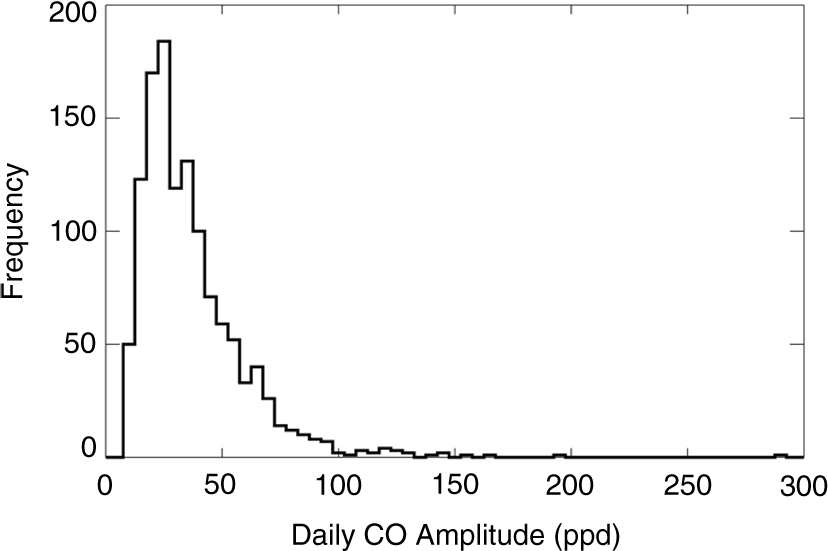
Fig. 6
Frequency distribution of daily CO amplitude, defined as the difference between the daily maximum and minimum half-hour CO mixing ratio, from 1 January 2009 to 31 December 2012 at 17 m agl at Pinnacles. Each bin size is 5 ppb.
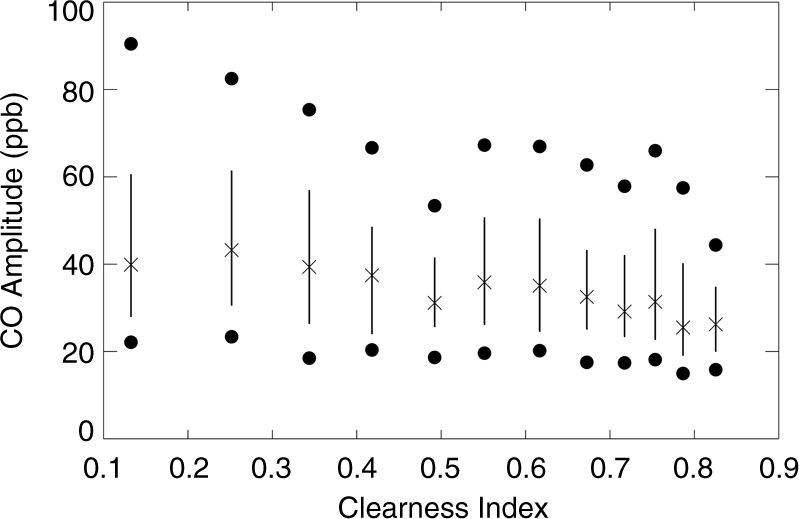
Fig. 7
Daily CO amplitude as a function of clearness index, divided into 12 bins (N=78) for each bin), from 1 January 2009 to 31 December 2012. Black X's represent 50th percentile; lines extend out to 25th and 75th percentiles; black circles represent the 10th and 90th percentiles.
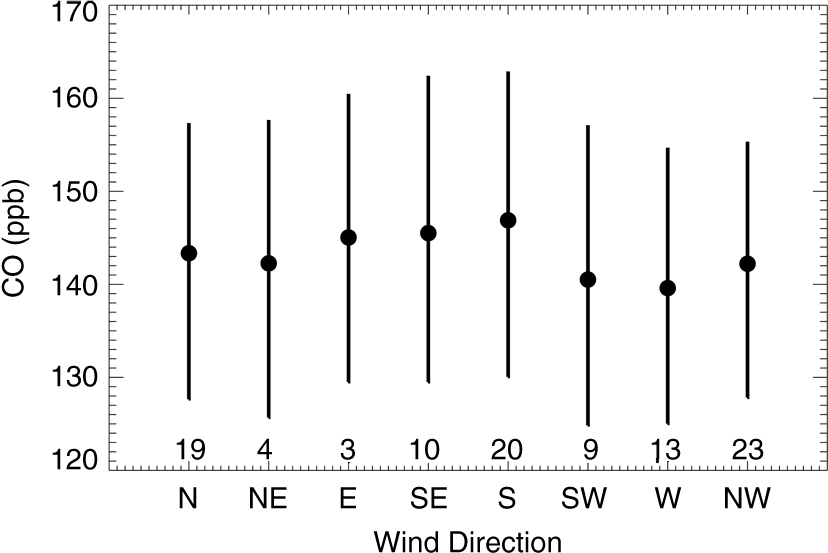
Fig. 8
Mean CO mixing ratio ±1 standard deviation as a function of wind direction for all days from 1 January 2009 to 31 December 2012 at 17 m agl at Pinnacles. Numbers shown are the percentage of the total. Numbers do not add to 100% because of rounding.
Table 4. Number and percentage of fair weather days with steady winds and fair weather days without steady winds
>50% data coverage565100Steady winds27749Steady northwesterly winds (Type I)18733Days with a wind shift28851Days with a wind shift from northwesterly to southerly (Type II)12622Days that are not Type I or Type II25245
Table 5. Occurrence of Type I and Type II days as a function of season
Type I, all14.215.810.910.7Type I, light winds (<3.9 m s−1)4.27.69.04.9Type I, strong winds (>3.9 m s−1)9.78.21.95.8Type II, all9.211.48.49.1Type II, light winds (<3.3 m s−1)1.73.36.55.5Type II, strong winds (>3.3 m s−1)7.57.13.02.7
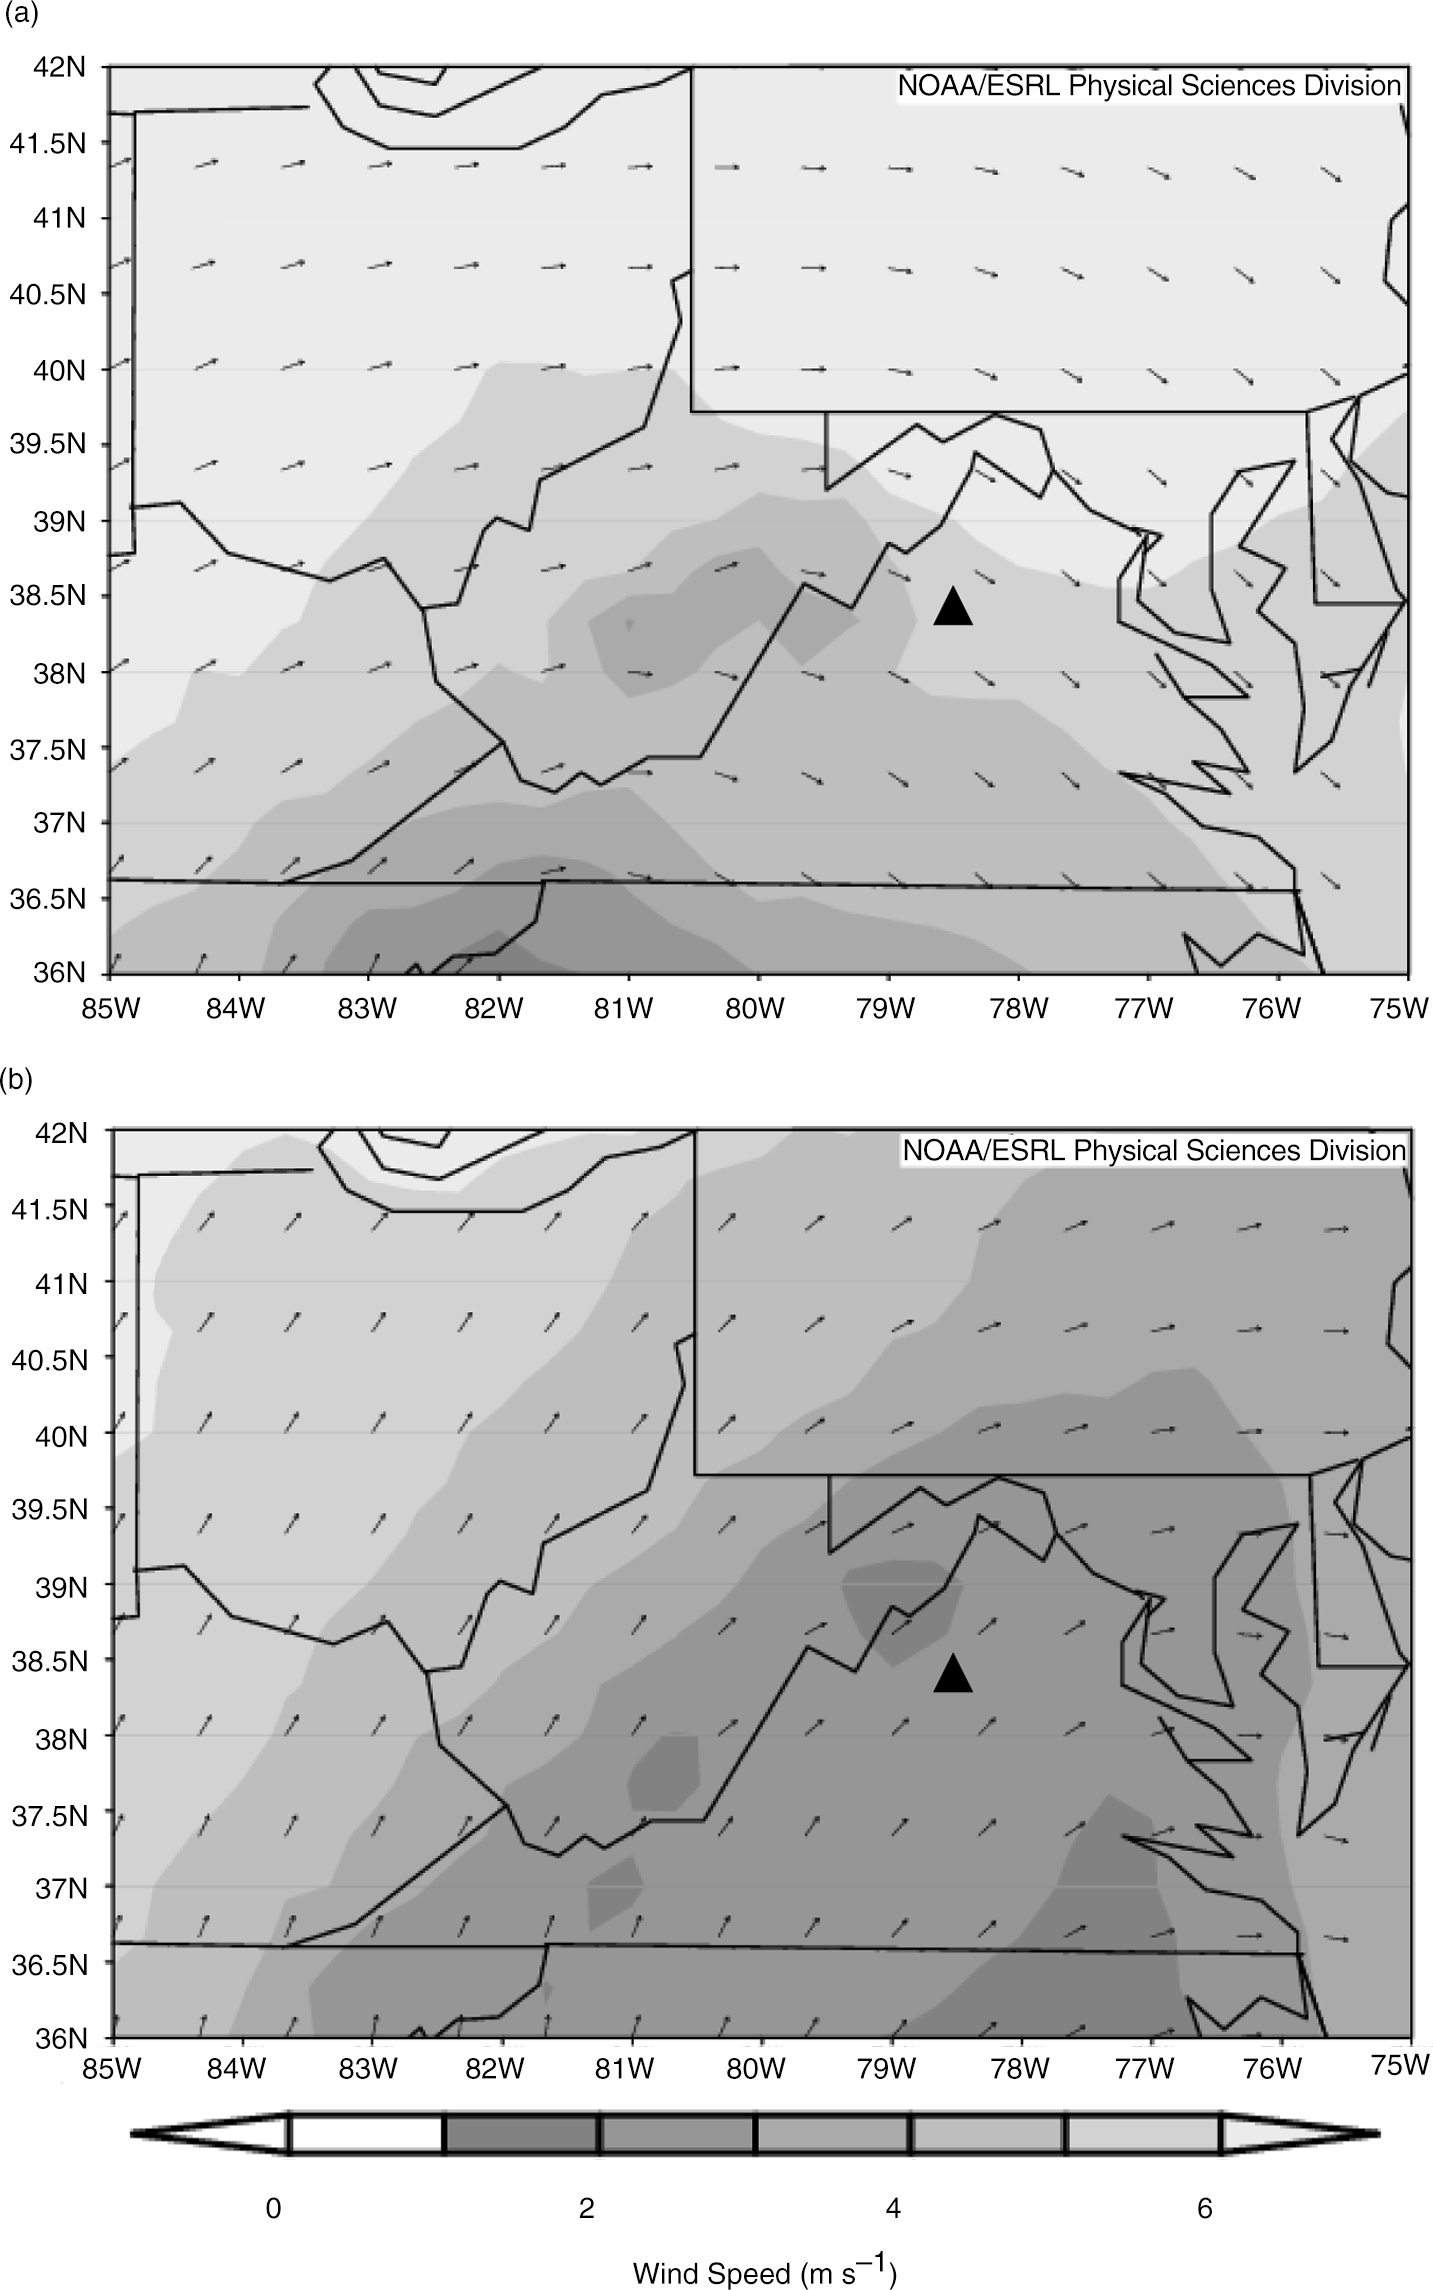
Fig. 9
NARR composites on Type II days of 900 mb wind speed and direction at 0900 UTC (a) and 2100 UTC (b). The location of Pinnacles is indicated by a black triangle. Data are available from <ftp://ftp.cdc.noaa.gov/NARR/>
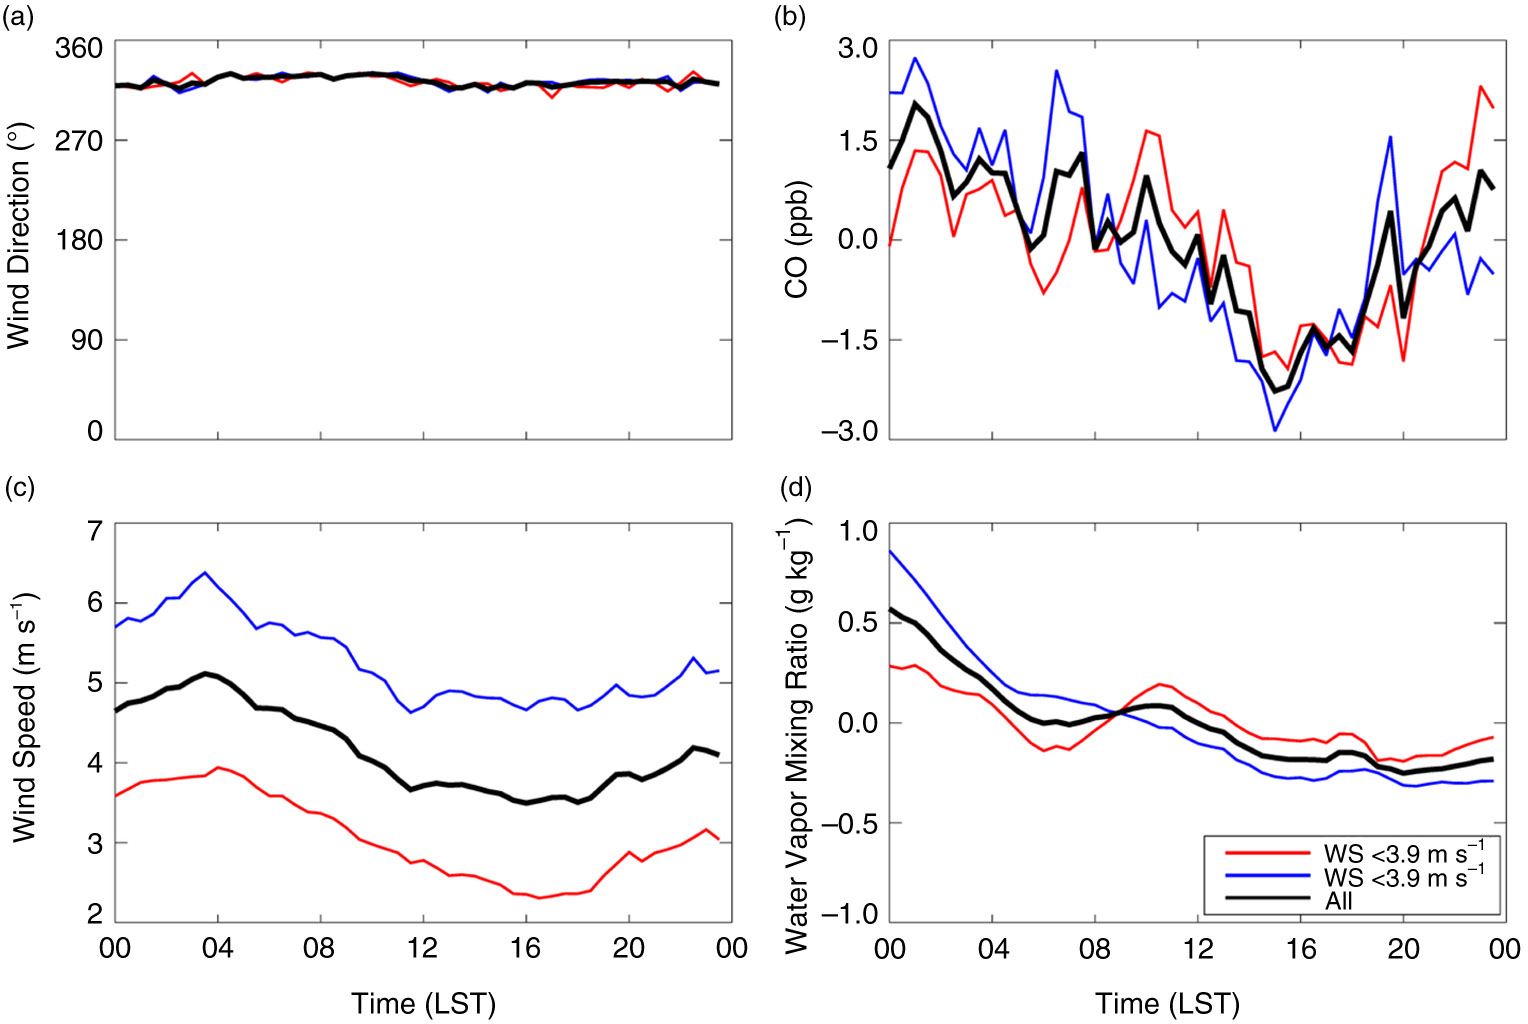
Fig. 10
Mean wind direction (a), CO (b), wind speed (c) and water vapour (d) on Type I fair weather days. Red, blue and black lines represent Type I days with light winds (<3.9 m s−1, N=94), Type I days with strong winds (>3.9 m s−1, N=93), and all Type I days (N=187), respectively. Daily means are removed from panels (b) and (d) for clarity. All measurements are made at 17 m agl at Pinnacles.
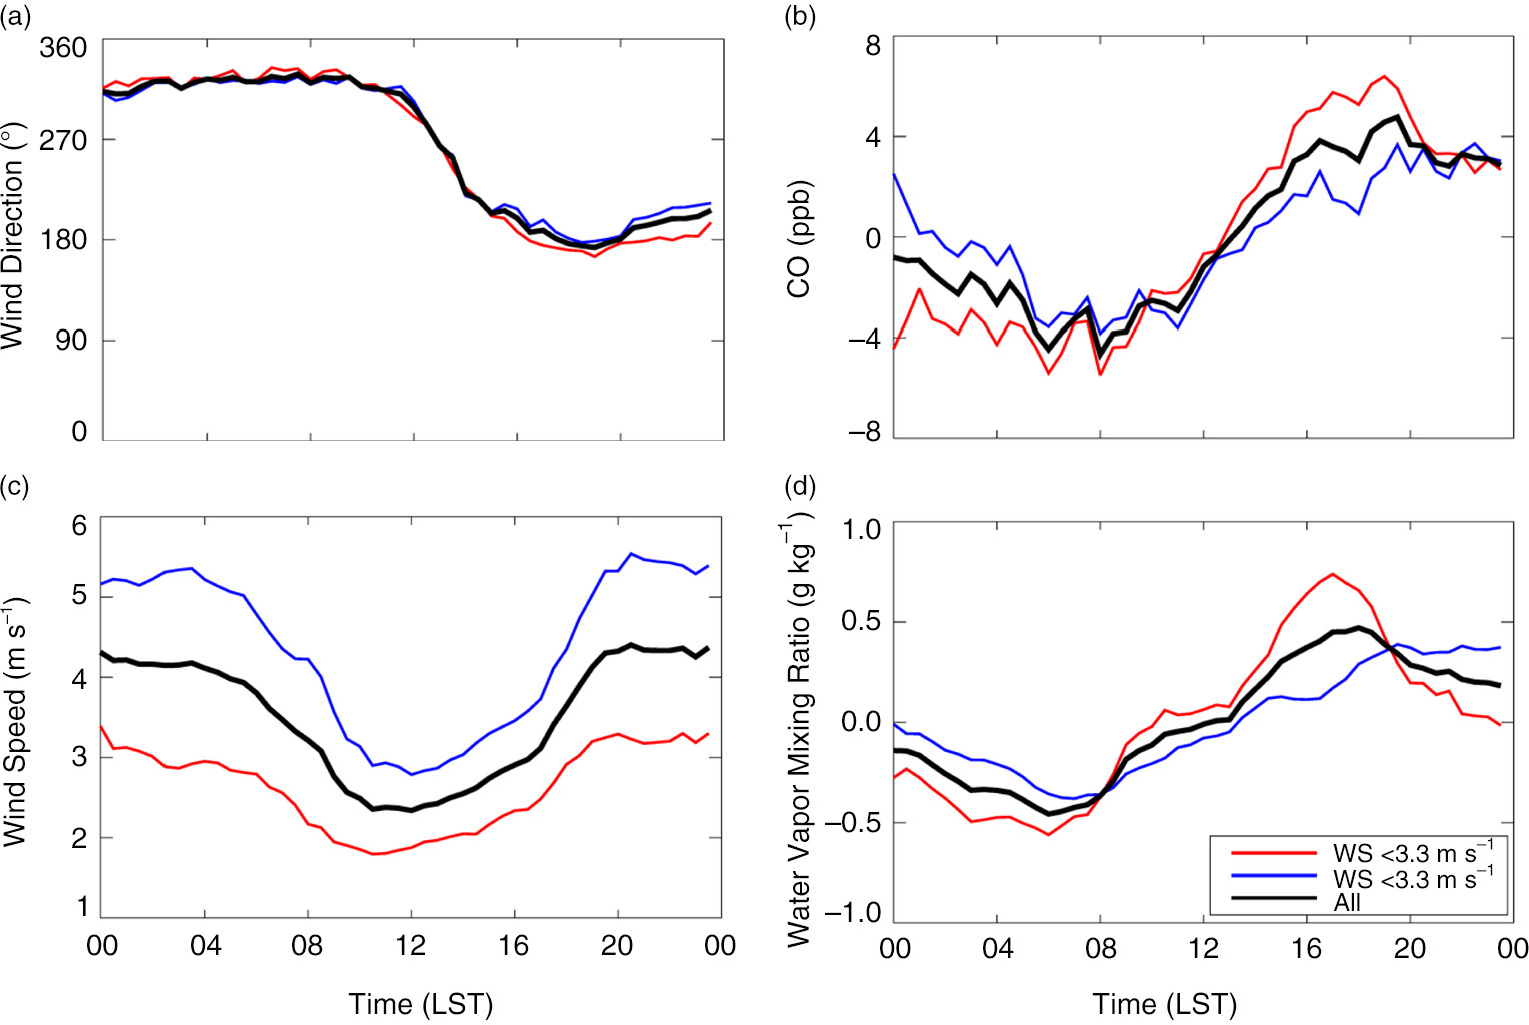
Fig. 11
Same as Fig. 10 but for Type II days. Red, blue and black lines represent Type II days with light winds (<3.3 m s−1, N=62), Type II days with strong winds (>3.3 m s−1, N=64) and all Type II days (N=126), respectively. Note the y-axes in panels (b) and (c) are different from Fig. 10.