
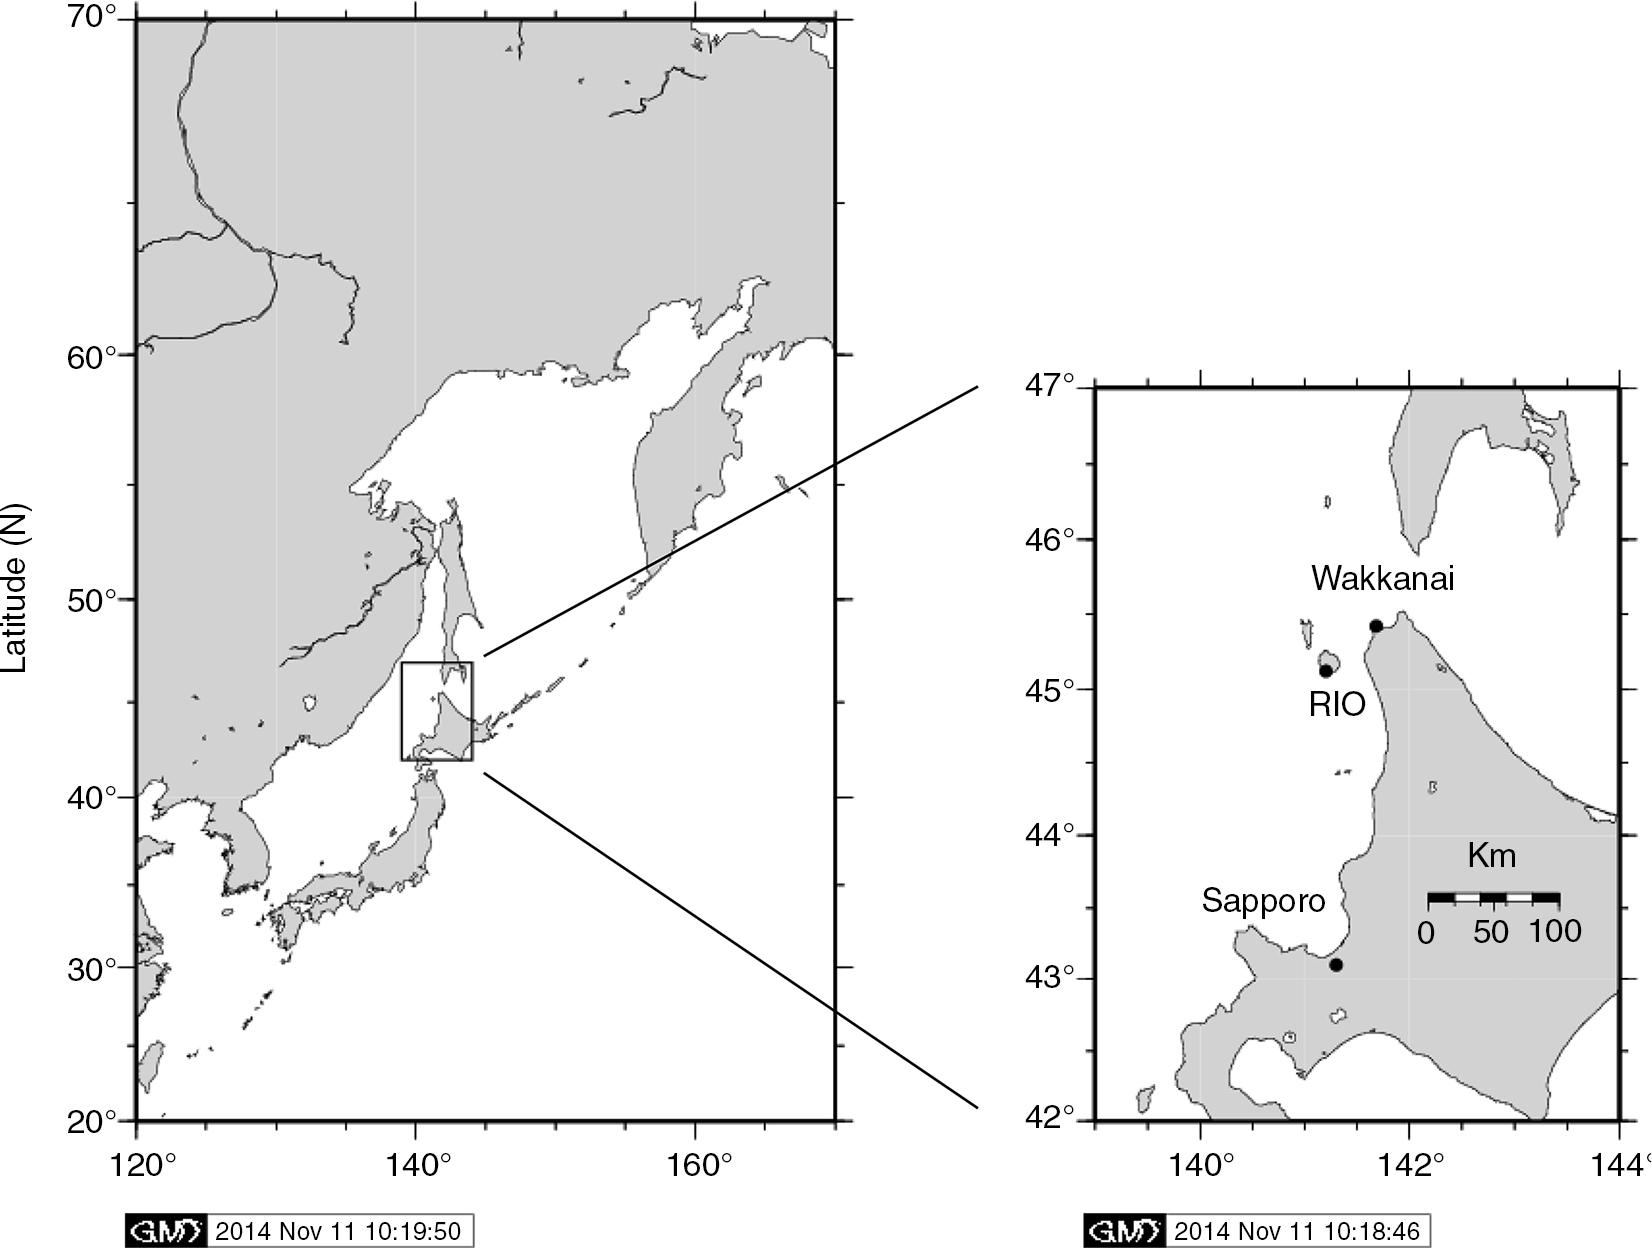
Fig. 1
The observation site for measurements of O3 and CO2 mixing ratios in the interstitial air of the seasonal snowpack on Rishiri Island (RIO). Chemical kinetic experiments were conducted at the RIO and on the campus of Hokkaido University, Sapporo.
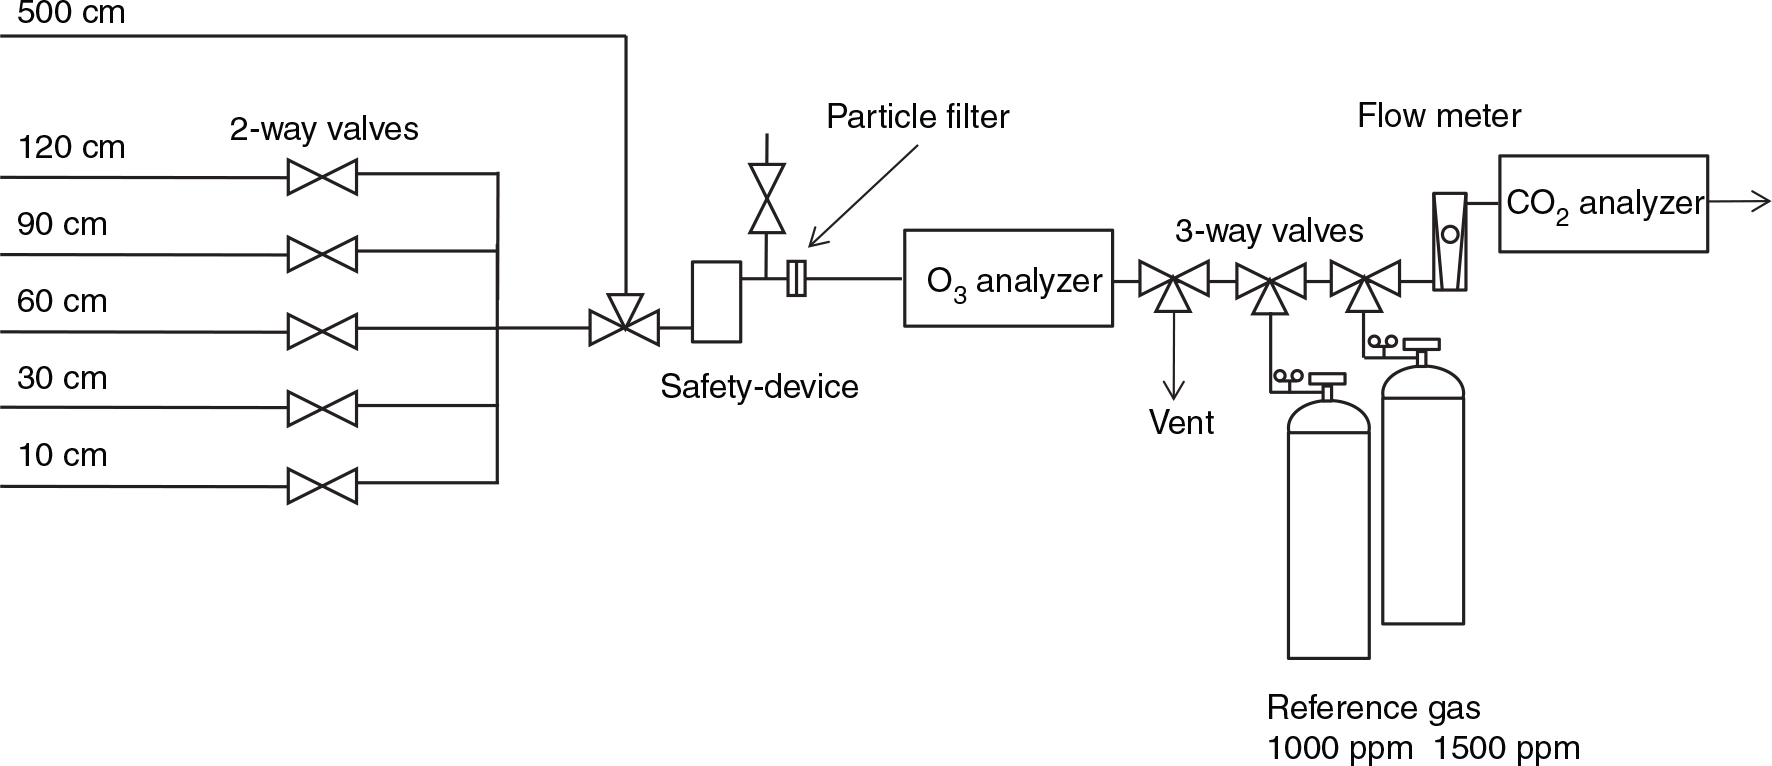
Fig. 2
A schematic diagram of the system used for taking the measurements of the O3 and CO2 mixing ratios in the interstitial air of the seasonal snowpack on Rishiri Island during the winter of 2010/11.
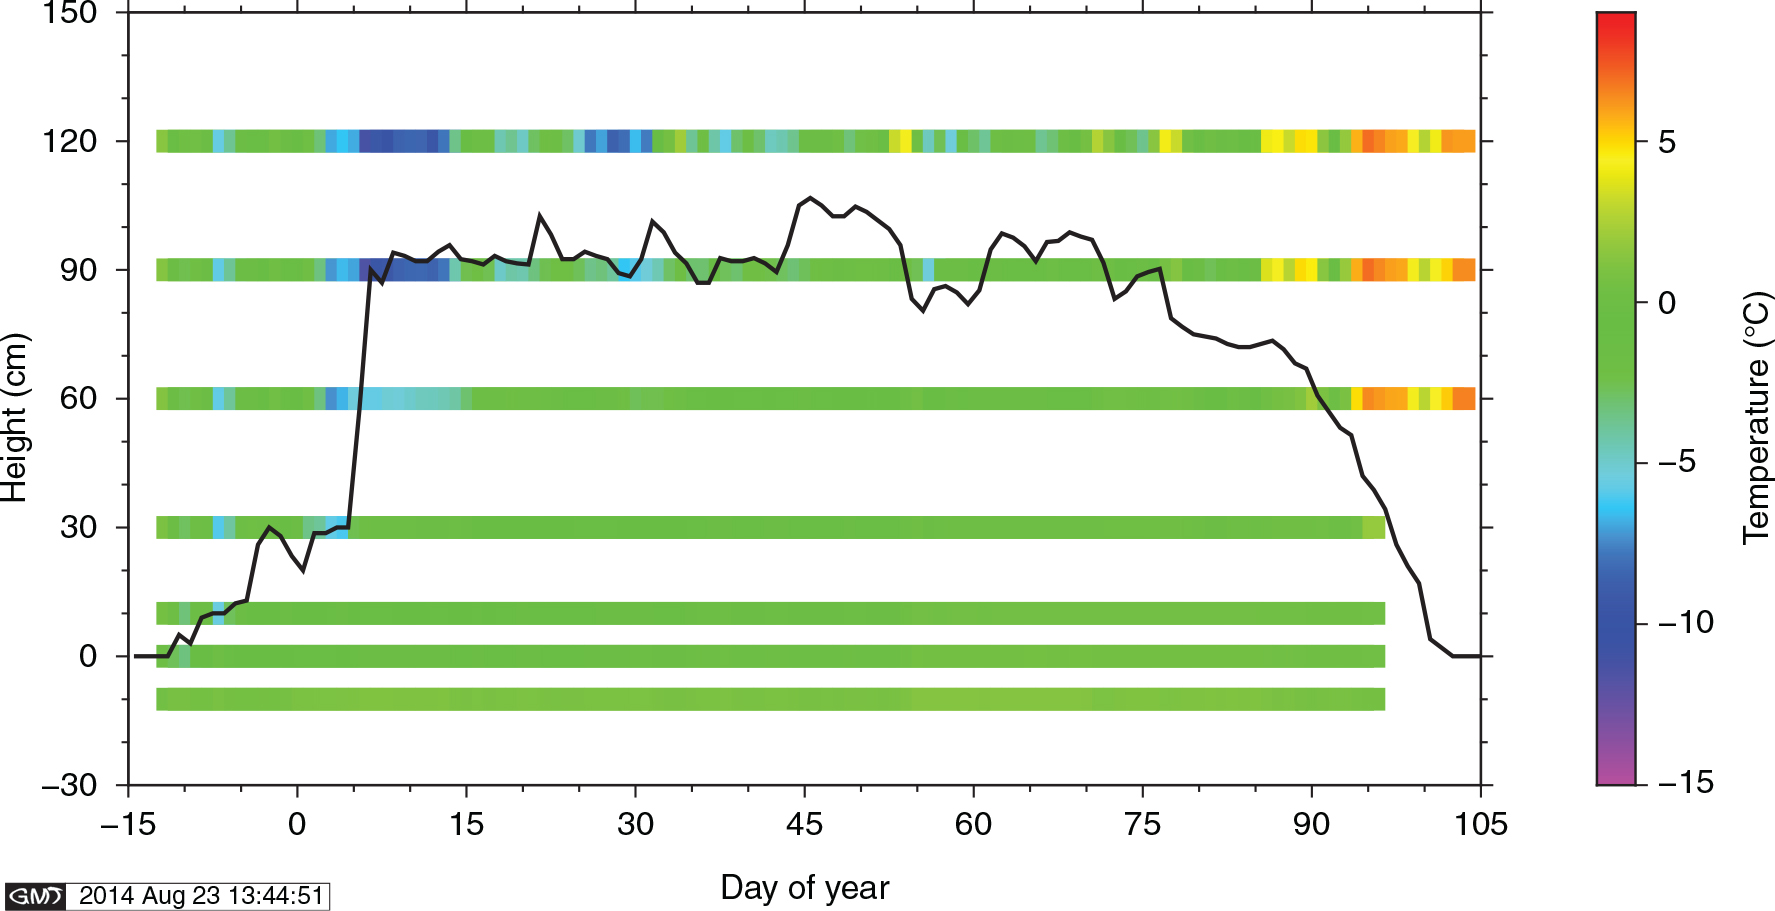
Fig. 3
A colour plot of the temperatures at −10, 0, 10, 30, 60, 90 and 120 cm above the ground. The solid line shows the snow depth and the horizontal axis the days of the year in 2011. Negative values indicate days prior to 1 January 2011.
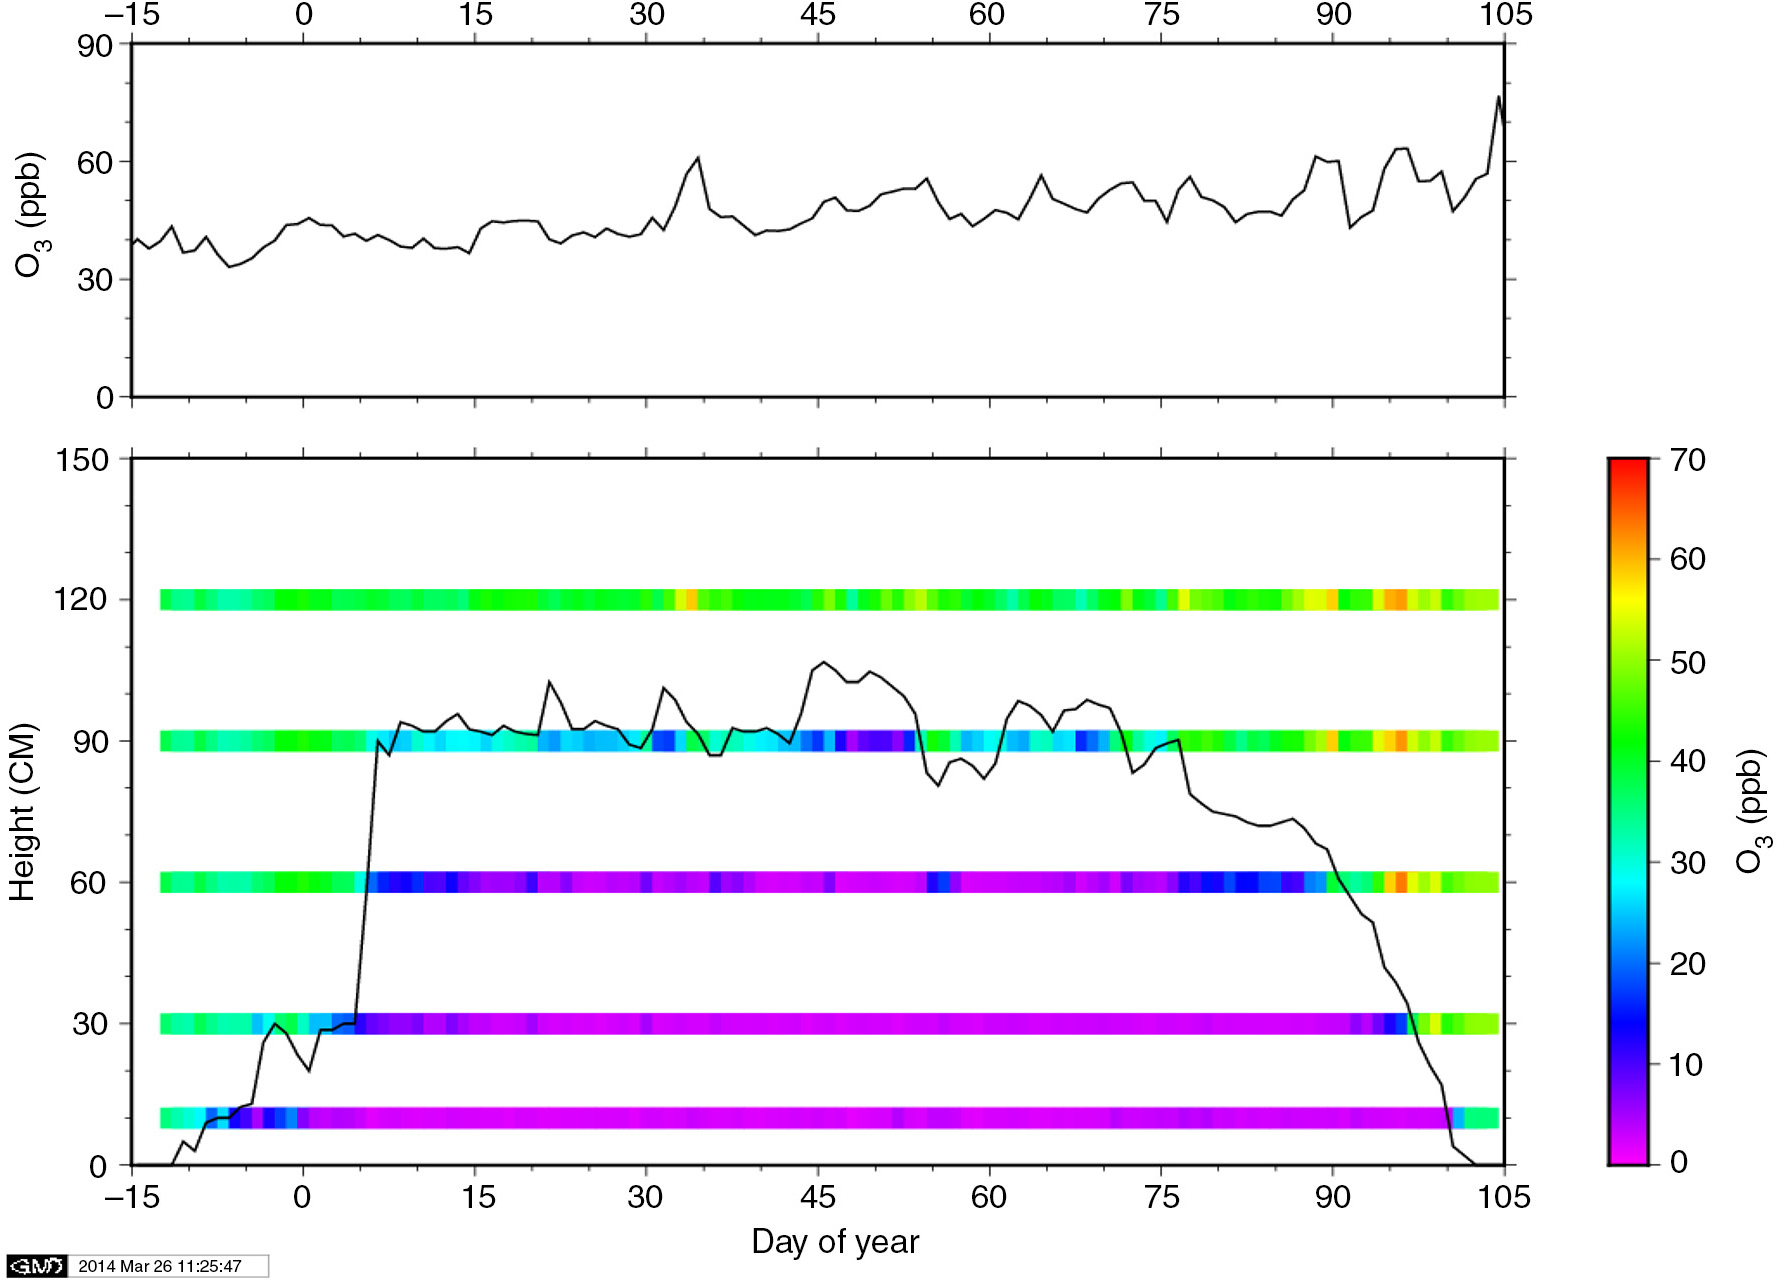
Fig. 4
A colour plot of the O3 mixing ratio at 10, 30, 60, 90 and 120 cm above the ground (lower panel) and 500 cm above the ground (upper panel). In the lower panel, the solid line shows the snow depth and the horizontal axis the day of the year in 2011. Negative values indicate days prior to 1 January 2011.
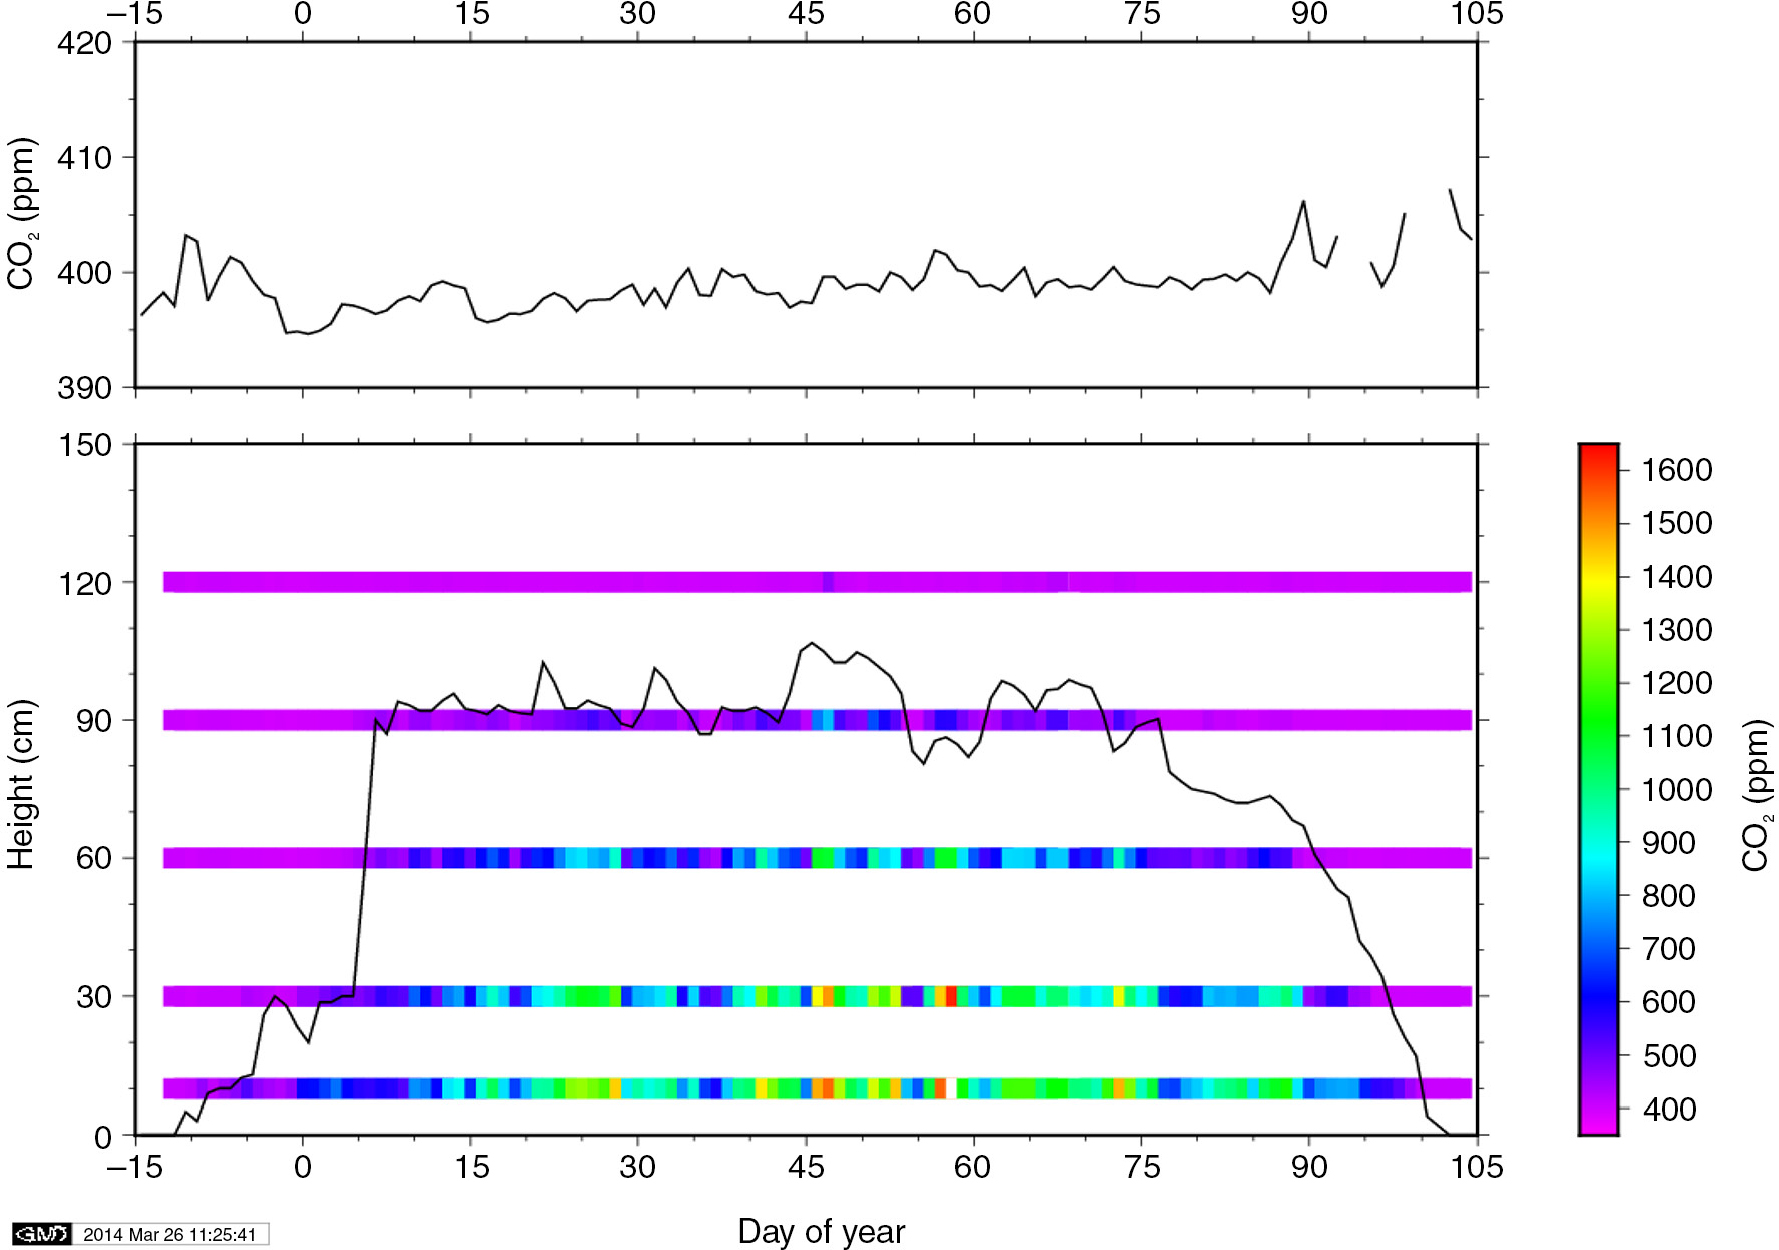
Fig. 5
A similar plot as that in Fig. 4 except for the CO2 mixing ratio.
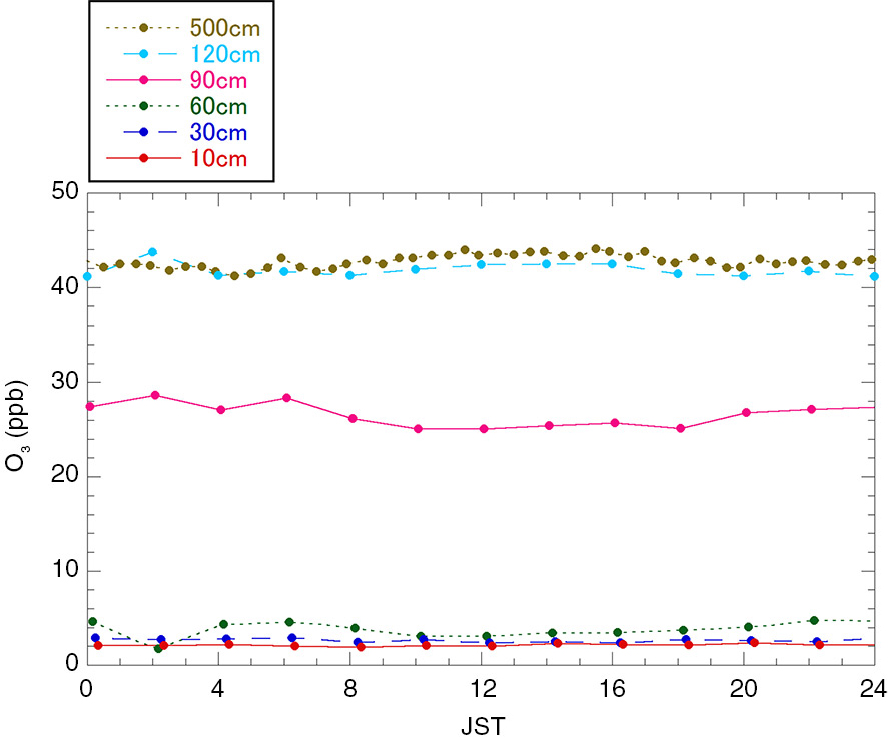
Fig. 6
Diurnal variations in the O3 mixing ratio in the interstitial air of the seasonal snowpack and overlying air on Rishiri Island. Solid circles at each height show the median value of 5-minute averages during the period from 15 January to 14 February 2011.
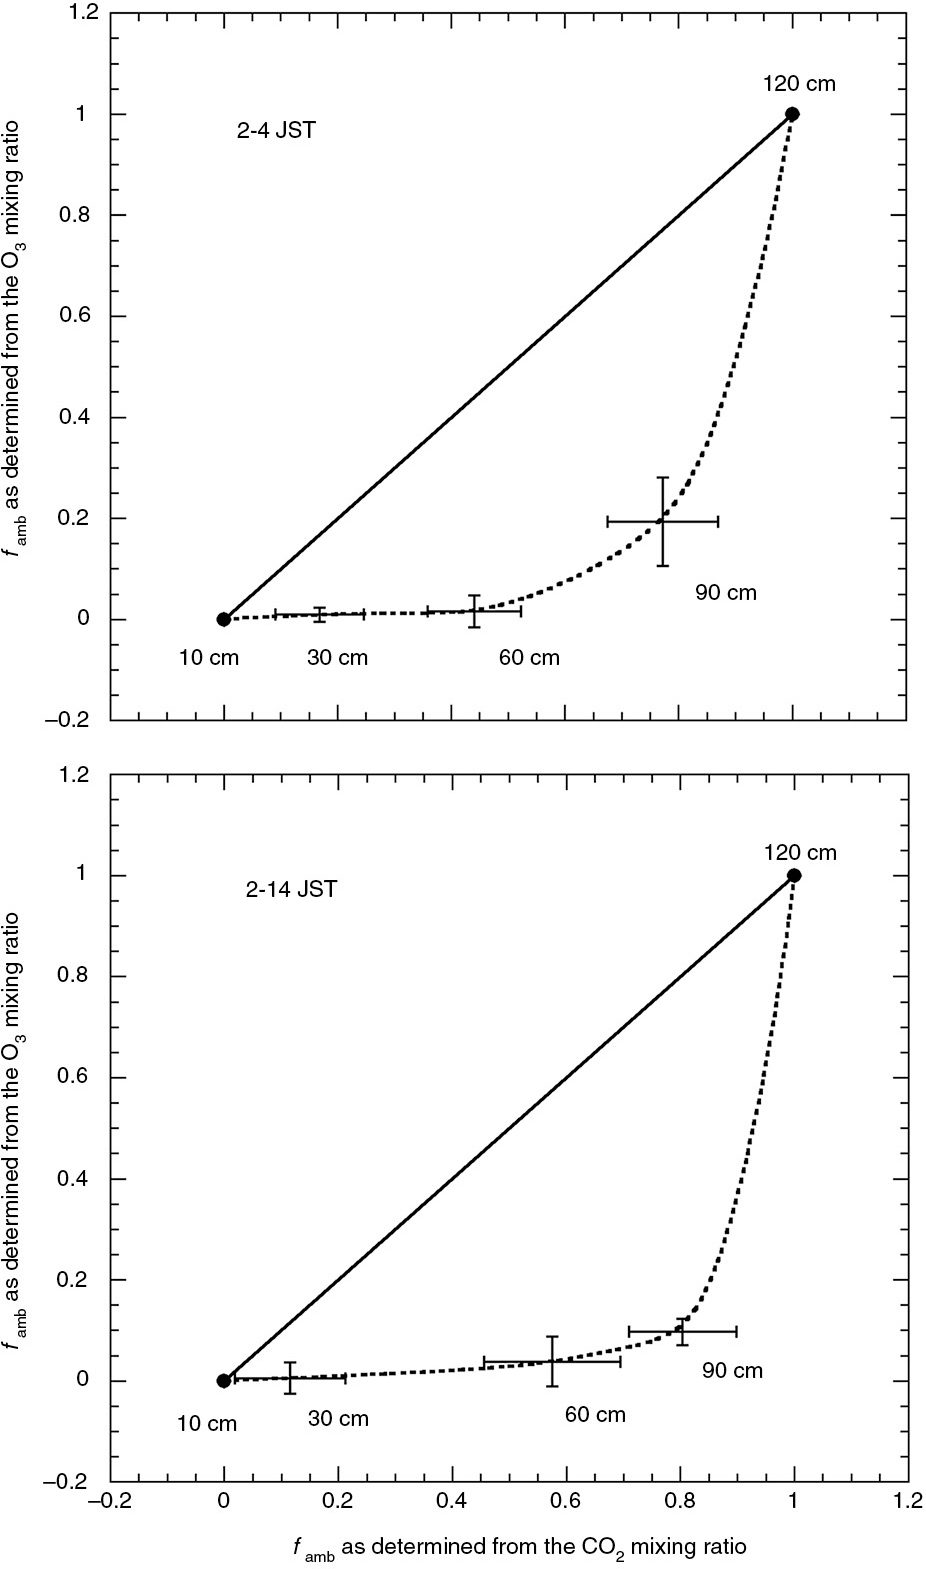
Fig. 7
The mean fraction of ambient air to the total volume of interstitial air (f amb, fraction of snowpack air derived from ambient air) as determined from the O3 mixing ratio in relation to the mean fraction as determined from the CO2 mixing ratio at 2–4 JST (top) and 12–14 JST (bottom) during the period from 18–23 February 2011. The error bar at each height shows the standard deviation of the mean.
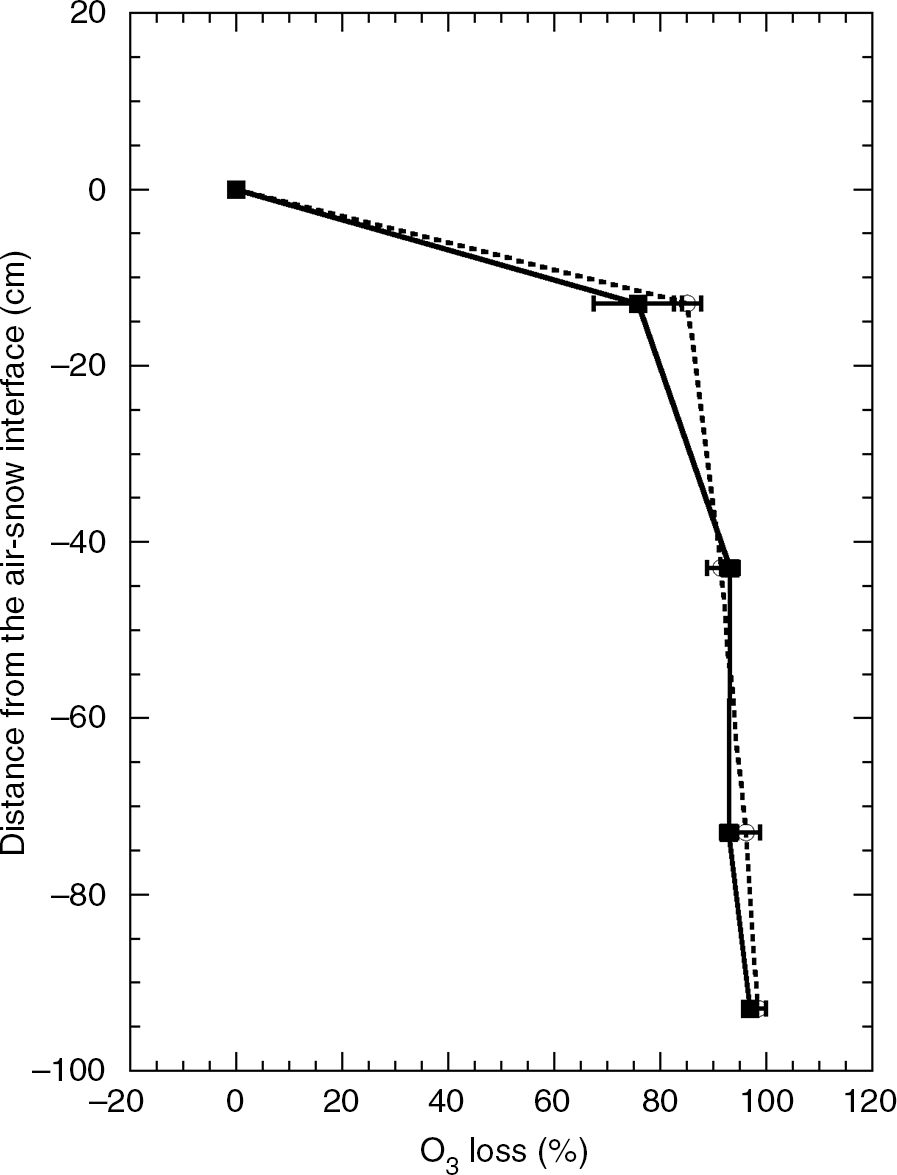
Fig. 8
O3 depletion in the seasonal snowpack relative to the O3 mixing ratio in the ambient air above the snow surface from 18 February to 23 February 2011. The atmospheric O3 mixing ratio at 120 cm was assumed to be equal to that at the snow surface (0 cm). The dotted line with open circles shows O3 depletion during the day (12–14 JST), and the solid line with solid squares at night (2–4 JST).
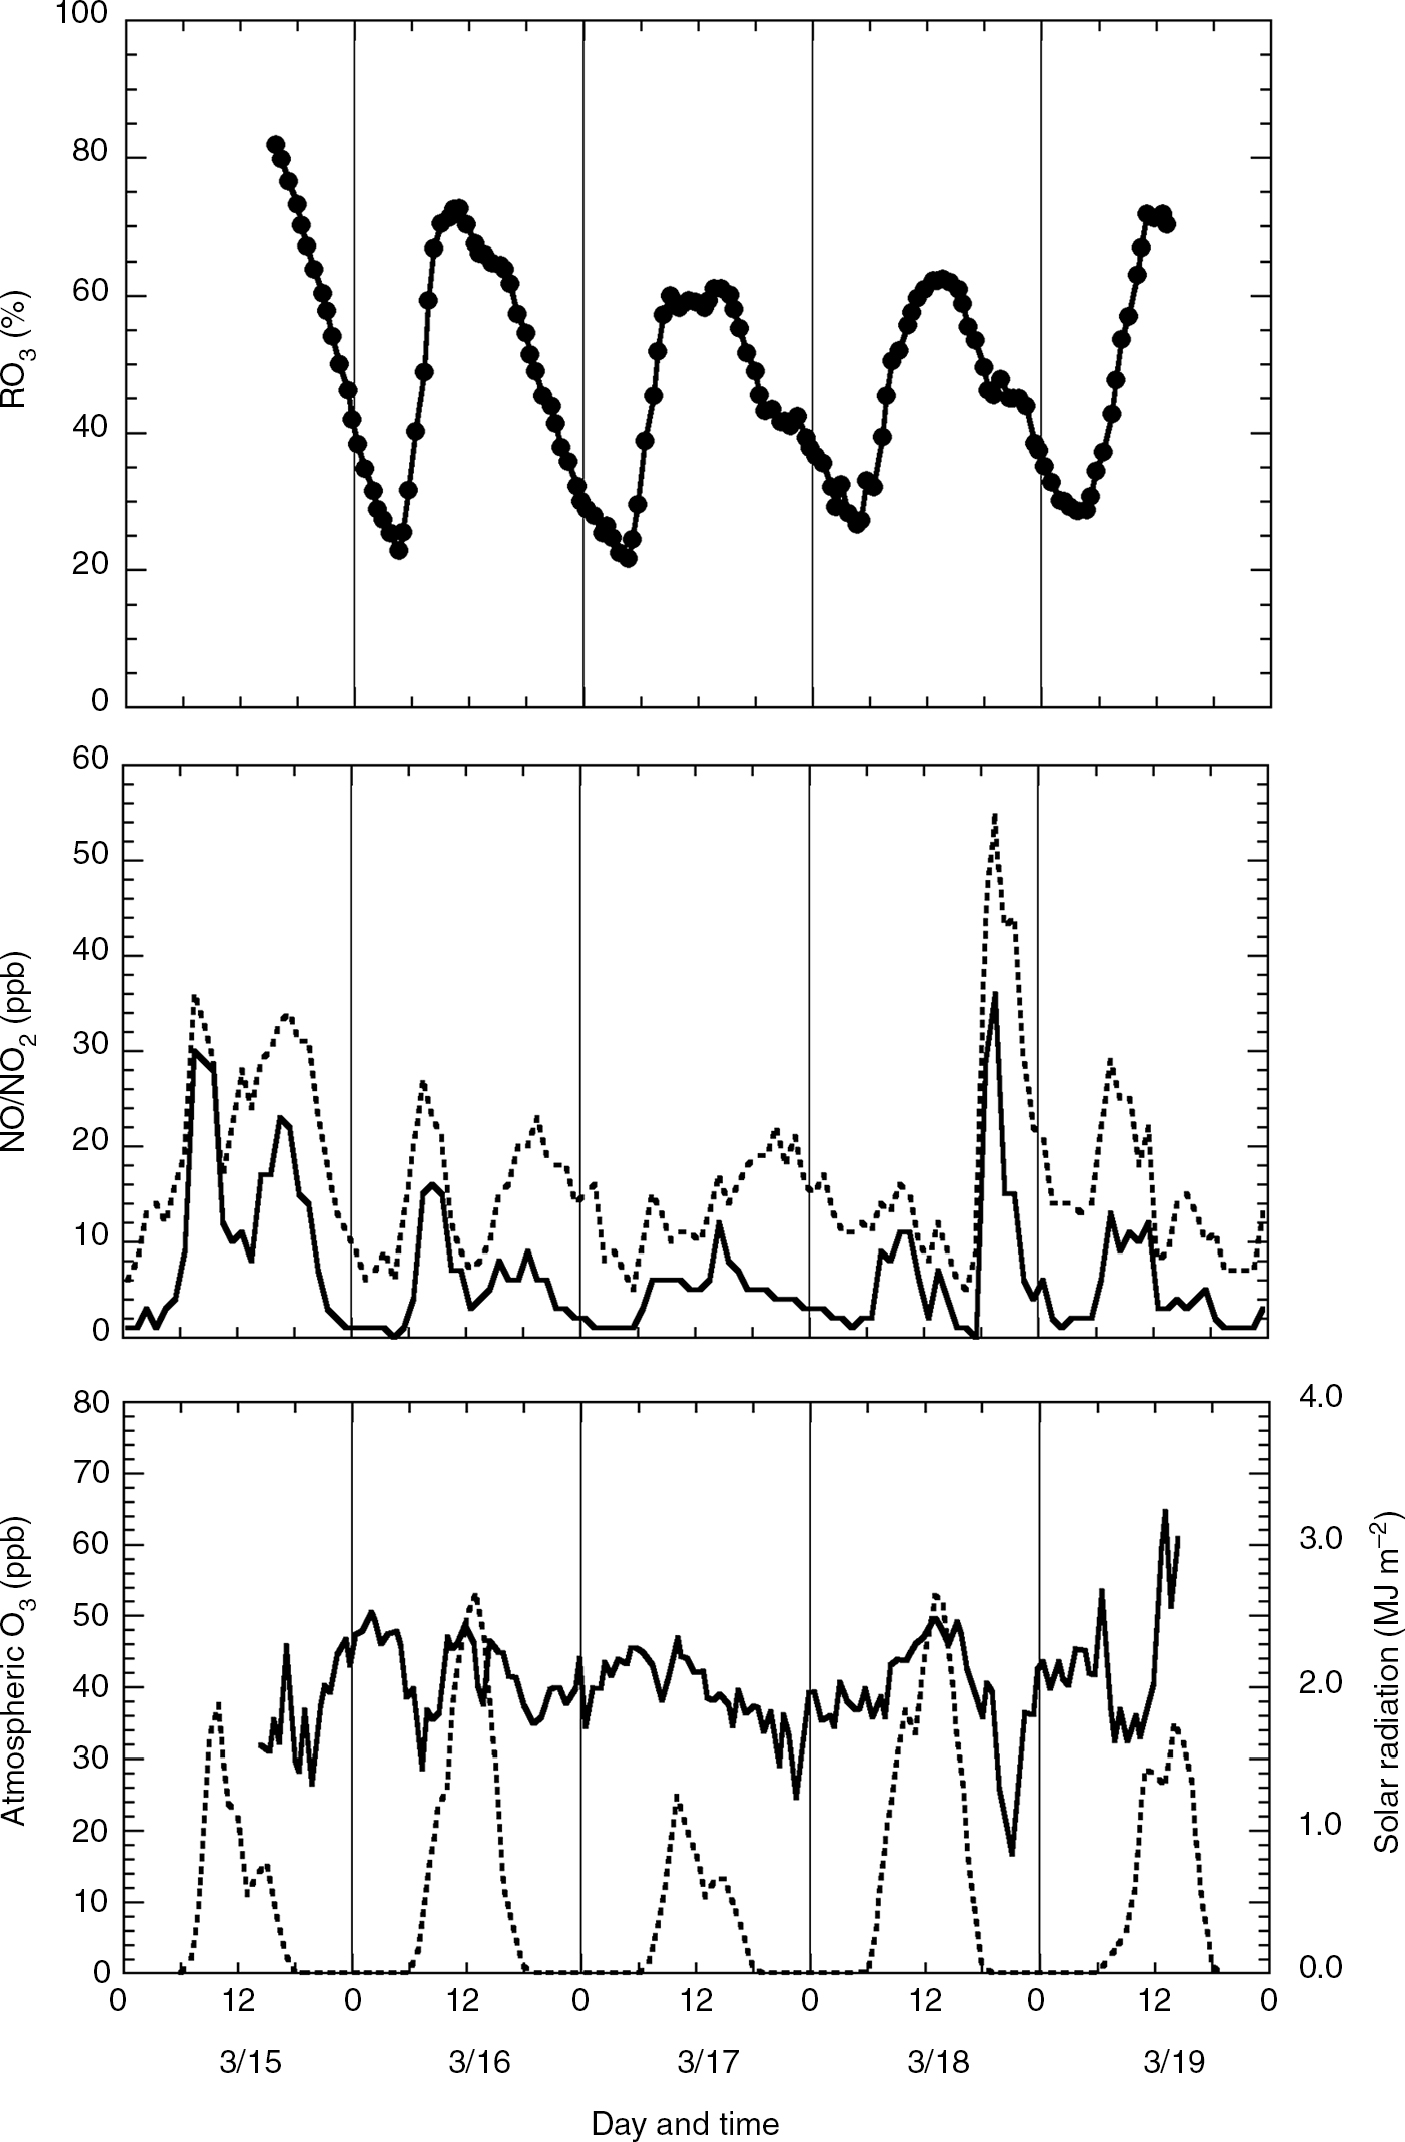
Fig. 9
Kinetic experiment of O3 loss in the acryl chamber filled with snow during 15–19 March 2011. In the lower panel, the solid line shows the ozone mixing ratio in the filtered ambient air used for the experiment, and the dotted line shows the solar radiation at the Sapporo weather observatory, 2 km away from the experimental site at HU. In the middle panel, the solid line shows the atmospheric NO measured at the N19 station operated by Sapporo, 1.2 km away from our site, and dashed line NO2 which was estimated by subtracting NO from NOX. In the upper panel, the solid circles show the five-point moving averages.
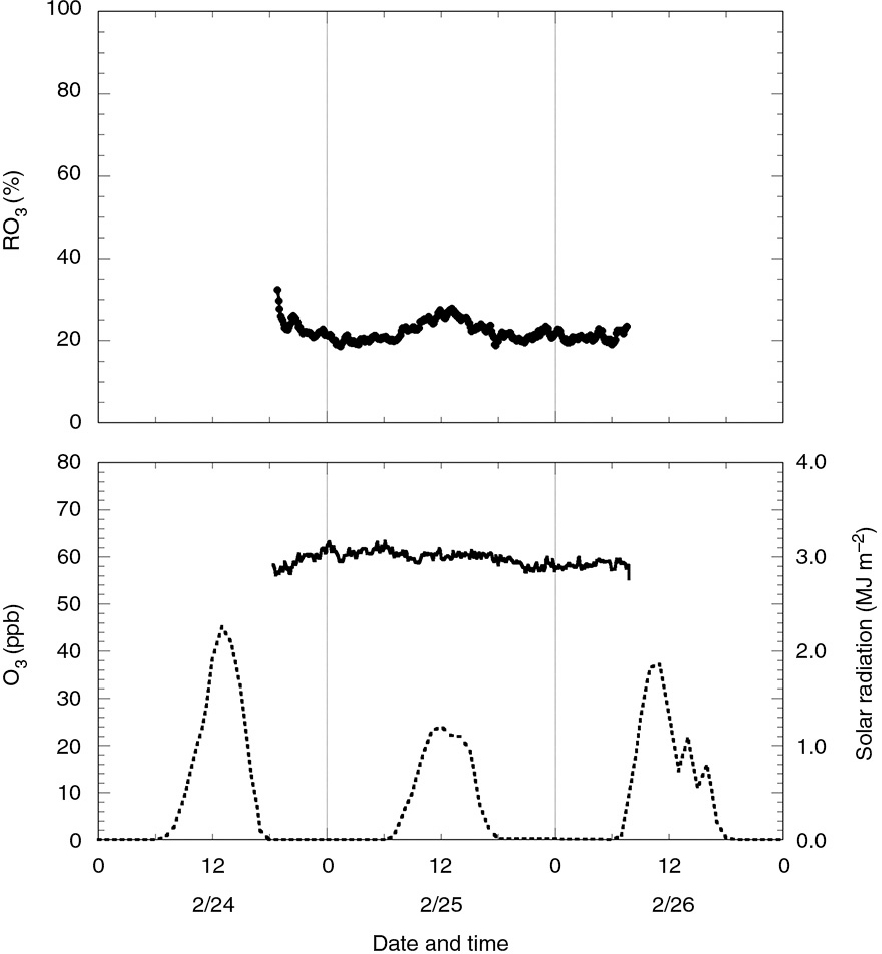
Fig. 10
Kinetic experiment of O3 loss in the acryl chamber filled with snow during 24–26 February 2012. In the lower panel, the solid line shows the O3 concentration produced by the O3 generator and the pure air in the cylinder, and the dashed line the solar radiation at Sapporo weather observatory. In the upper panel, the solid circles show the five-point moving averages.