
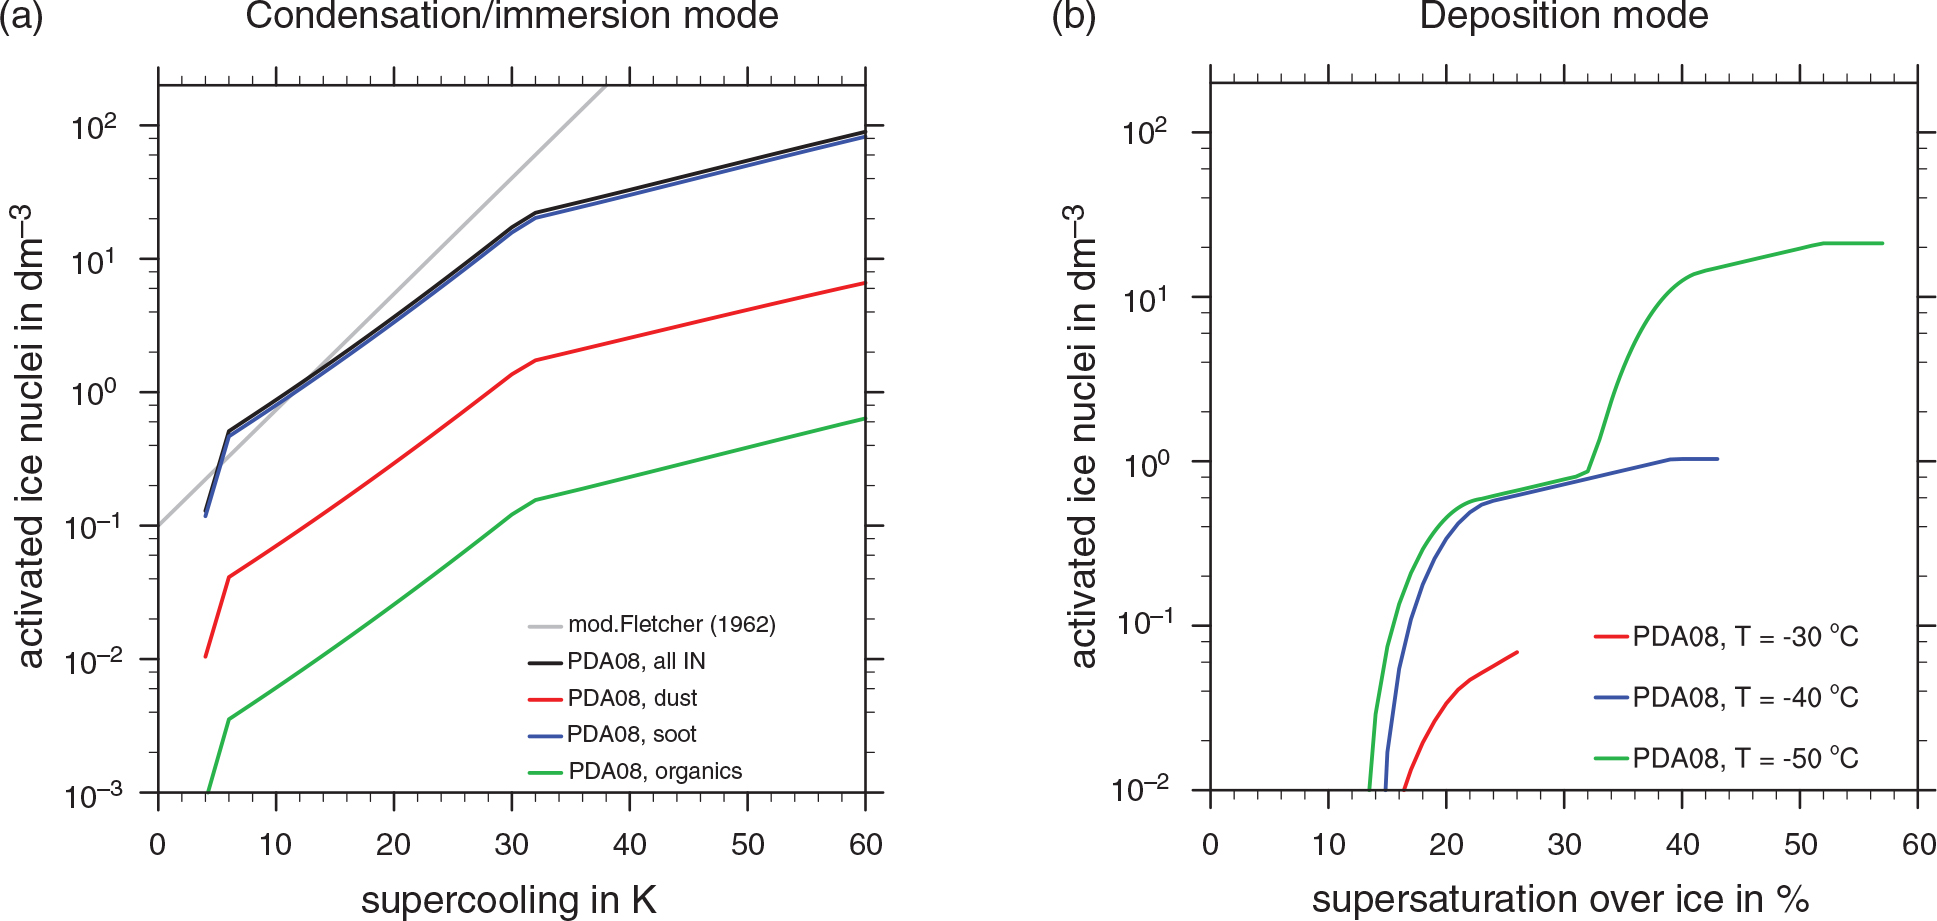
Fig. 1
The activated ice nuclei (IN) for soot, insoluble organic carbon and dust/metallic particles according to Phillips et al. (2008) using the initial number densities n DM=162 dm−3, n BC=15 cm−3 and n O=1.77 cm−3. The plots depict the activated IN for (a) the condensation/immersion freezing mode as a function of temperature assuming saturation w.r.t. liquid water and (b) the deposition mode as a function of supersaturation over ice and temperature (different colours). The activated IN number density from the modified Fletcher (1962) equation is depicted by the grey line, and the contribution from different aerosol species for PDA08 are shown with different colours.
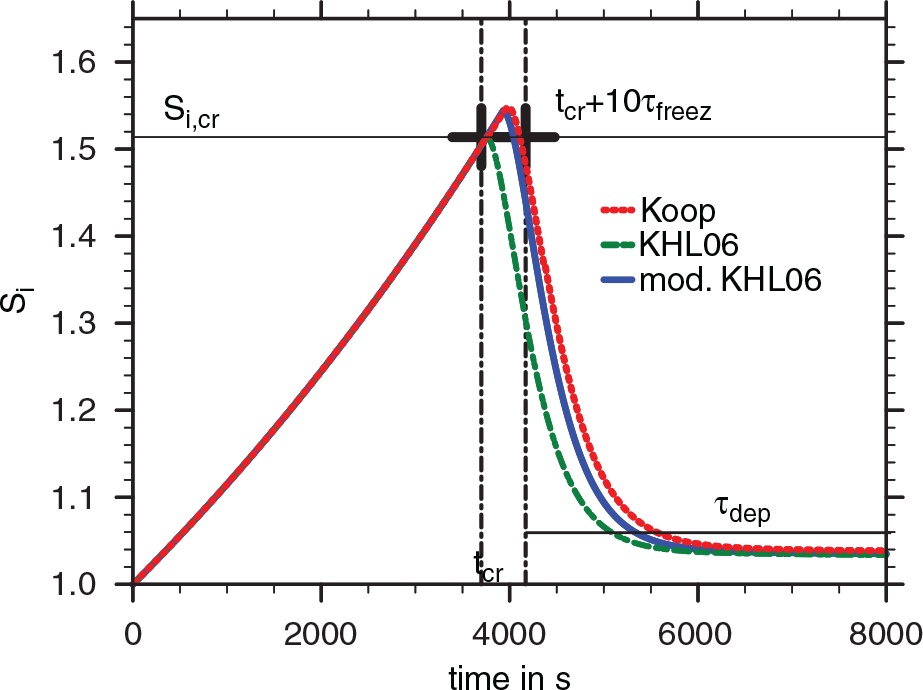
Fig. 2
The development of ice supersaturation over time of an adiabatically rising air parcel with the initial conditions T=220 K, p=220 hPa and a constant updraft w=10 cm s−1. The homogeneous nucleation scheme based on Koop et al. (2000) is compared to the KHL06 scheme and the KHL06 with a modified trigger mechanism. The nucleation event begins as soon as the critical ice supersaturation ratio S i,cr is reached at time t cr. The duration of the nucleation event is denoted by t cr+10 τfreez and the depositional time scales is τdep.
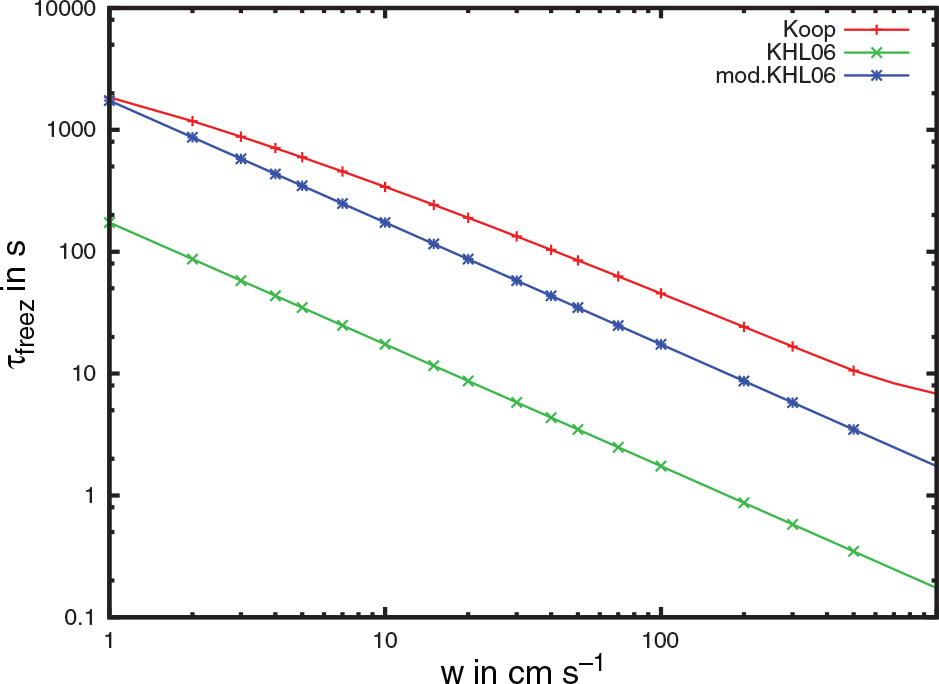
Fig. 3
The duration of the nucleation event τfreez for an air parcel with T=220 K and different vertical velocities depicted for the Koop, KHL06 and modified KHL06 scheme with the red, green and blue lines, respectively.
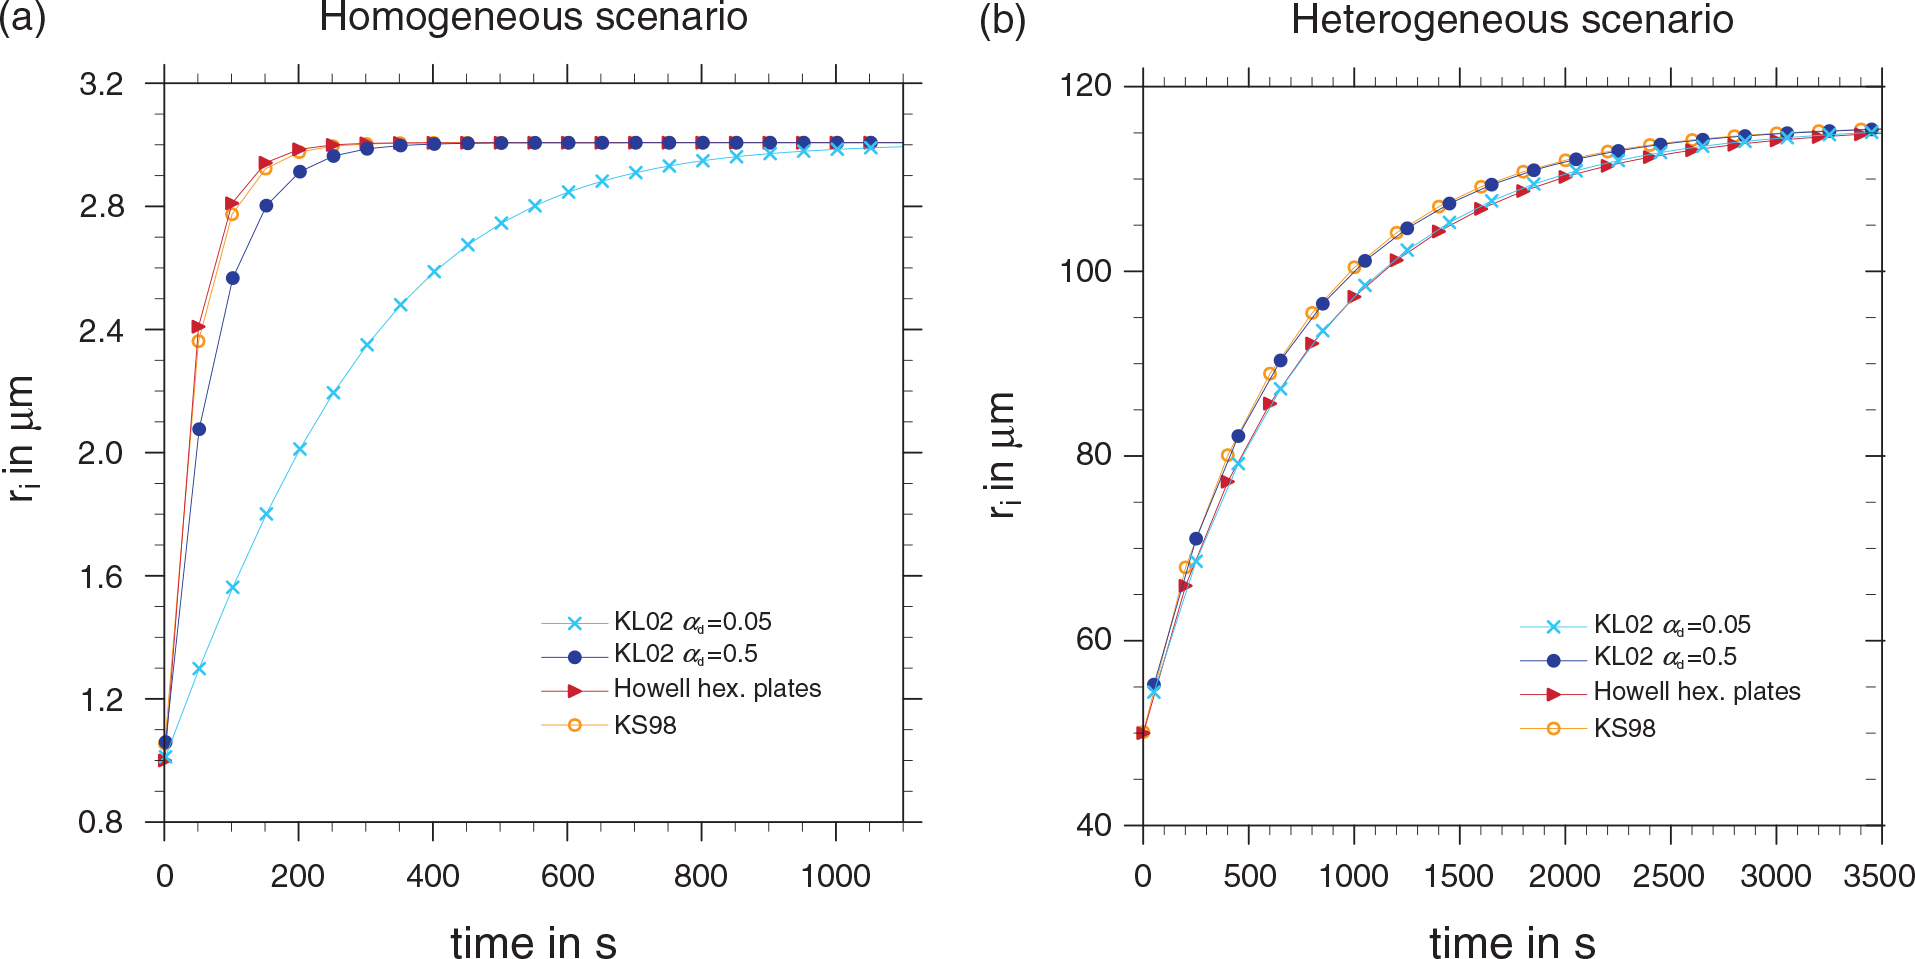
Fig. 4
The change in ice crystal radii over time for the (a) homogeneous and (b) heterogeneous scenario for the kinetic and thermodynamic depositional growth rates is depicted. For the homogeneous scenario, the initial ice crystal radius is r i,0=1µm, the ice crystal number density is set to n i=10 cm−3, and the temperature is T=200 K. In the heterogeneous nucleation scenario, the initial ice crystal radius is r i,0=50µm, the constant ice crystal number density is n i=10 dm−3, and the temperature is set to T=240 K. The pressure is p=240 hPa for both scenarios. The dark and light blue lines show the influence of the deposition coefficient on the kinetic depositional growth rate. The ice crystal radii resulting from thermodynamic depositional growth rate considering spherical ice particles and hexagonal plates are shown in orange and red, respectively.
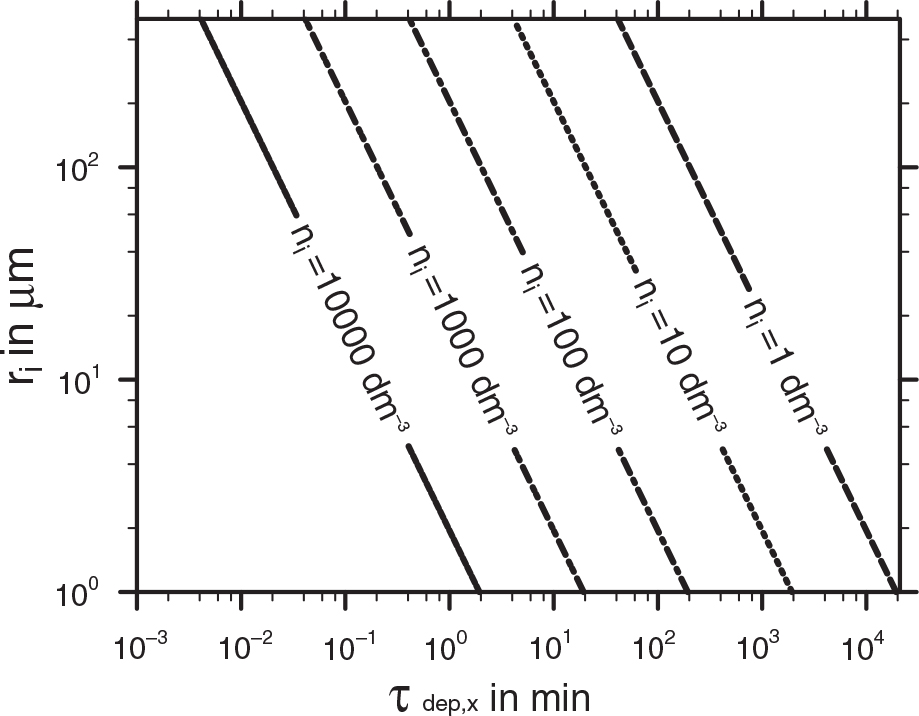
Fig. 5
The dependency of the depositional freezing time scale τdep,het from eq. (19) on the mean ice crystal radius and number density for T=240 K is shown.
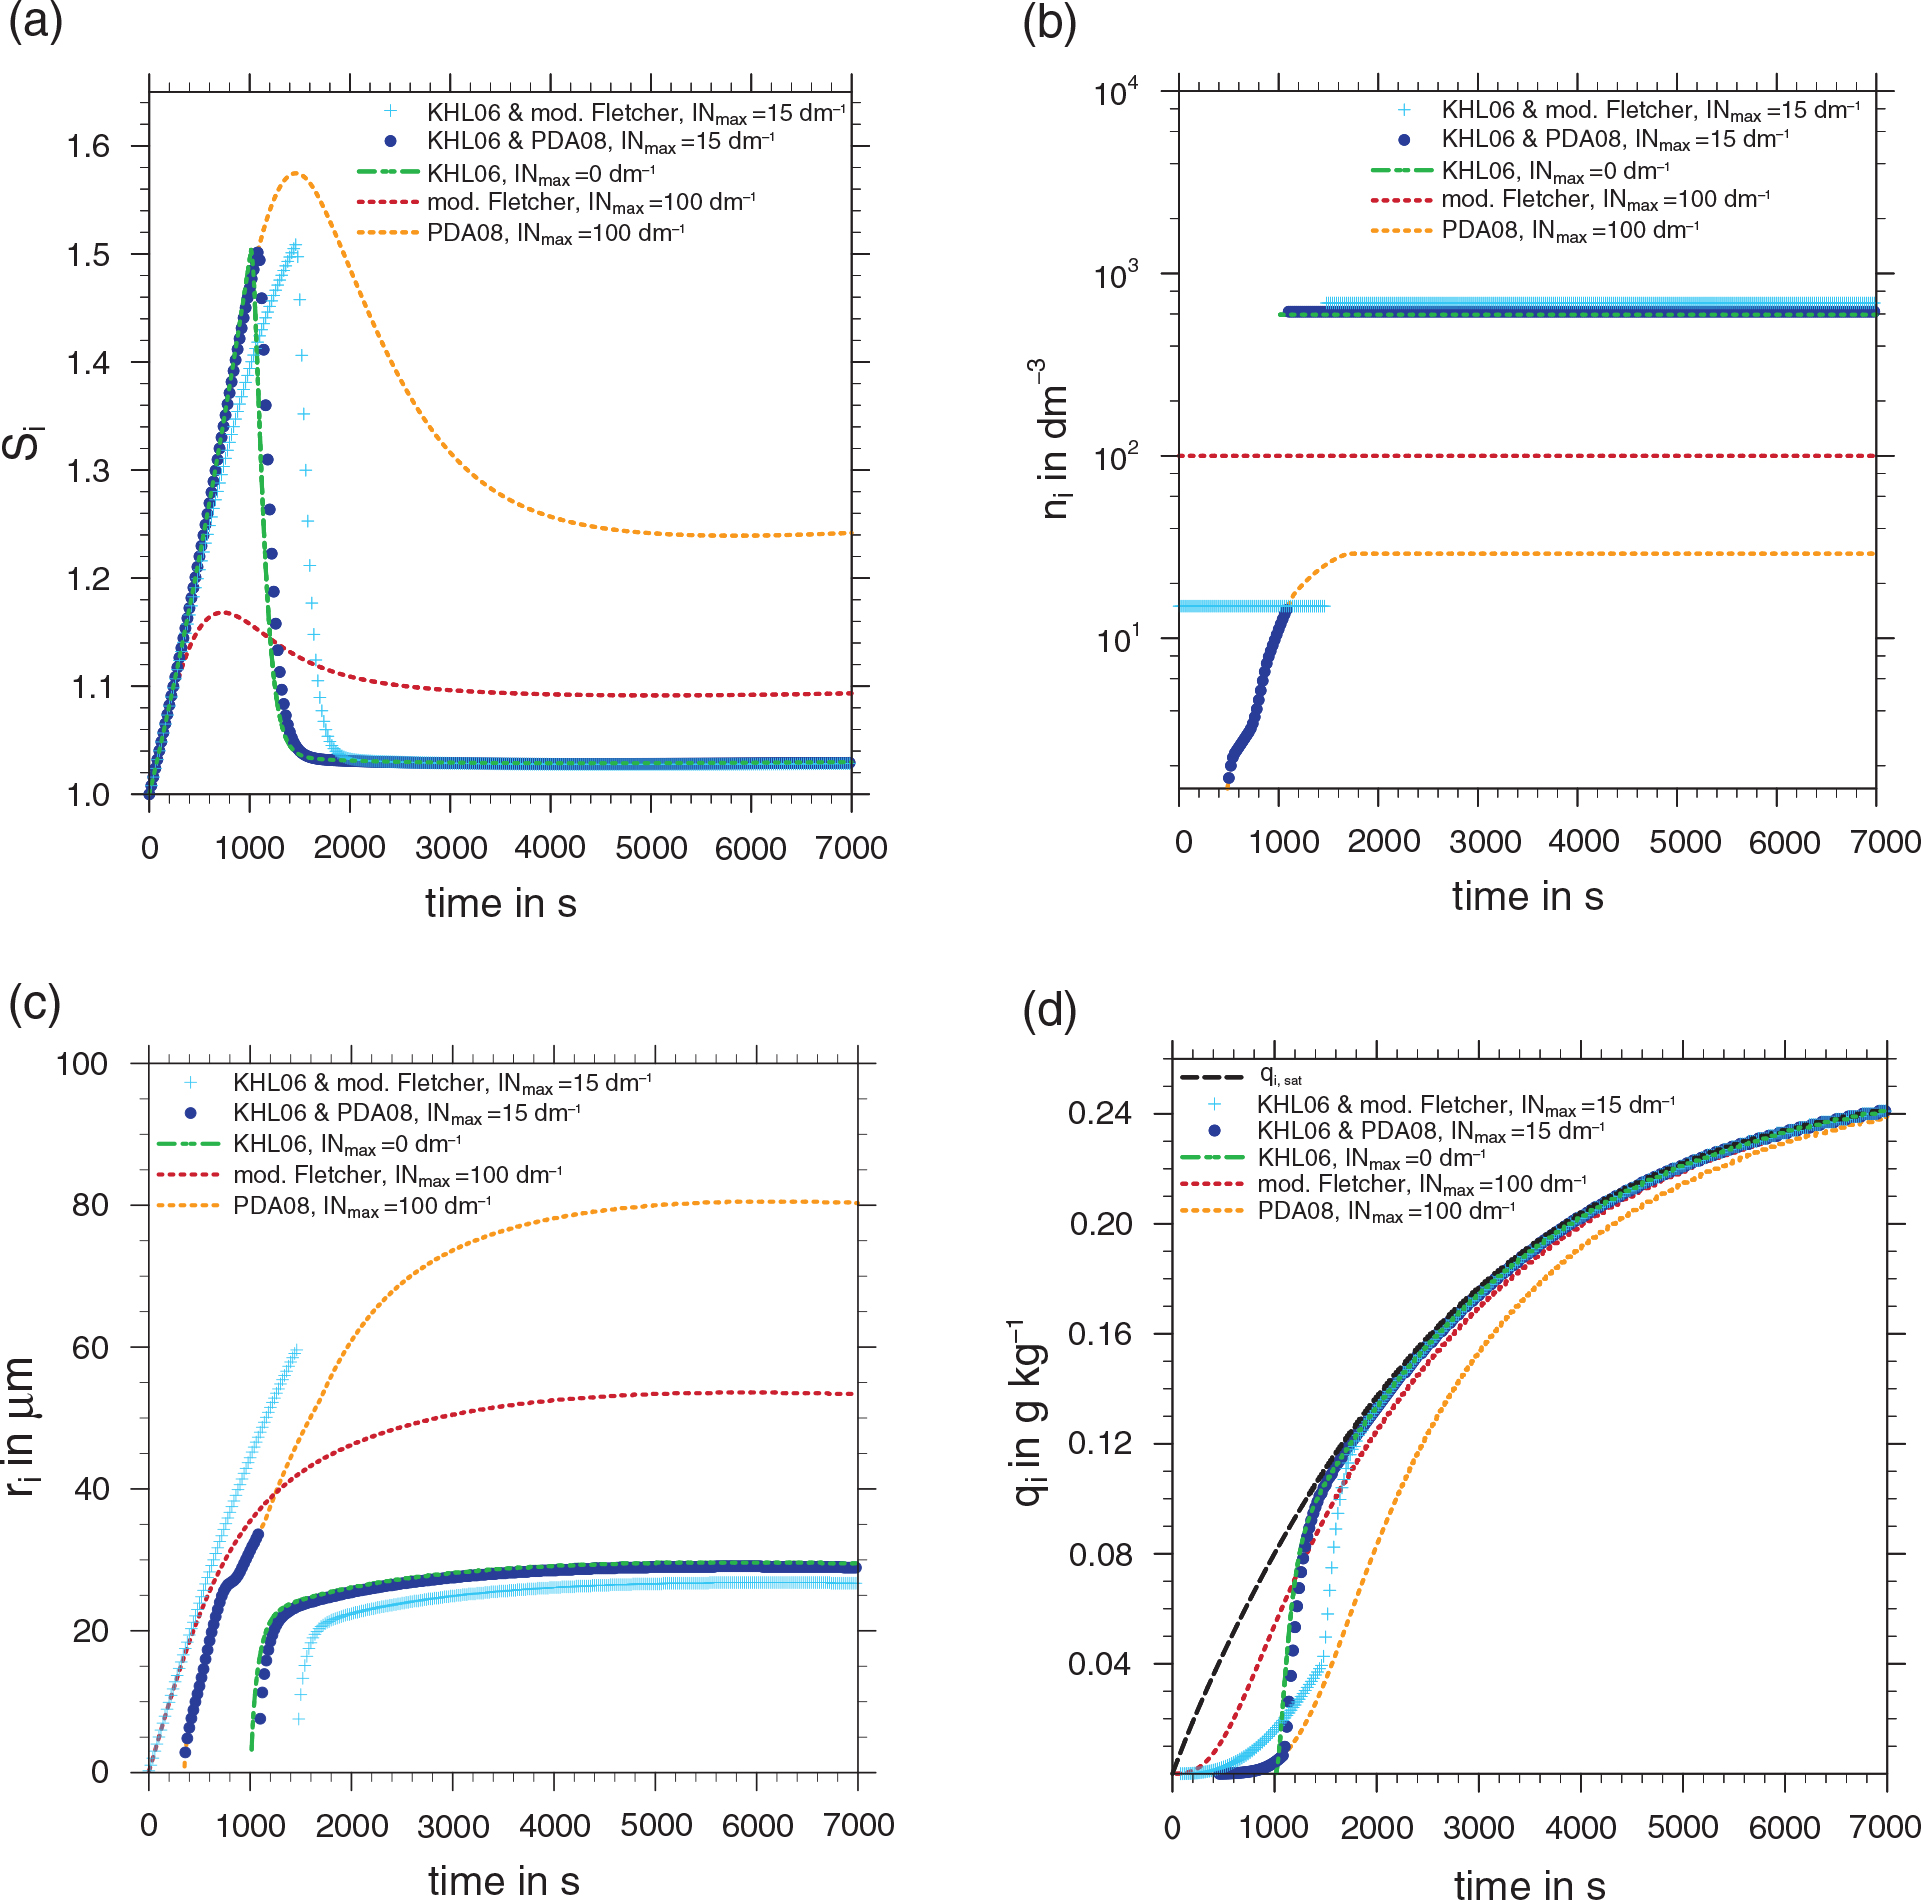
Fig. 6
Parcel model simulations with the initial values for the temperature T=230 K, the pressure p=220 hPa and the vertical velocity w=40 cm s−1, which reveal the characteristics of homogeneous and heterogeneous nucleation, as well as their interaction. The KHL06 homogeneous nucleation scheme is used, combined once with the heterogeneous schemes applying the modified Fletcher equation and once with PDA08. Different confining maximum values for n i,het and n i,hom lead to the competition between the two processes (light and dark blue symbols), purely homogeneous freezing (green line) and solely heterogeneous nucleation (orange and red lines for PDA08 and the modified Fletcher equation, respectively). In (a) the ice supersaturation ratio, (b) the ice crystal number density, (c) the ice crystal radius and (d) the cloud ice mixing ratio for the two modes are shown. In (d) the cloud ice mixing ratio for saturation is depicted by the dashed black line.
Table 1. Cloud ice sources and sink terms used in the COSMO model
SfrzNucleation of cloud ice due to hom. freezing of cloud waterSdepDeposition growth and sublimation of cloud iceSmeltMelting of cloud ice to form cloud waterSauAutoconvers of cloud ice to form snow due to aggregationSaudAutoconvers of cloud ice to form snow due to depositionSaggCollection of cloud ice by snow (aggregation)ScriCollection of ice by rain to form snow
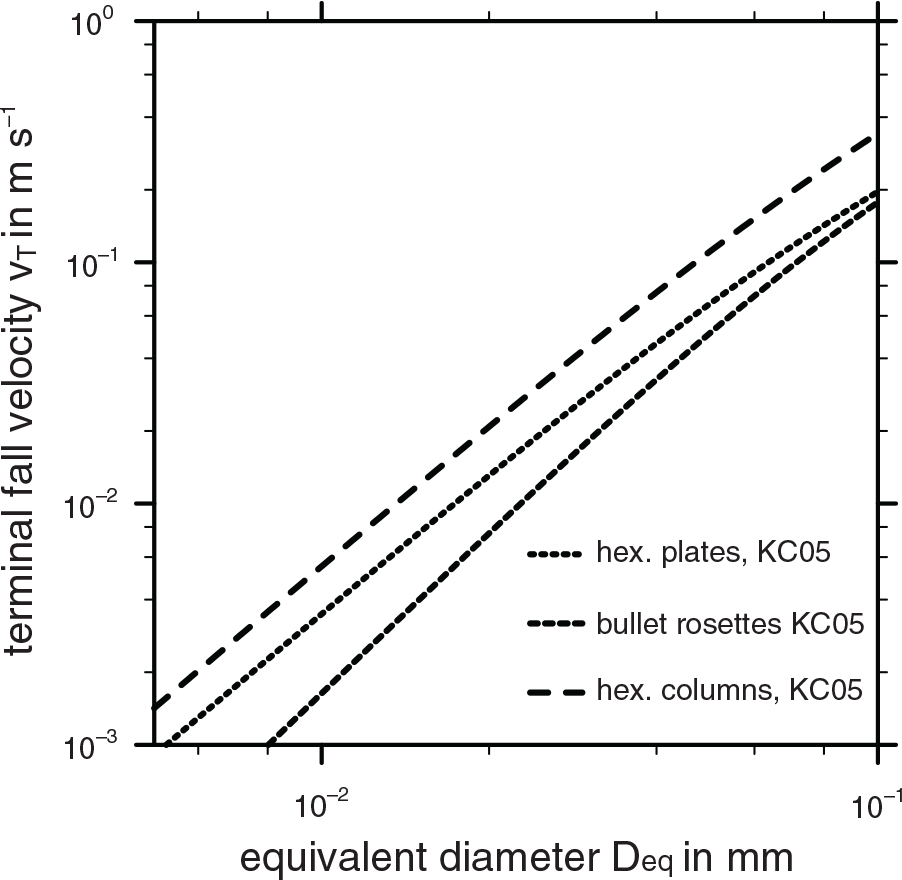
Fig. 7
The plot depicts the terminal velocities for different ice crystal shapes based on Khvorostyanov and Curry (2005) with the reference air density ρa=1.225 kg m−3.
Table 2. Overview of the new and operational cloud ice nucleation scheme
Prognostic variablesqiqi,hom, qi,het, Ni,hom, Ni,het, Ni,nucHomogeneous nucleation–Kärcher et al. (2006)Heterogeneous nucleationModified Fletcher (1962)Phillips et al. (2008)Vertical velocityw=wCOSMOw=wCOSMO+wTKEDepositional growthHowell (1949) with Euler forward and limiterMorrison et al. (2005a)Cloud ice sedimentation–Khvorostyanov and Curry (2005)
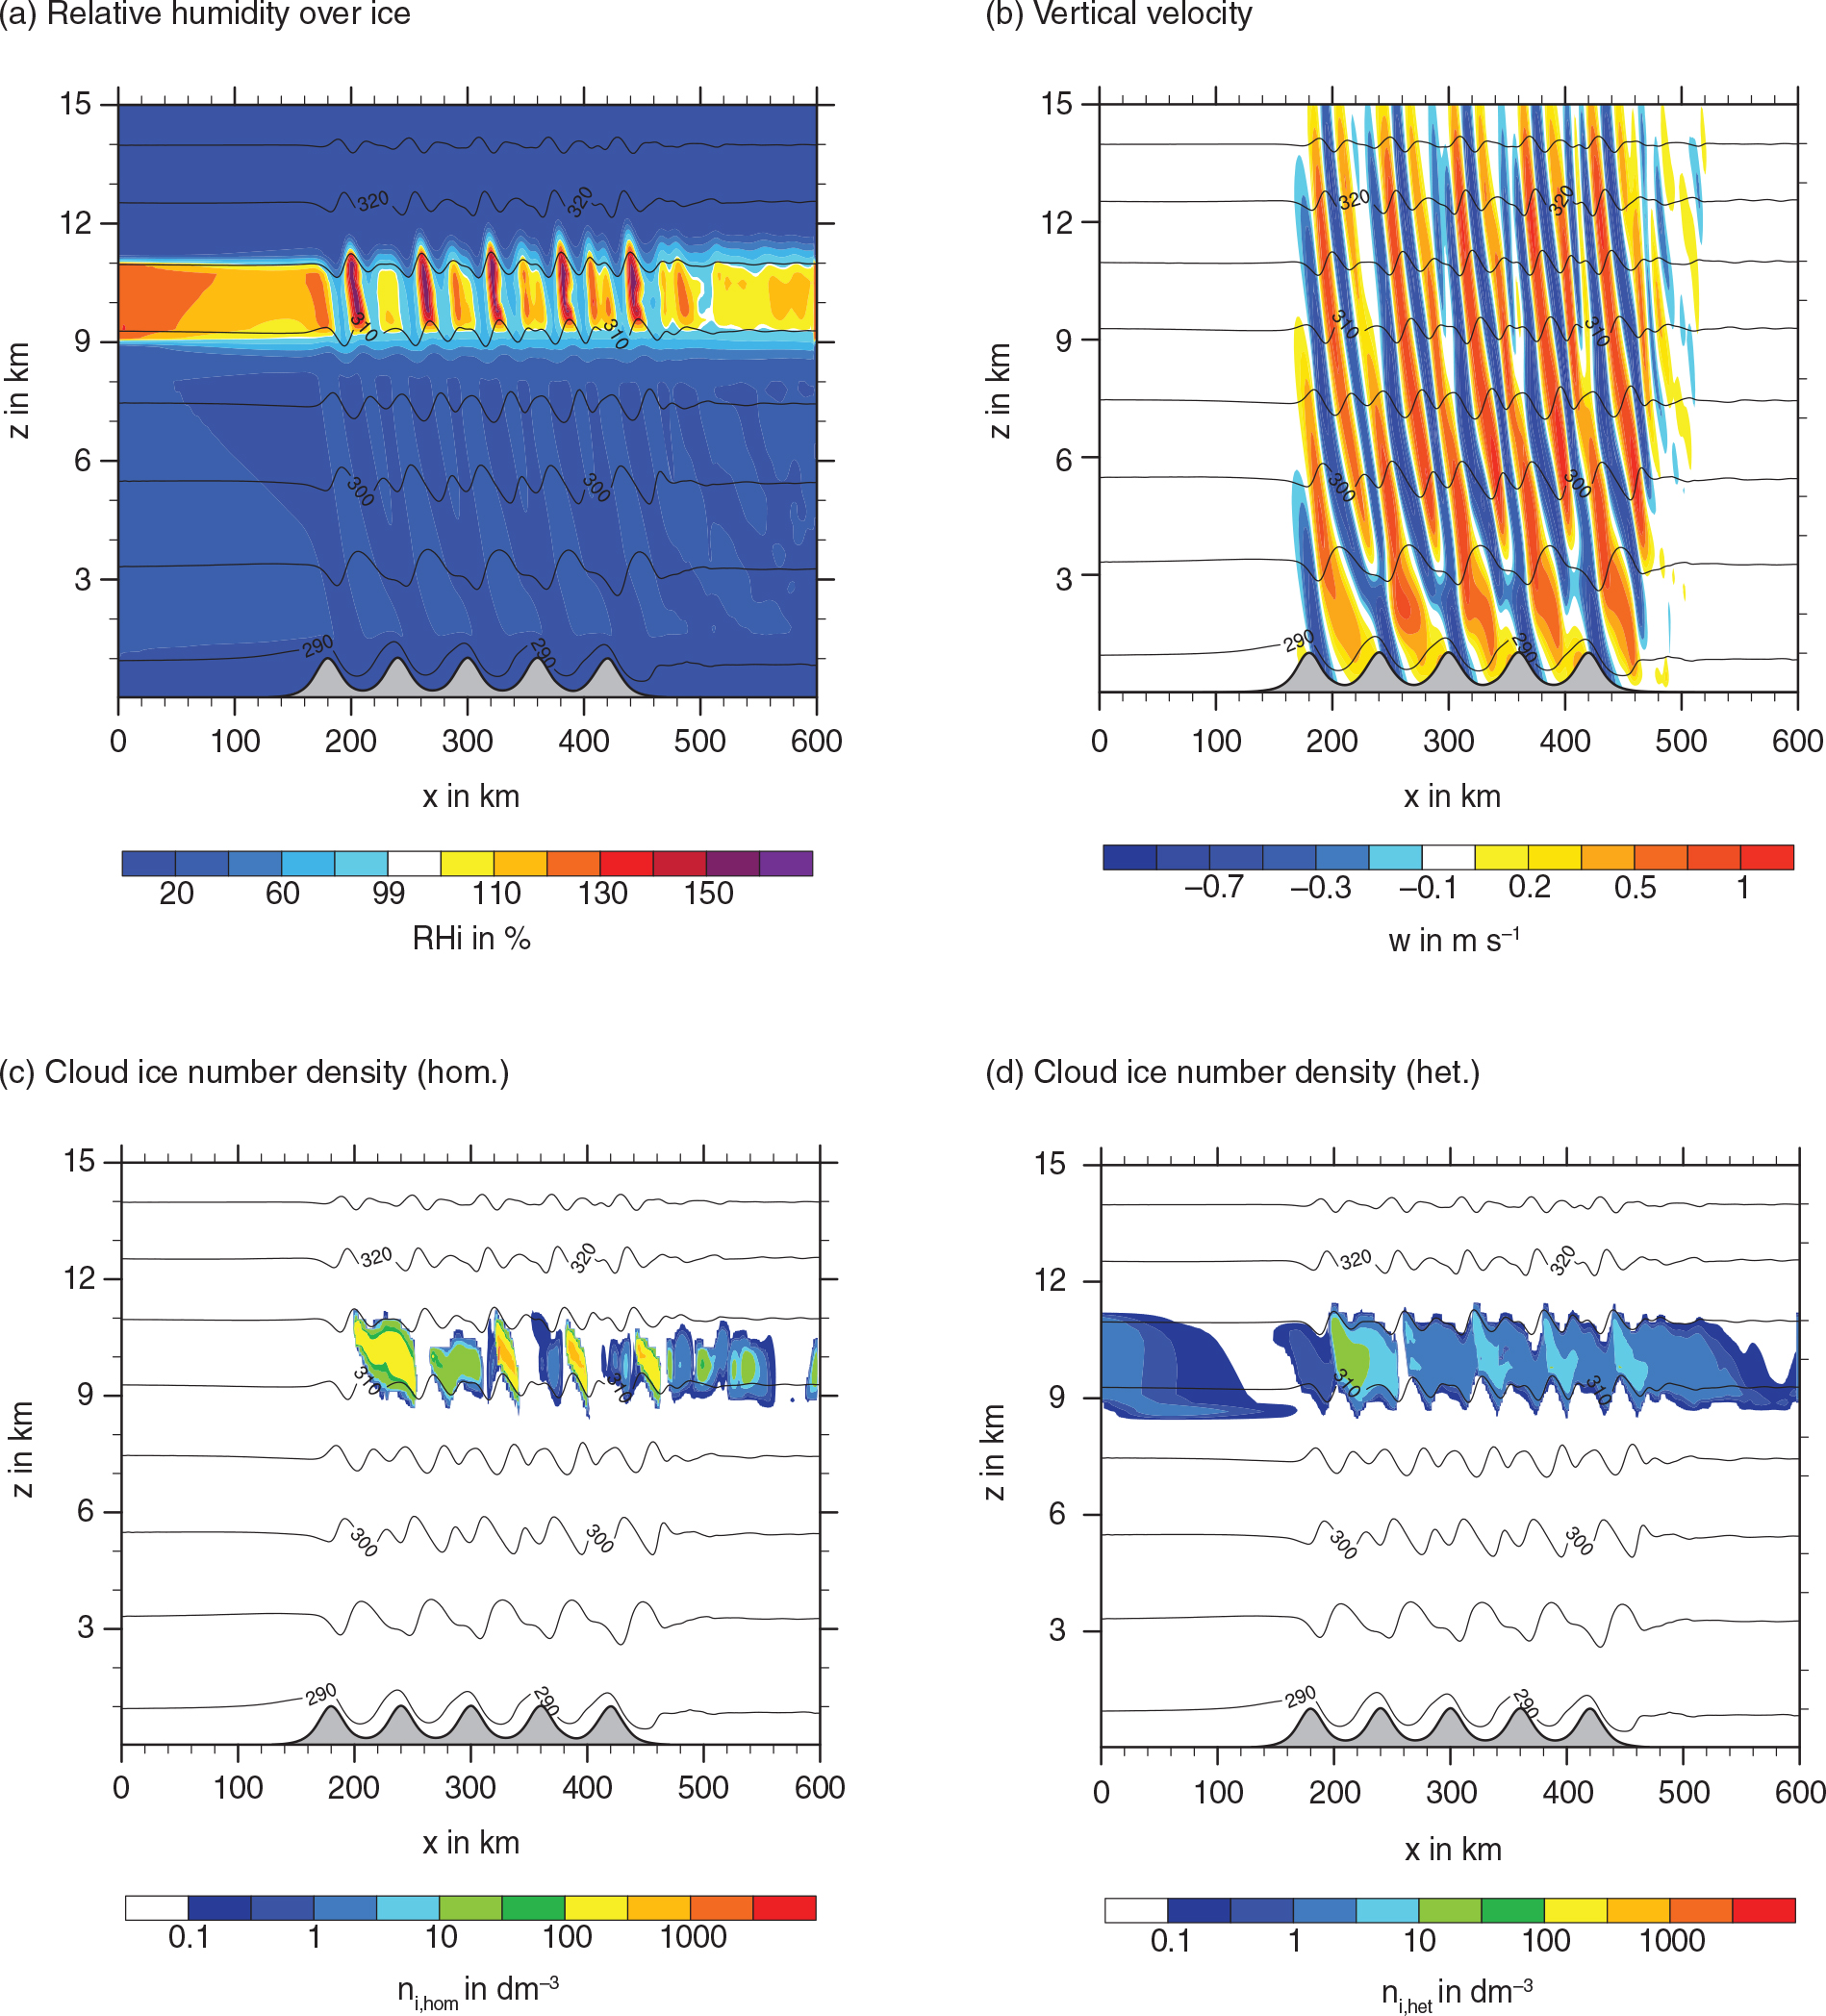
Fig. 8
A 2 km broad layer between 9 and 11 km is initialised with RH i=130% where the relative humidity with respect to ice is shown in (a) after the simulation time of 8 hours. The initial conditions for this idealised simulation are RH i=130%, h max=1 km, u 0=12 m s−1 and χIN=3, causing both nucleation regimes to be triggered. High vertical velocities in gravity waves are achieved through strong orographic forcing, with the vertical velocity depicted in (b). The cloud ice number density for homogeneous and heterogeneous nucleation are shown in (c) and (d), respectively.
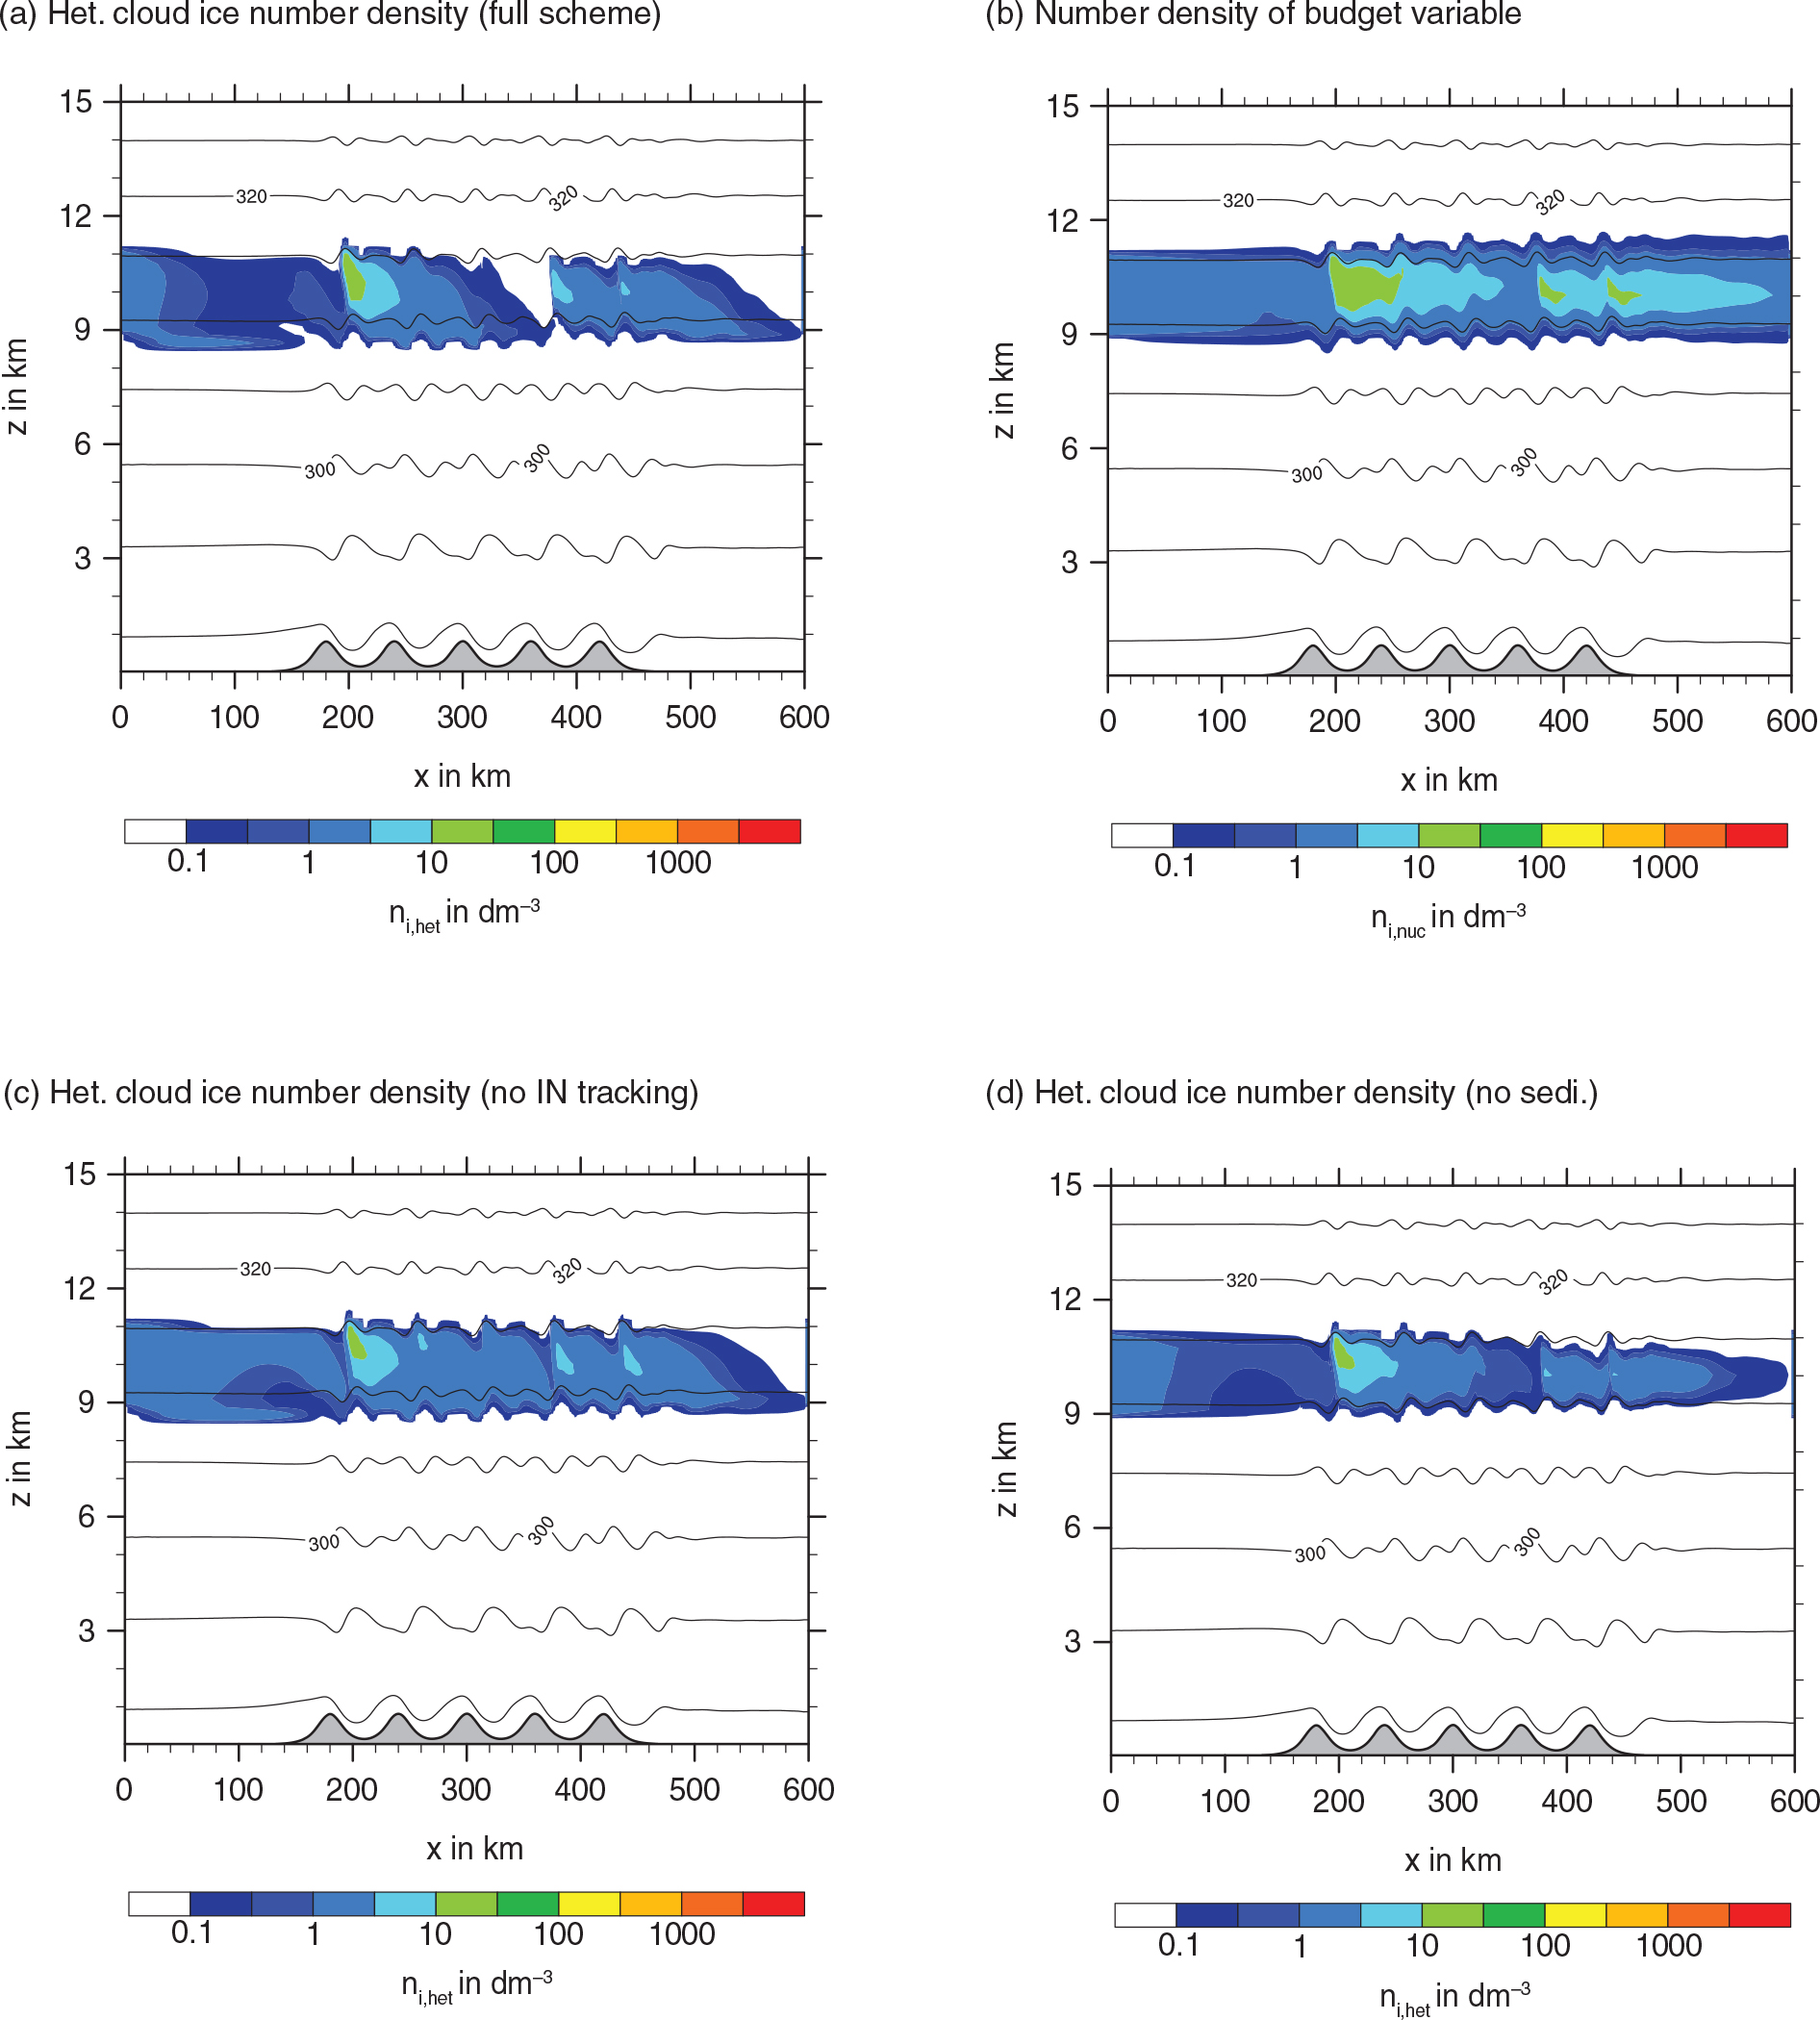
Fig. 9
Idealised simulations of cirrus cloud developed by heterogeneous freezing after 12 hours. The ideal setup consists of the mountain height h max=0.8 km, the horizontal velocity u 0=12 m s−1, the ice supersaturated layer with RH i=130% and the factor χIN=3 for the aerosol distribution. The heterogeneously formed cloud ice with cloud ice sedimentation and the limitation of the activated ice nuclei (IN) tracking is shown in (a). The number density for activated IN n i,nuc is shown in (b). Simulations without IN tracking and without sedimentation are depicted in (c) and (d), respectively.
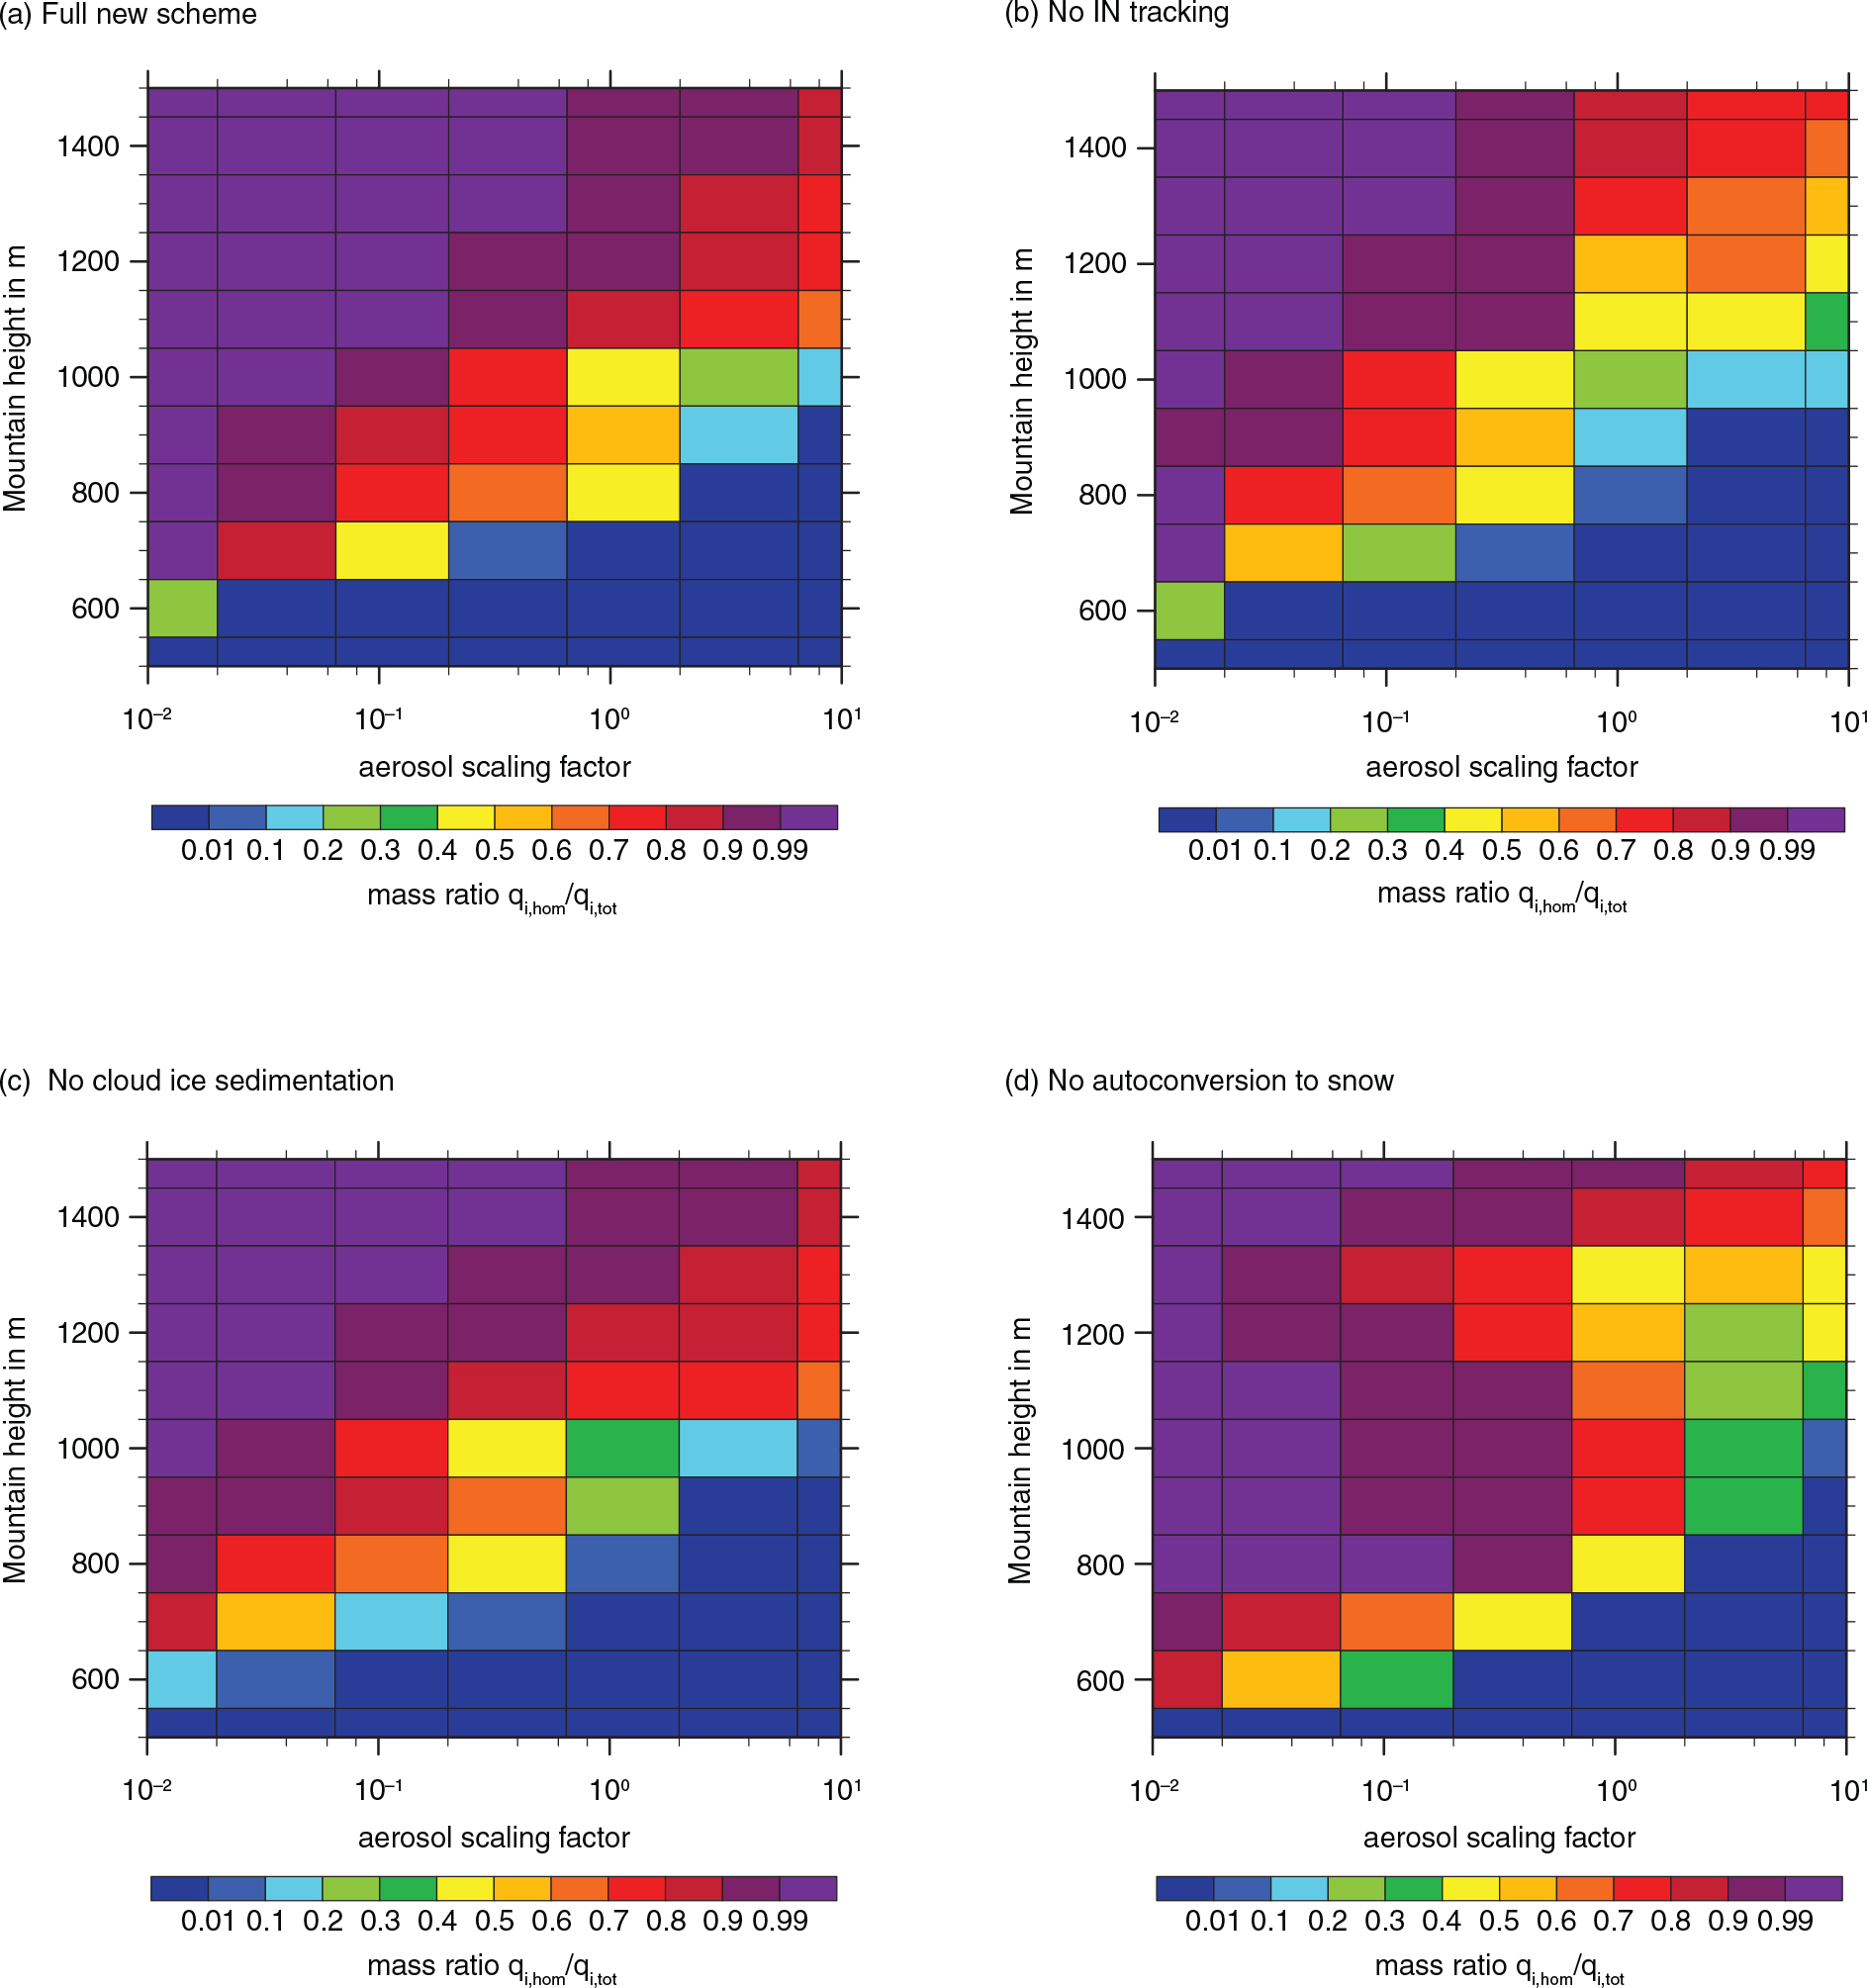
Fig. 10
Parameter space plot showing the dependency of homogeneous and heterogeneous freezing on orographic forcing and aerosol number concentration. (a) shows the results with sedimentation and IN tracking, (b) without the same without the latter. (c) is without ice cloud sedimentation and (d) only excludes the autoconversion of cloud ice to snow.