
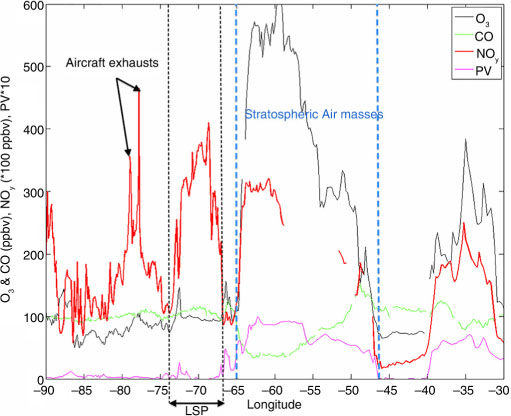
Fig. 1
Trace gas measurements along the flight track between Frankfurt and Houston and between 85°W and 40°W, on 13 June 2003. The data were averaged every 0.1°. NOy (ppbv×100, red line), CO (green), O3 (black) mixing ratios (ppbv), and PV (pvu×10, pink). Blue dashed lines delimit the stratospheric influence and the black dotted line point out an LSP.
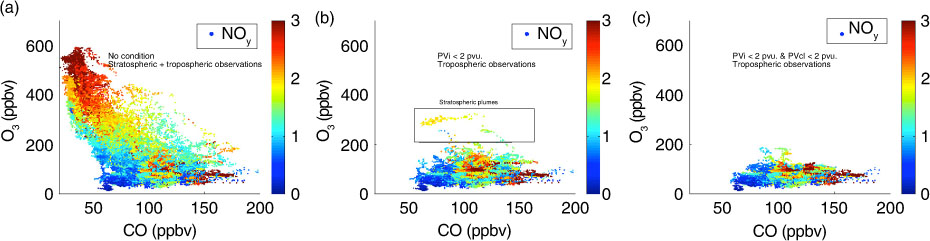
Fig. 2
Scatter plots of MOZAIC O3 vs. CO mixing ratios collared with simultaneous NOy mixing ratios during June–July–August 2003 in the UTLS over the American continent. Left: UTLS (Upper Troposphere Lower Stratosphere region, pressure <300 hPa); middle: tropospheric data with remaining stratospheric influence (instant potential vorticity, PVi <2 pvu.); right: tropospheric data (PV <2 pvu. during the 72 hours before observations).
{ label needed for table-wrap[@id='UT0001'] }
Table 1. Statistics (median, mean and third quartile) of NOy for the upper tropospheric air masses observed in MOZAIC between 2001 and 2005 for three different regions (North America: 30°N-60°N/120°W-60°W, Atlantic: 0°N-60°N/60°W-25°W, and Europe: 35°N-70°N/25°W-40°E)
DJF (490)Median0.240.250.23Mean0.290.280.25Third quartile0.380.350.31MAM (407)Median0.750.650.56Mean0.950.800.61Third quartile1.201.050.78JJA (467)Median1.220.800.88Mean1.280.890.98Third quartile1.601.131.25SON (321)Median0.510.430.42Mean0.560.470.45Third quartile0.700.610.56
{ label needed for table-wrap[@id='UT0002'] }
Table 2. Statistics (median, mean and third quartile) of CO for the upper tropospheric air masses observed in MOZAIC between 2001 and 2005 for three different regions (North America: 30°N-60°N/120°W-60°W, Atlantic: 0°N-60°N/60°W-25°W, and Europe: 35°N-70°N/25°W-40°E)
DJFMedian989499Mean10098102Third quartile111108112MAMMedian115109115Mean116109115Third quartile125117125JJAMedian959093Mean969194Third quartile105102103SONMedian868487Mean878688Third quartile949394
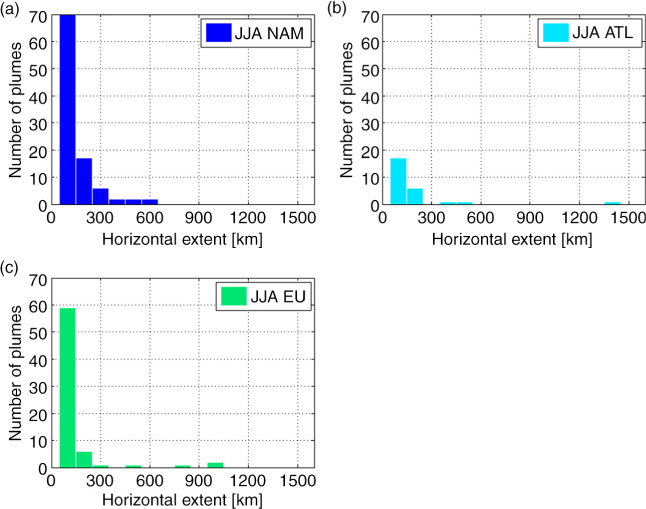
Fig. 3
Frequency distributions of the horizontal extent of the NOy lightning-related plumes (see Sections 3.2 and 3.3) observed in JJA over the regions NAM, ATL, and EU.
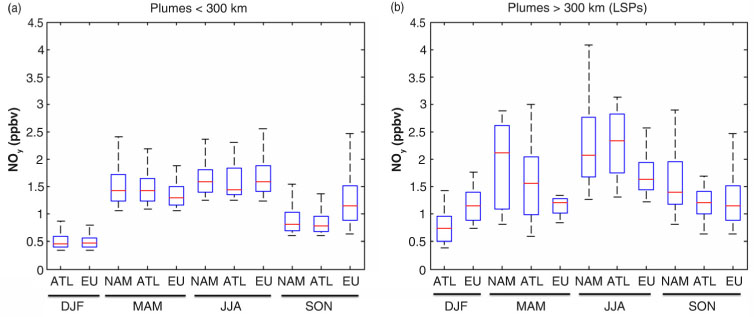
Fig. 4
Seasonal variations (DJF, MAM, JJA and SON) of the frequency distribution (box and whisker plots) of NOy for plumes with a horizontal extent <300 km (left) and within the LSPs of >300 km (right) for the three different regions (NAM, ATL and EU). Boxes: interquartile range (Q1 and Q3); red line: median; whiskers: 5th and 95th percentiles.
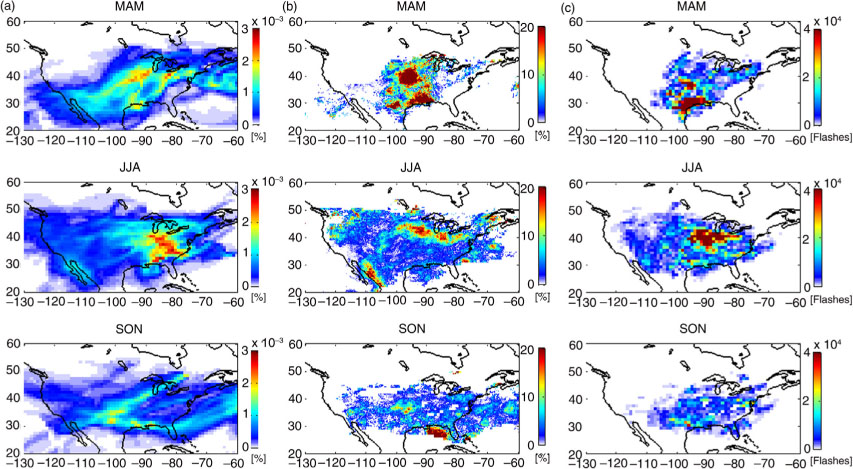
Fig. 5
Convective origin below 3 km and between 9 and 12 km of a 6 d integration of the transatlantic NOy LSPs as calculated with the FLEXPART model, with a horizontal resolution of 1°×1°, as the normalised residence time (normalised to (1) the cumulative residence time and (2) the fraction of flights recording transatlantic LSPs against total number of MOZAIC flights, for both over each season) in% (a), the occurrence of the IR brightness temperature <220 K in% observed by GOES (b) and the distribution of lightning flashes observed by NLDN (c). NLDN and GOES observations are sampled at the same time and location as the FLEXPART model. Parameters are represented over seasons (top: MAM, middle: JJA, bottom: SON).
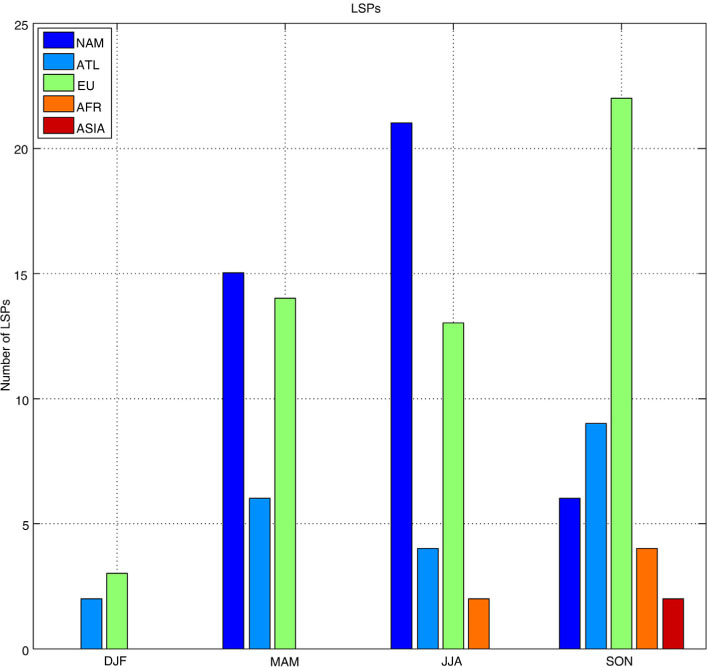
Fig. 6
Number of NOy LSPs identified for the different seasons (DJF, MAM, JJA, SON) over the regions NAM, ATL, EU, AFR and ASIA using the criteria described in Sections 3.2 and 3.3.
Table 3. Seasonal distribution of the LSPs (top) and origin of the convection (bottom)
Number of observed LSPs5384143Origin Western Atlantic Basin2222516 Europe/Mediterranean Sea3161320 Africa35 Asia2Type of convection Continental0303124 Maritime581019
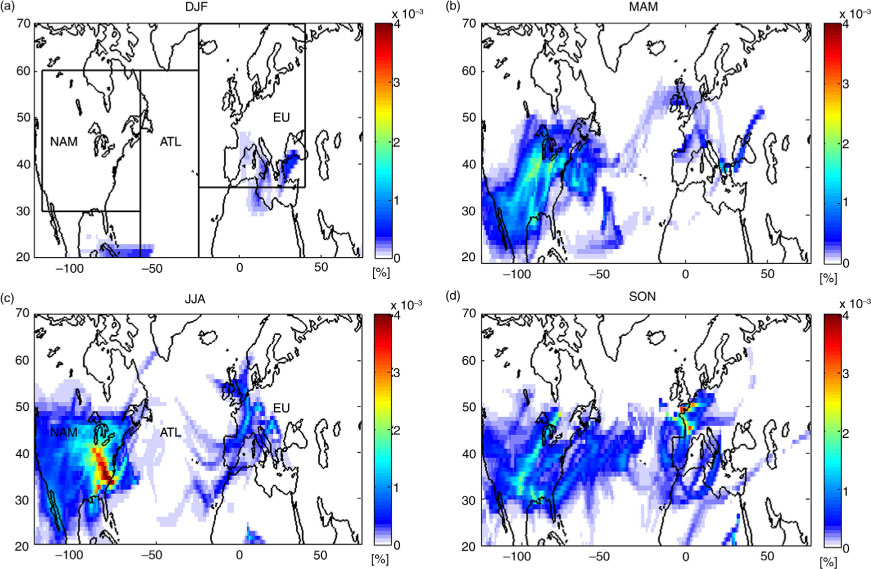
Fig. 7
Origin of the NOy LSPs as calculated with the FLEXPART model with a horizontal resolution of 1°×1°, for the four seasons over the North mid-latitudes (20°N–70°N). Colours represent the normalised residence time (normalised to (1) the cumulative residence time and (2) the fraction of flights recording LSPs against total number of MOZAIC flights, both over each season) of the particles initialised inside each LSP in the 0–3 km (LT) and 9–12 km (UT) layers during the 6 d backward simulation. The three black rectangles in the upper left panel define the study areas.
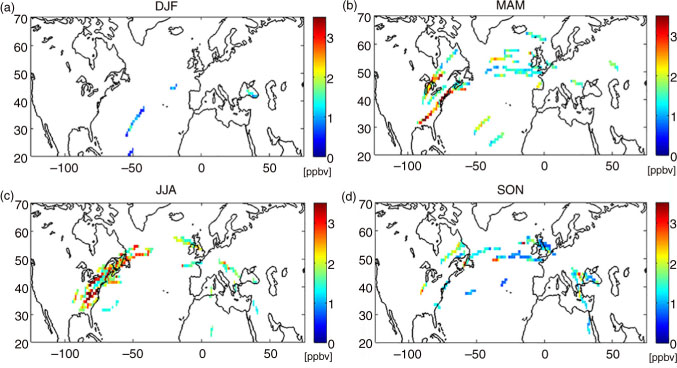
Fig. 8
Seasonally averaged NOy mixing ratios (ppbv) in the LSPs determined as described in Section 3. Values are averaged over 1°latitude×1°longitude and for each season over the North mid-latitudes.
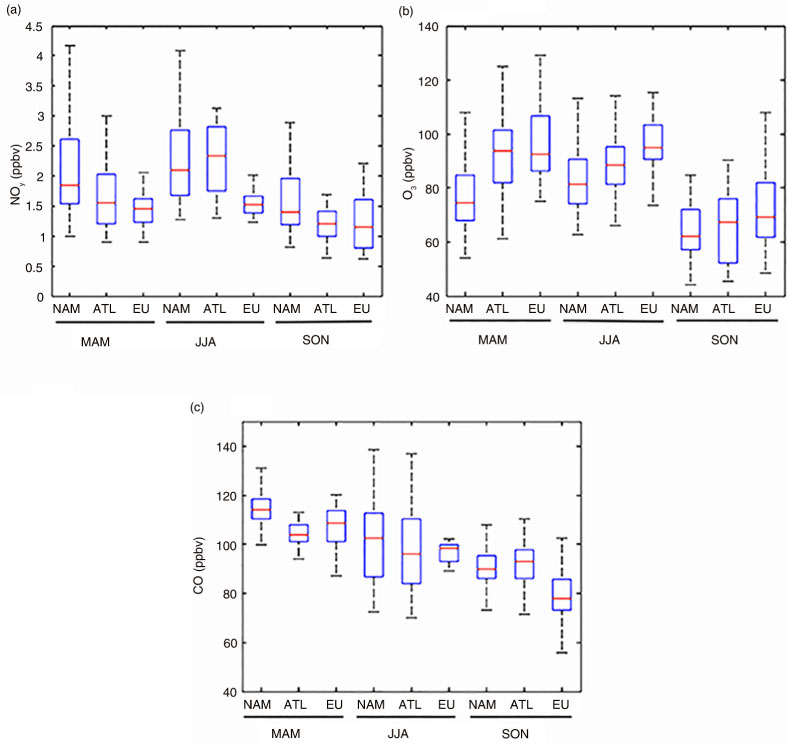
Fig. 9
Frequency distributions (box and whisker plots) of NOy, O3 and CO in the transatlantic LSPs for the three different regions (NAM, ATL, EU) during spring (MAM), summer (JJA) and autumn (SON). Boxes: interquartile range (Q1 and Q3); red line: median; whiskers: 5th and 95th percentiles.