Have a personal or library account? Click to login
Impacts of land use and land cover changes on biogenic emissions of volatile organic compounds in China from the late 1980s to the mid-2000s: implications for tropospheric ozone and secondary organic aerosol Cover

Impacts of land use and land cover changes on biogenic emissions of volatile organic compounds in China from the late 1980s to the mid-2000s: implications for tropospheric ozone and secondary organic aerosol

By:  and    
Open Access
|Jan 2014

Figures & Tables

Fig. 1

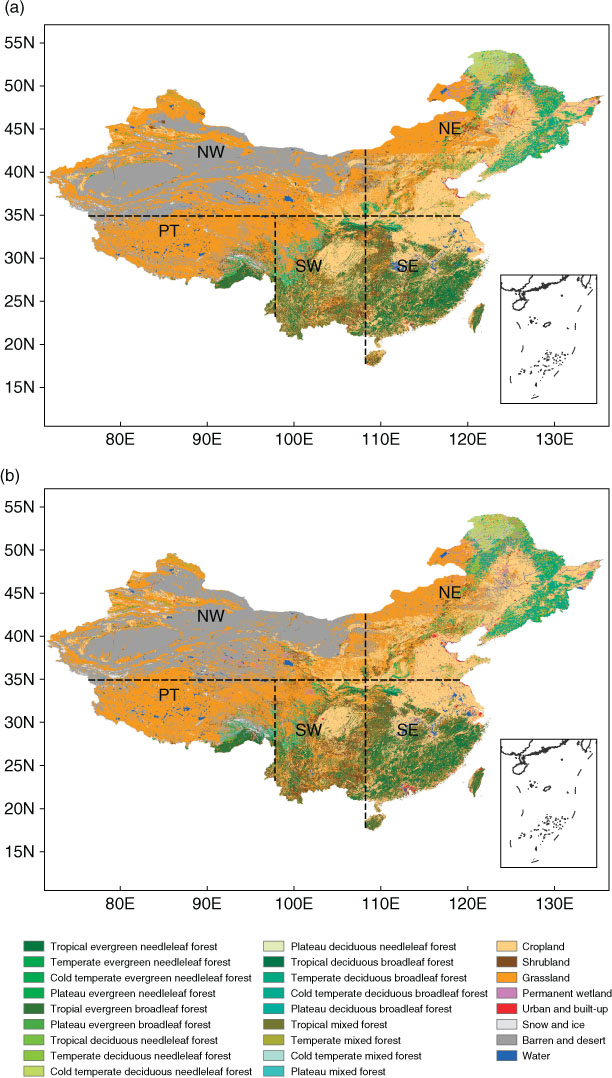
Distributions of land cover and land use types in China in (a) the late 1980s and (b) the mid-2000s. The regions of China examined in this study are also shown, including northeastern (NE, 35.00°–53.00°N, 108.75°–136.25°E), southeastern (SE, 17.00°–35.00°N, 108.75°–123.75°E), northwestern (NW, 35.00°–49.00°N, 73.75°–108.75°E), southwestern (SW, 21.00°–35.00°N, 96.25°–108.75°E), and plateau (PT, 27.00°–35.00°N, 76.25°–96.25°E) regions.

Table 1. Isoprene and monoterpene emission factors and specific leaf weight (SLW) used in this study

Emission factors (Efi, µg C gdm−1 h−1)Climatic zonesLand cover typesisoprenemonoterpenes SLWa (s)(gdm m−2)ReferencesbCold-temperate zoneCold-temperate Evergreen Needleleaf trees (CoTeEN)82.41501,2Cold-temperate Deciduous Needleleaf trees (CoTeDN)82.41501,2Cold-temperate Deciduous Broadleaf trees (CoTeDB)82.41501,2Cold-temperate Mixed forest (CoTeMixed)81.21251,2Temperate zoneTemperate Evergreen Needleleaf trees (TeEN)162.41501,2Temperate Deciduous Needleleaf trees (TeDN)162.41501,2Temperate Deciduous Broadleaf trees (TeDB)451.21001,2Temperate Mixed forest (TeMixed)240.81001,2Tropical zoneTropical Evergreen Needleleaf trees (TrEN)240.81251,2Tropical Deciduous Needleleaf trees (TrDN)240.81251,2Tropical Deciduous Broadleaf trees (TrDB)240.81253Tropical Evergreen Broadleaf trees (TrEB)240.81253Tropical Mixed forest (TrMixed)240.81251,2Plateau zonePlateau Evergreen Needleleaf trees (PlEN)162.41501,2Plateau Evergreen Broadleaf trees (PlEB)160.81251,2Plateau Deciduous Broadleaf trees (PlDB)450.81001,2Plateau Deciduous Needleleaf trees (PlDN)162.41501,2Plateau Mixed forest (PlMixed)240.81001,2Shrubland200.81251,2Grassland50.81252,4Cropland50.21251,2Permanent wetland80.41501Snow and ice000Urban and built-up000Barren and desert000Water000

[i] aSLW: leaf dry weight per unit leaf area (gdm m−2), which is the inverse of specific leaf area (SLA, m−2 gdm).

[ii] b1. Guenther et al. (1995); 2. Lathiere et al. (2006); 3. Levis et al. (2003); 4. Bai et al. (2006).

Table 2. Summary of the simulations in this study
Vegetation parametersSimulationsGEOS4 MeteorologyLand coverLeaf area indexAnthropogenic emissions(1) CTRL_1980s1986–1988Late 1980sAveraged over 2001–20062005(2) CTRL_2000s2004–2006Mid-2000sAveraged over 2001–20062005(3) SENS_LCLU1986–1988Mid-2000sAveraged over 2001–20062005(4) SENS_MET2004–2006Late 1980sAveraged over 2001–20062005(5) SENS_ANTH2004–2006Mid-2000sAveraged over 2001–20061985
Fig. 2

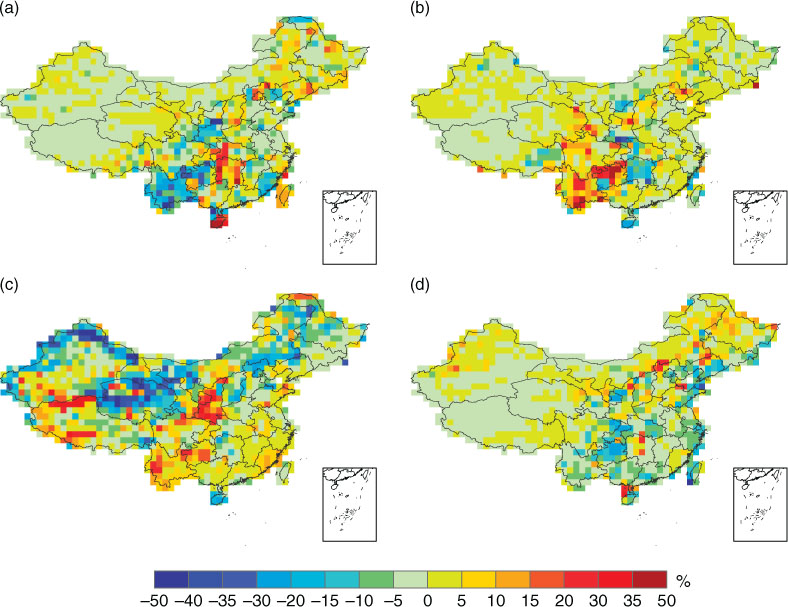
The changes in fractions of each 1°×1° grid cell covered by (a) forests, (b) shrubs, (c) grass, and (d) crops from the late 1980s to the mid-2000s.

Table 3. Simulated BVOC emissions in the late 1980s and the absolute and percentage changes in BVOCs from the late 1980s to the mid-2000s owing to changes in both land use and meteorological conditions (referred to as combined effect), changes in land cover and land use alone (referred to as LCLU effect), and changes in meteorological parameters alone (referred to as Met effect)

EmissionsSpecies1980sa (Tg C yr−1)Combined effectb (change,%)LCLU effectc (change,%)Met effectd (change,%)Total BVOCChina15.11+1.72 (+11.4%)−0.50 (−3.3%)+2.29 (+15.2%)SE7.21+0.87 (+12.1%)−0.033 (−0.5%)+0.89 (+12.4%)SW3.71+0.20 (+5.3%)−0.41 (−11.0%)+0.69 (+18.5%)NE3.21+0.63 (+19.6%)+0.0001 (+0.02%)+0.62 (+19.4%)NW0.65−0.015 (−2.4%)−0.060 (−9.2%)+0.050 (+7.7%)PT0.35+0.038 (+11.1%)+0.0006 (+0.2%)+0.039 (+11.2%)IsopreneChina11.32+1.48 (+13.1%)−0.39 (−3.5%)+1.93 (+17.0%)SE5.67+0.74 (+13.1%)−0.030 (−0.5%)+0.76 (+13.4%)SW2.75+0.18 (+6.4%)−0.34 (−12.5%)+0.59 (+21.5%)NE2.29+0.53 (+23.0%)+0.015 (+0.6%)+0.51 (+22.1%)NW0.42+0.001 (+0.32%)−0.031 (−7.5%)+0.038 (+9.1%)PT0.20+0.032 (+16.3%)+0.0004 (+0.2%)+0.033 (+16.5%)MonoterpenesChina2.66+0.12 (+4.6%)−0.083 (−3.1%)+0.21 (+7.9%)SE1.00+0.074 (+7.4%)−0.0008 (−0.1%)+0.074 (+7.4%)SW0.69+0.004 (+0.5%)−0.043 (−6.2%)+0.049 (+7.1%)NE0.68+0.060 (+8.7%)−0.015 (−2.1%)+0.076 (+11.1%)NW0.17−0.019 (−10.8%)−0.026 (−14.9%)+0.009 (+5.0%)PT0.12+0.003 (+2.8%)+0.0002 (+0.2%)+0.003 (+2.8%)Other VOCsChina1.13+0.12 (+10.8%)−0.025 (−2.3%)+0.15 (+13.3%)SE0.55+0.057 (+10.5%)−0.0018 (−0.3%)+0.059 (+10.7%)SW0.27+0.018 (+6.6%)−0.022 (−8.1%)+0.045 (+16.9%)NE0.23+0.042 (+18.1%)+0.0004 (+0.2%)+0.042 (+17.8%)NW0.05+0.002 (+3.2%)−0.0023 (−4.3%)+0.003 (+5.1%)PT0.03+0.002 (+8.3%)+0.00002 (+0.1%)+0.003 (+8.4%)

[i] The absolute changes are in unit of Tg C yr−1. See Fig. 1 for definitions of regions of SE, SW, NE, NW, and PT in China.
[ii] aBiogenic emission simulated in CTRL_1980s.

[iii] bDifferences between simulations CTRL_2000s and CTRL_1980s (CTRL_2000s minus CTRL_1980s).

[iv] cDifferences between simulation SENS_LCLU and CTRL_1980s (SENS_LCLU minus CTRL_1980s).

[v] dDifferences between simulation SENS_MET and CTRL_1980s (SENS_MET minus CTRL_1980s).

Fig. 3

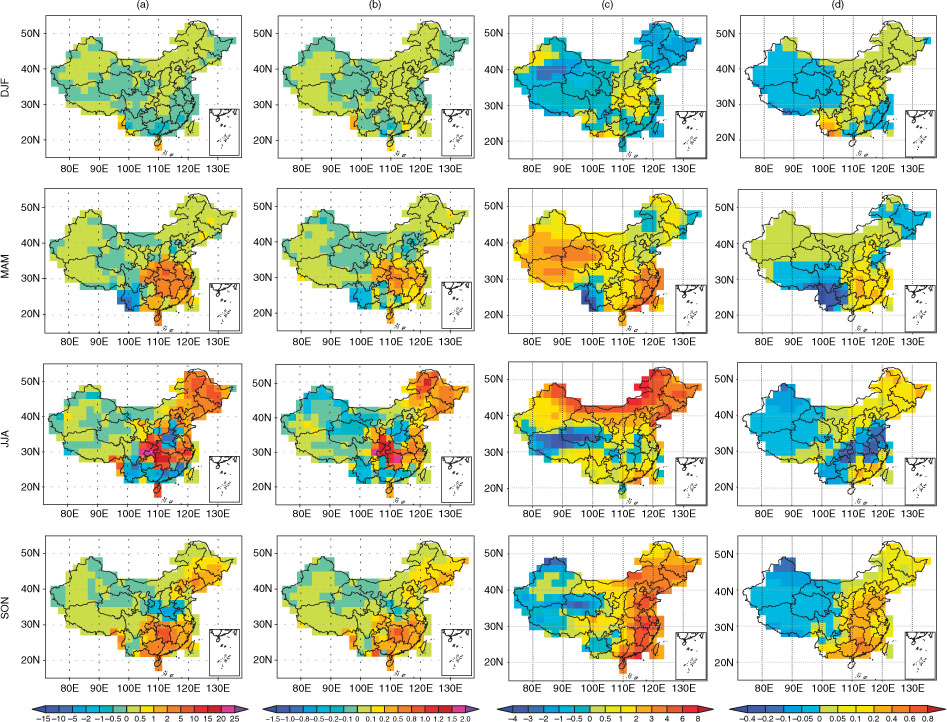
Simulated seasonal mean changes from the late 1980s to the mid-2000s as a result of changes in both land cover and meteorological parameters (CTRL_2000s minus CTRL_1980s): (a) isoprene emissions (unit: 106 kg C month−1), (b) monoterpene emissions (unit: 106 kg C month−1), (c) surface-layer O3 (unit: ppbv), and (d) SOA concentrations (unit: µg m−3).
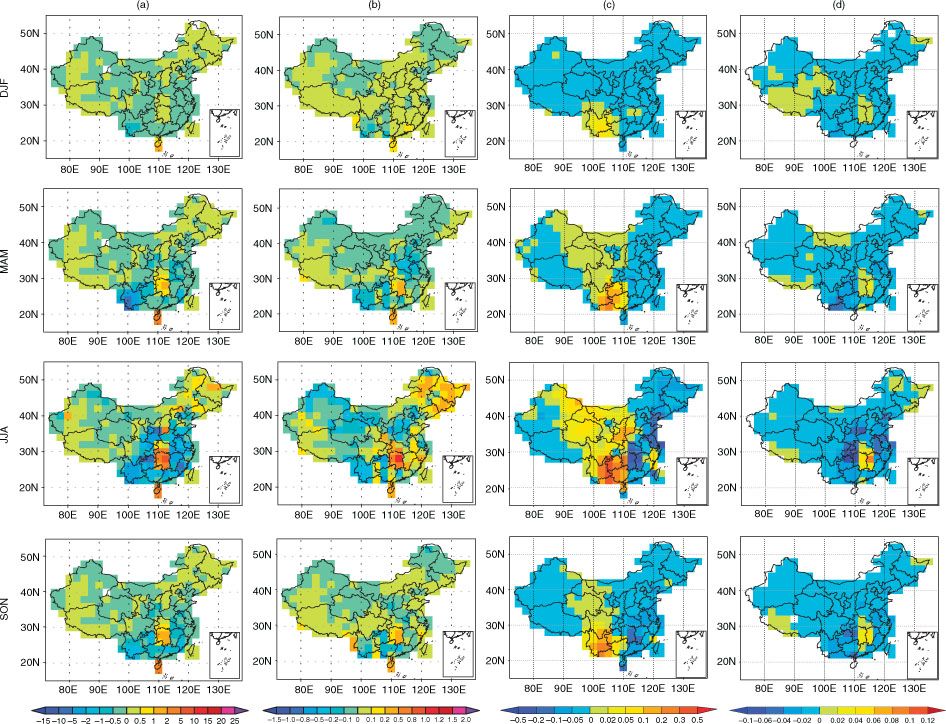
Fig. 4

Simulated seasonal mean changes from the late 1980s to the mid-2000s as a result of the changes in land cover alone (SENS_LCLU minus CTRL_1980s): (a) isoprene emissions (unit: 106 kg C month−1), (b) monoterpene emissions (unit: 106 kg C month−1), (c) surface-layer O3 (unit: ppbv), and (d) SOA concentrations (unit: µg m−3). Note that the magnitudes of changes in O3 and SOA are different from those in Fig. 3.
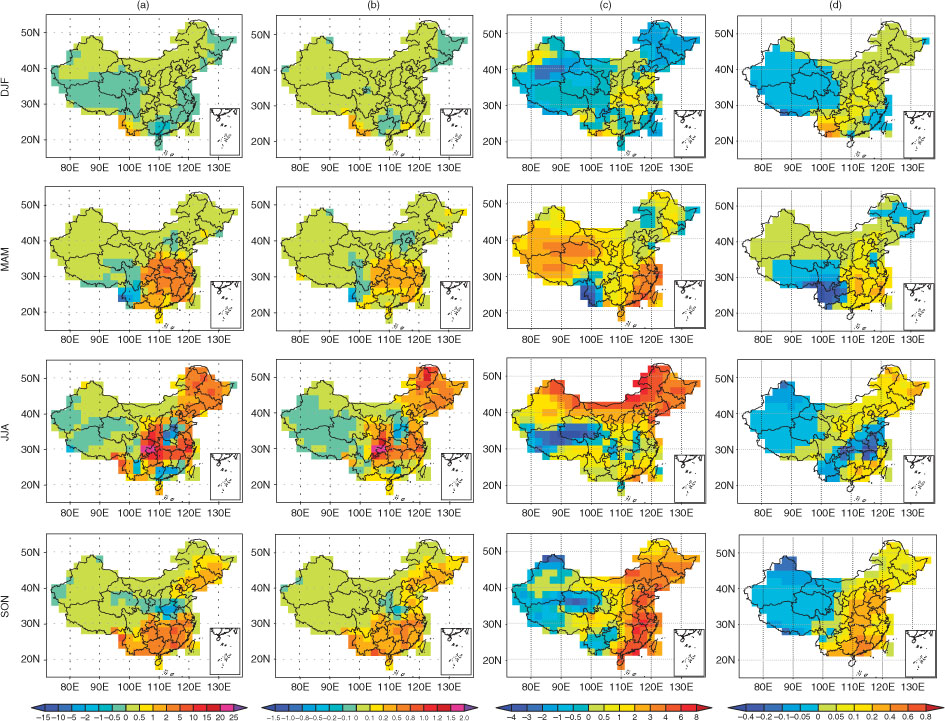
Fig. 5

Simulated seasonal mean changes from the late 1980s to the mid-2000s a result of changes in meteorological parameters alone (SENS_MET minus CTRL_1980s): (a) isoprene emissions (unit: 106 kg C month−1), (b) monoterpene emissions (unit: 106 kg C month−1), (c) surface-layer O3 (unit: ppbv), and (d) SOA concentrations (unit: µg m−3).
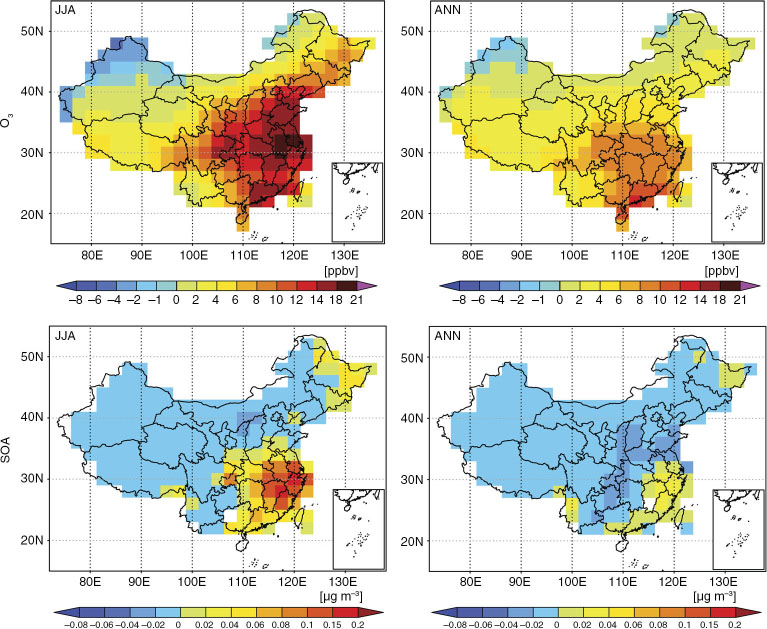
Fig. 6

Simulated changes in summer (JJA) and annual mean surface-layer concentrations of O3 and SOA as a result of changes in anthropogenic emissions over 1985–2005 (CTRL_2000s minus SENS_ANTH). Unit is ppbv for O3 and µg m−3 for SOA.

Language: English
Page range: 24987 - 24987
Submitted on: May 21, 2014
Accepted on: Oct 26, 2014
Published on: Jan 1, 2014
Published by: Stockholm University Press
In partnership with: Paradigm Publishing Services

© 2014 Yu Fu, Hong Liao, published by Stockholm University Press
This work is licensed under the Creative Commons Attribution 4.0 License.