Have a personal or library account? Click to login
Study of the relative humidity dependence of aerosol light-scattering in southern Spain Cover

Study of the relative humidity dependence of aerosol light-scattering in southern Spain

Open Access
|Jan 2014

Figures & Tables

Table 1. Hygroscopic growth factors from the literature measured for different aerosol types
Observation sitePredominant aerosol typef(RH)ReferenceCape Cod (MA, USA)Clean marinef(RH=80%)=2.2 Titos et al. (2014a) Mace Head (Ireland)Clean marinef(RH=85%)=2.2 Fierz-Schmidhauser et al. (2010c) Cabauw (The Netherlands)Maritimef(RH=85%)=3 Zieger et al. (2011) Ny-Ålesund (Norway)Articf(RH=85%)=3.5 Zieger et al. (2010) Southern Great Plains (OK, USA)Continentalf(RH=85%)=1.83Sheridan et al. (2001)Bondville (IL, USA)Continentalf(RH=82.5%)=1.4–1.5 Koloutsou-Vakakis et al. (2001)Xin'An (China)Dust dominatedf(RH=80%)=1.2 Pan et al. (2009)Jungfraujoch (Switzerland)Dust dominatedf(RH=85%)=1.3 Fierz-Schmidhauser et al. (2010b) Southern Great Plains (OK, USA)Dust dominatedf(RH=85%)=1.59 Sheridan et al. (2001)Granada (Spain)Dust dominatedf(RH=85%)=1.3This workBeijing (China)Urbanf(RH=80–85%)=1.26 Yan et al. (2009)Xin'An (China)Urban pollutionf(RH=80%)=1.57 Pan et al. (2009)Granada (Spain)Urbanf(RH=85%)=1.6This work

[i] The values of f(RH) corresponds to the ratio of the aerosol light-scattering coefficients (near 550 nm wavelength) at high RH and at dry conditions (RH<40%).

Fig. 1

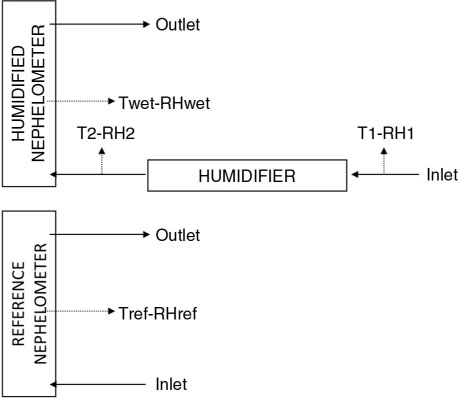
Experimental set-up.

Fig. 2

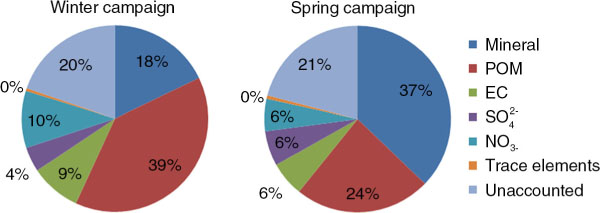
Chemical speciation of PM10 fraction during winter and spring campaigns expressed in percentages (%).The unaccounted mass fraction refers to the percentage of mass that was not determined by chemical analysis compared to the gravimetric PM10 mass. Mineral fraction was calculated as the sum of Al2O3, SiO2, CO3, Ca, Fe, Mg, K; trace elements as the sum of Li, P, Sc, Ti, V, Cr, Mn, Co, Ni, Cu, Zn, Ga, Ge, As, Se, Rb, Sr, Cd, Sn, Sb, Cs, Ba, La, Ce, Lu, Hf, Ta, W, Tl, Pb, Bi, Th and U; and POM as OC*1.6.
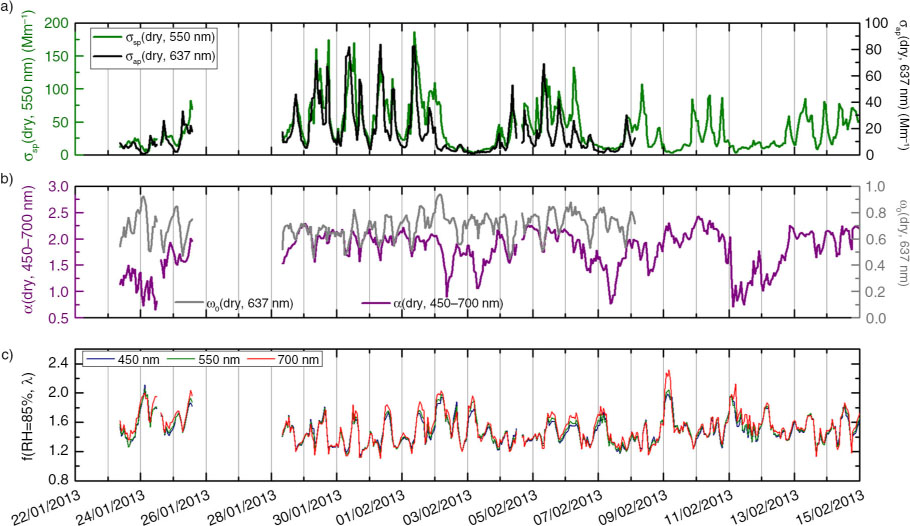
Fig. 3

Time series of hourly average values of the scattering and absorption coefficients, single-scattering albedo, scattering Ångström exponent and f(RH=85%) during the winter campaign.

Table 2. Statistical summary of the aerosol dry scattering and absorption coefficient, single-scattering albedo, scattering Ångström exponent and scattering enhancement factor at 85% RH during the winter and spring campaigns
Winter campaignSpring campaignMean±SDMedianMean±SDMedianσsp(dry. 550 nm) (Mm−1)41±342938±2631σap(637 nm) (Mm−1)17±171011±118α(dry, 450–700)1.8±0.41.91.8±0.31.8ω0(637 nm)0.70±0.090.700.73±0.110.75f(RH=85%. 550 nm)1.5±0.21.51.6±0.31.6
Fig. 4

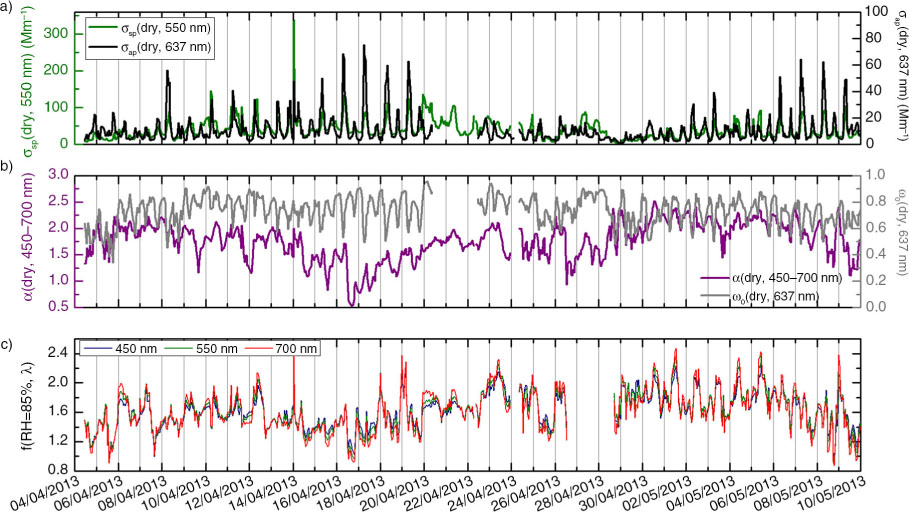
Time series of hourly average values of the scattering and absorption coefficients, single-scattering albedo, scattering Ångström exponent and f(RH=85%) during the spring campaign.
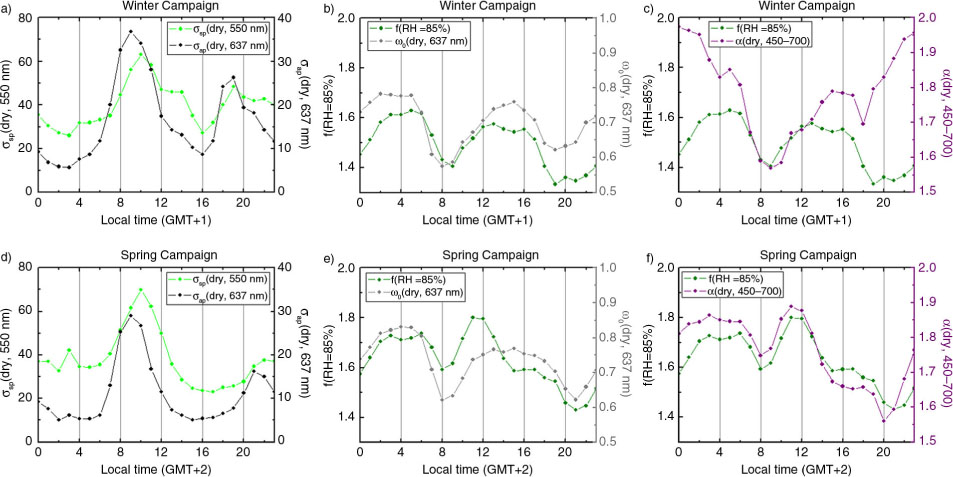
Fig. 5

Diurnal evolution of the scattering and absorption coefficients at 550 nm, scattering enhancement factor at 85% RH and 550 nm, single-scattering albedo at 637 nm and scattering Ångström exponent during the winter (upper panel) and spring (lower panel) campaigns.
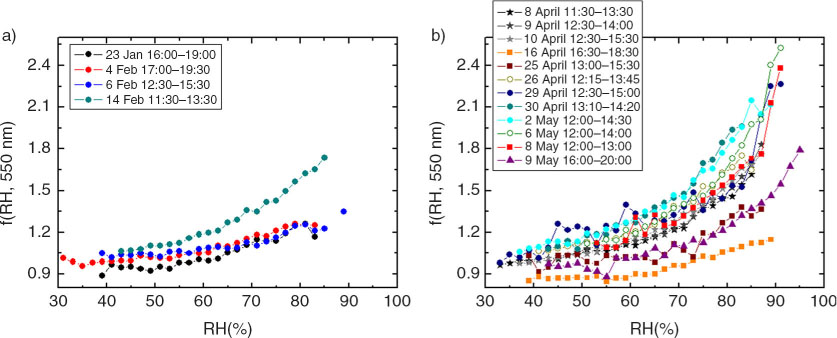
Fig. 6

Aerosol light-scattering enhancement factor at 550 nm versus relative humidity during different time periods in the winter (a) and spring (b) campaigns. Each point represents the average f(RH) value in 2% RH size bins.

Table 3. Mean and standard deviation of the dry scattering and absorption coefficients, single-scattering albedo, scattering Ångström exponent and scattering enhancement factor at 85% RH during the humidograms
Dayσsp(dry, 550 nm) (Mm−1ap(dry, 637 nm) (Mm−1) ω0(dry, 637 nm) α(dry, 450–700) f(RH=85%) Air mass classification23 Jan17±46±20.69±0.051.3±0.21.17Atlantic4 Feb48±1614±100.73±0.082.0±0.11.25Atlantic6 Feb25±86±20.76±0.031.8±0.21.23Atlantic14 Feb61±10––2.20±0.081.74Atlantic8 Apr34±1211±50.71±0.042.0±0.11.62North Europe+Atlantic9 Apr39±85±10.85±0.021.8±0.11.69Atlantic10 Apr57±97±20.86±0.032.11±0.071.69Atlantic16 Apr31±14.8±0.80.86±0.020.6±0.11.12North Africa+Mediterranean25 Apr10±34±10.66±0.051.6±0.31.32Mediterranean26 Apr50±1113±20.74±0.032.04±0.091.65Mediterranean29 Apr9±34±20.61±0.071.9±0.41.71Atlantic30 Apr25±310±20.64±0.032.4±0.11.96Atlantic2 May37±95±20.83±0.052.3±0.12.15Atlantic6 May35±1610±40.73±0.032.0±0.21.98Mediterranean8 May38±1314±60.69±0.031.8±0.21.73Mediterranean+Regional9 May24±410±60.7±0.11.3±0.21.37Atlantic+Regional
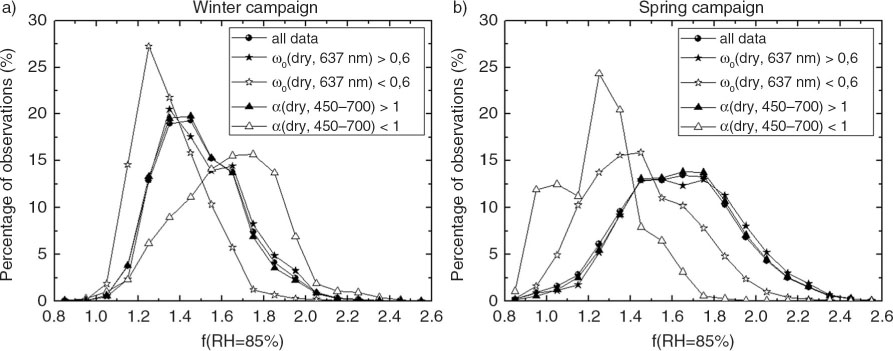
Fig. 7

Frequency distribution of f(RH=85%) at 550 nm during the winter and spring campaigns. Data for periods where α(dry, 450–700) was above and below 1 and ω0(dry, 637 nm) was above and below 0.6 were extracted and plotted separately.
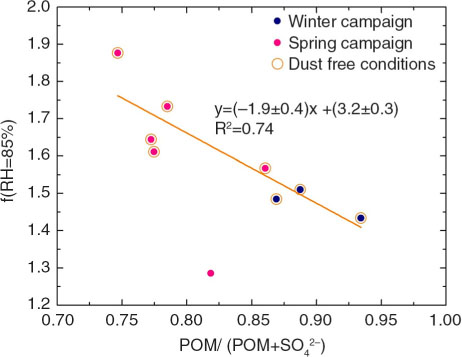
Fig. 8

Scattering enhancement factor at 85% relative humidity versus the ratio POM/(POM+SO42-) for the winter and spring campaigns. The linear fit refers to dust-free conditions.
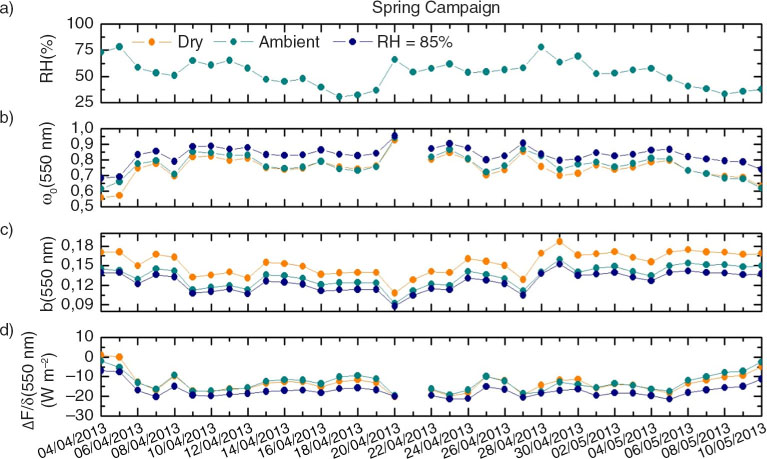
Fig. 9

Time series of daily a) Ambient relative humidity, b) single-scattering albedo at 550 nm, c) backscatter fraction at 550 nm and d) aerosol forcing efficiency at 550 nm measured with the reference nephelometer and calculated to ambient RH conditions and to RH=85% during the spring campaign.

Language: English
Page range: 24536 - 24536
Submitted on: Apr 3, 2014
Accepted on: Jul 30, 2014
Published on: Jan 1, 2014
Published by: Stockholm University Press
In partnership with: Paradigm Publishing Services

© 2014 Gloria Titos, Hassan Lyamani, Alberto Cazorla, Mar Sorribas, Inmaculada Foyo-Moreno, Alfred Wiedensohler, Lucas Alados-Arboledas, published by Stockholm University Press
This work is licensed under the Creative Commons Attribution 4.0 License.