
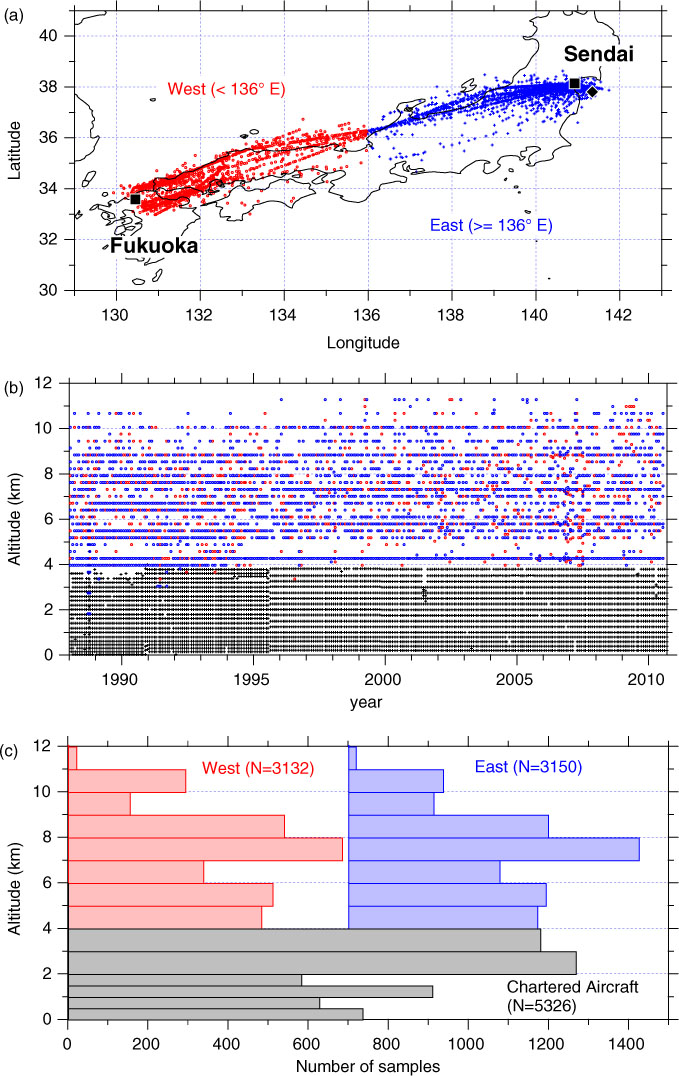
Fig. 1
(a) A map showing air sampling locations by commercial aircraft (red and blue symbols) and an approximate position for sampling by chartered aircraft (black diamond). Data on board commercial aircraft are classified into west (red) and east (blue) sides. Black squares show the locations of Sendai and Fukuoka airports. (b) An altitude–time cross section for the coordinates of all available CH4 concentration data. (c) Histograms showing number of data points at the respective altitude bins. Note that the histogram for the east data (blue) is shifted for ease of viewing.
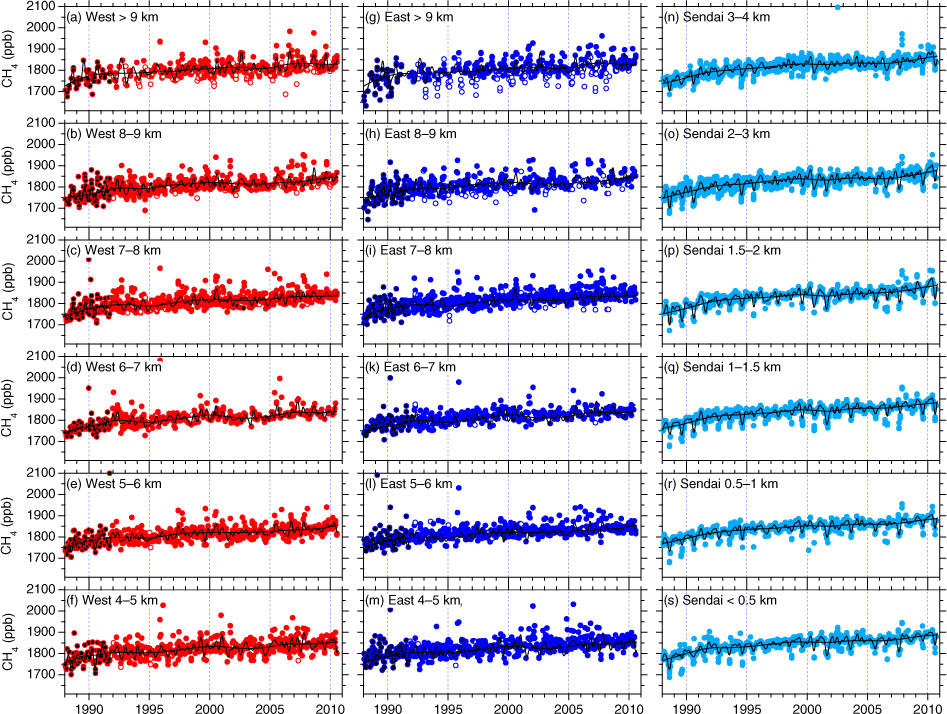
Fig. 2
Temporal variations of CH4 concentrations over (a)–(f) western and (g)–(m) eastern Japan observed using commercial aircraft and (n)–(s) over the Sendai area using chartered aircraft. Data influenced by STE events are identified using N2O data measured concurrently and shown as open circles (see Fig. A1 in Supplementary file). Data obtained before initiating N2O measurements are shown in black and are not applied for the above STE analyses. The best-fit curve (thin black line) and long-term trend (thick black line) were calculated based on data not influenced by STE events screened with N2O data.
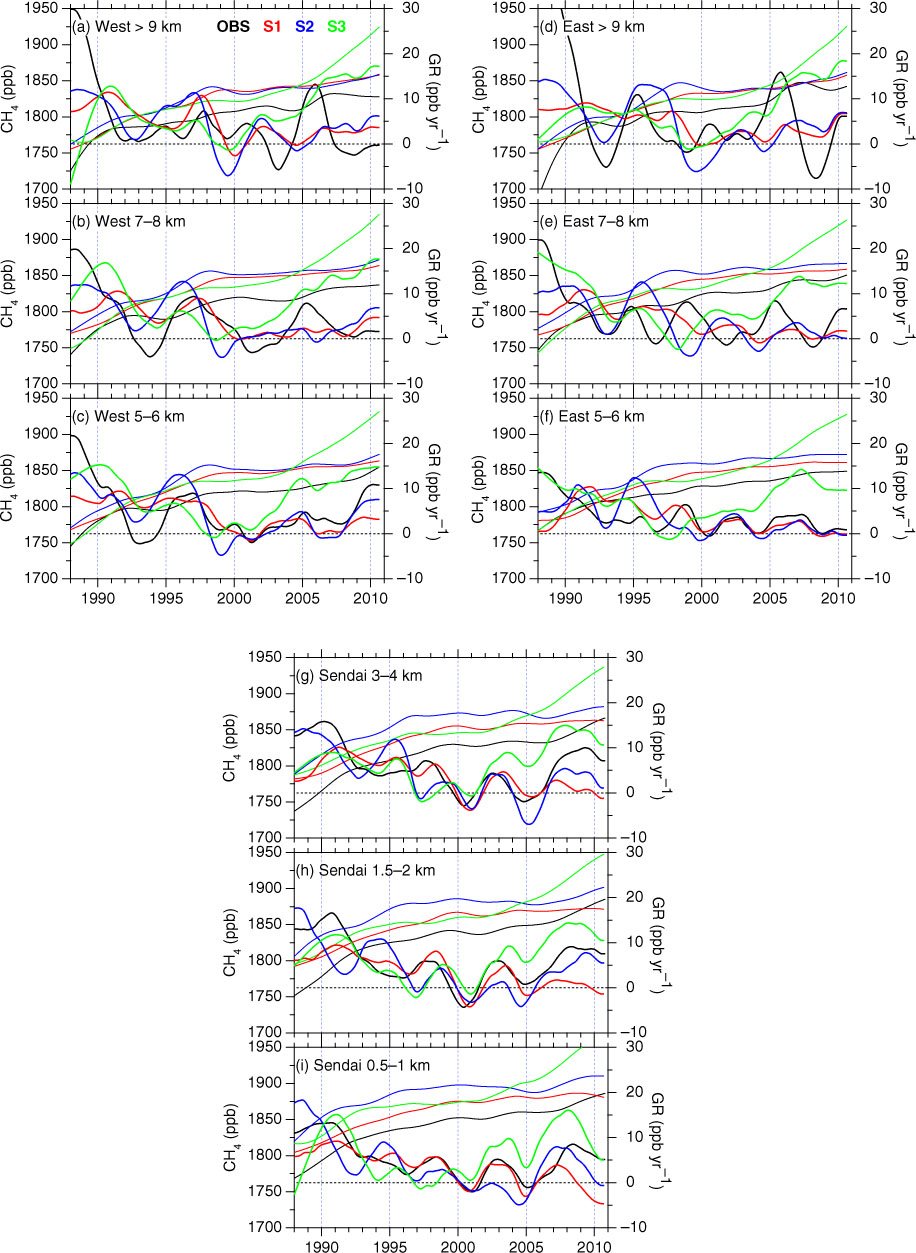
Fig. 3
Observed (black) and simulated (S1 in red, S2 in blue and S3 in green) CH4 trend (thin solid lines) and growth rate (GR, thick solid lines) at selected altitudes over Japan.
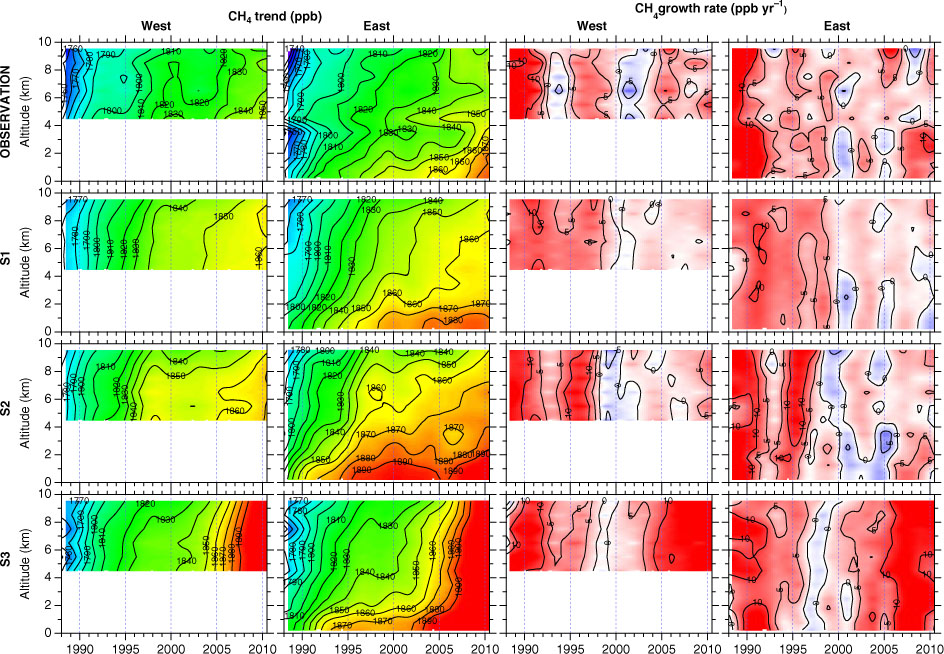
Fig. 4
Altitude–time cross sections of the long-term trend (left two columns) and growth rate (right two columns) of CH4 over Japan obtained from observations (uppermost panels) and the three ACTM simulations (lower panels).
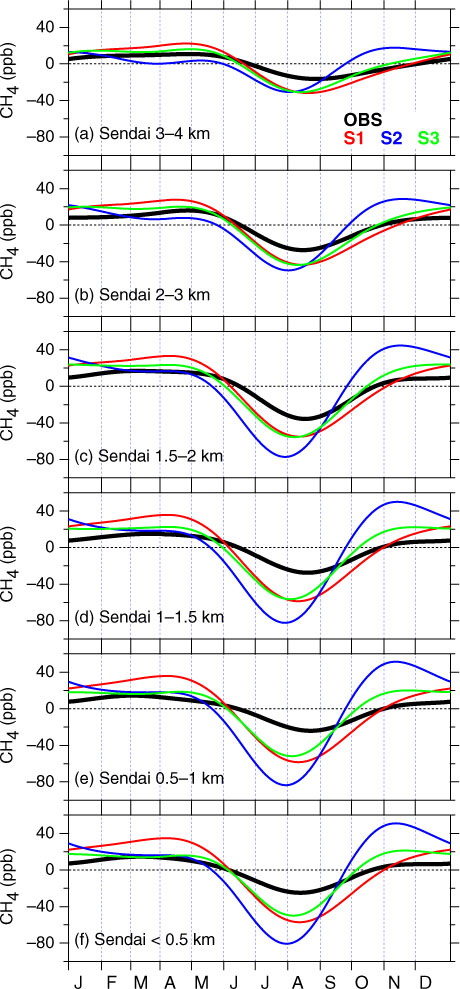
Fig. 5
Average seasonal cycles of CH4 concentrations observed (black) and simulated (colours) below 4 km over the Sendai area.
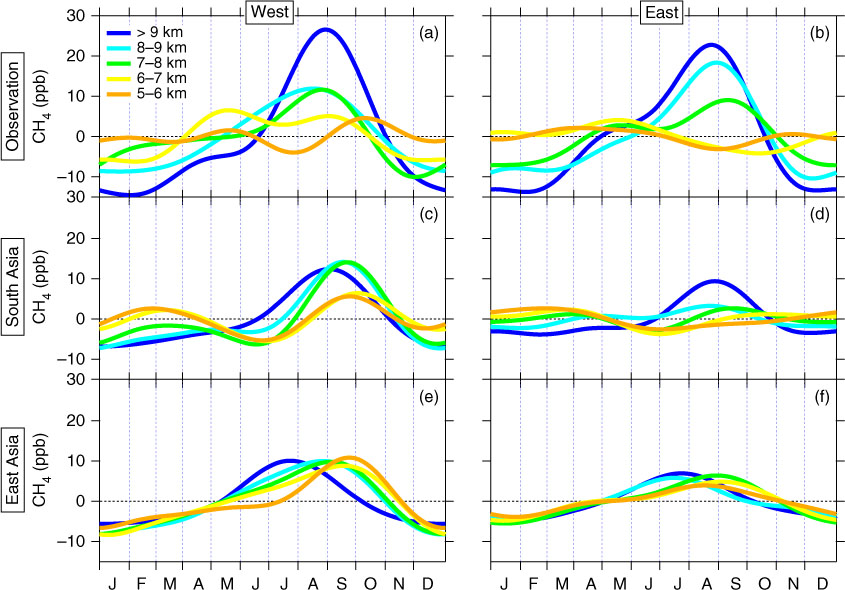
Fig. 6
Average seasonal cycles of the observed CH4 concentration in the mid- to upper-troposphere over (a) western and (b) eastern Japan. (c)(d) Same as (a)(b), but for the tagged tracers of South Asia. (e)(f) Same as (a)(b), but for the tagged tracers of East Asia.
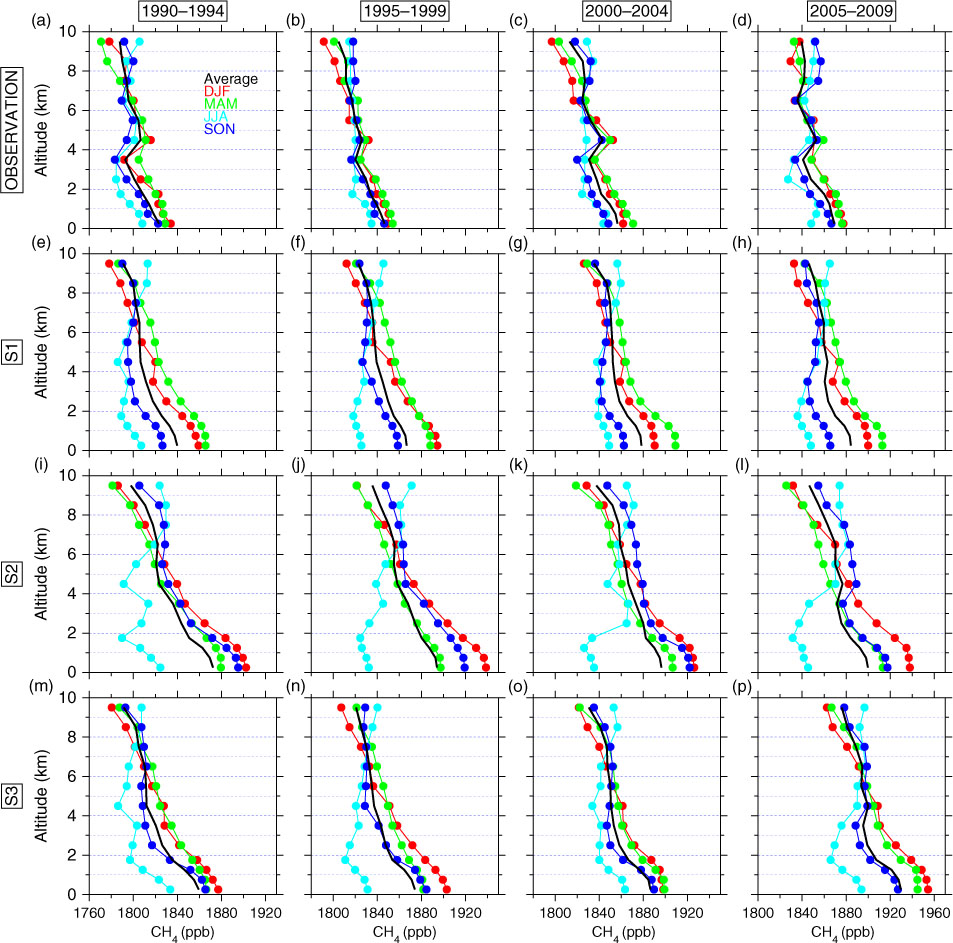
Fig. 7
Observed vertical profiles of CH4 concentrations over eastern Japan in different seasons during (a) 1990–1994, (b) 1995–1999, (c) 2000–2004 and (d) 2005–2009. Annual average profiles are shown in black, while colours show different seasons (red: December–February, green: March–May, light blue: June–August, blue: September–November). (e)–(h) Same as (a)–(d) but for the S1 simulation. (i)–(l) Same as (a)–(d) but for the S2 simulation. (m)–(p) Same as (a)–(d) but for the S3 simulation.

Fig. 8
(left) Observed annual-average vertical profile of CH4 concentrations over eastern Japan (black) compared to simulated tagged tracers (colours) for different seasons for the period 2005–2009. (right) Vertical profiles of the relative contributions of the individual source regions.