
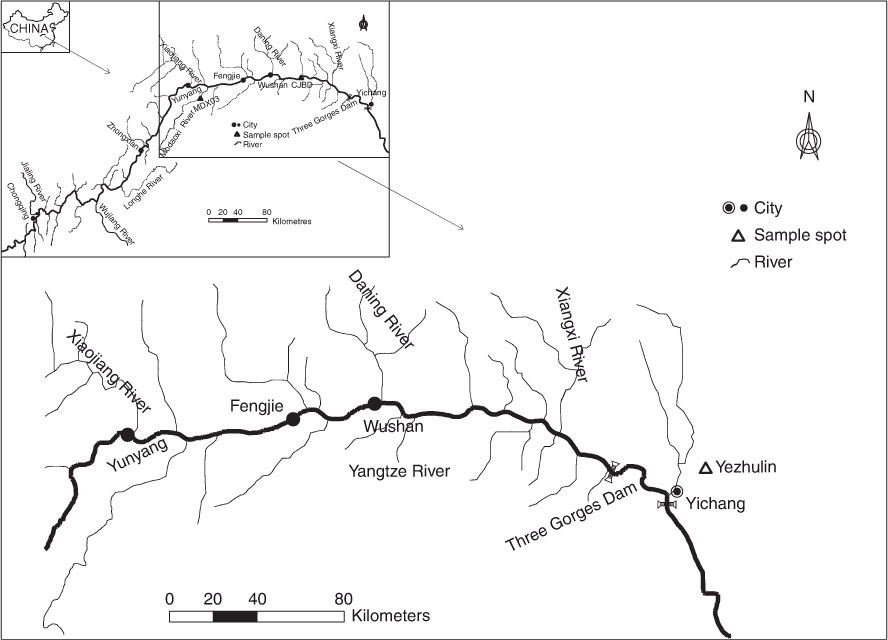
Fig. 1
Location of the sampled pond in China.
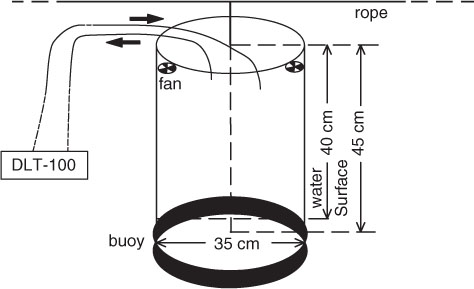
Fig. 2
Schematic design of a static chamber for measuring gas fluxes.
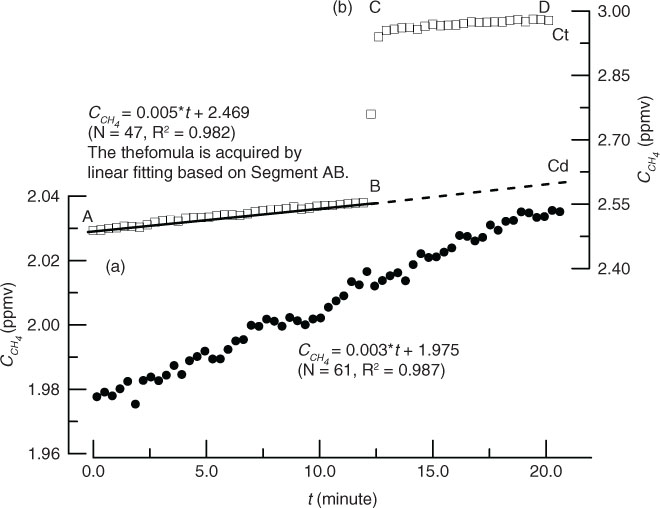
Fig. 3
Curve patterns of changes in CH4 concentration without bubble (a) and with bubble (b) during a single flux monitoring period.
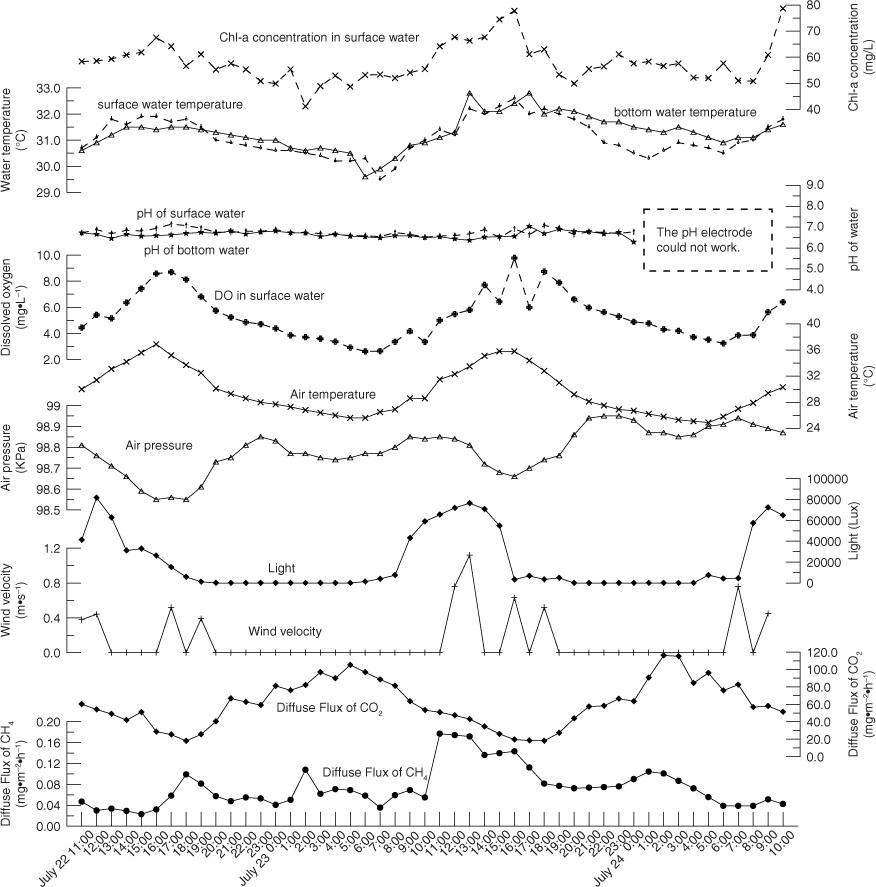
Fig. 4
Changes of environmental factors and gas fluxes during the first monitoring period.
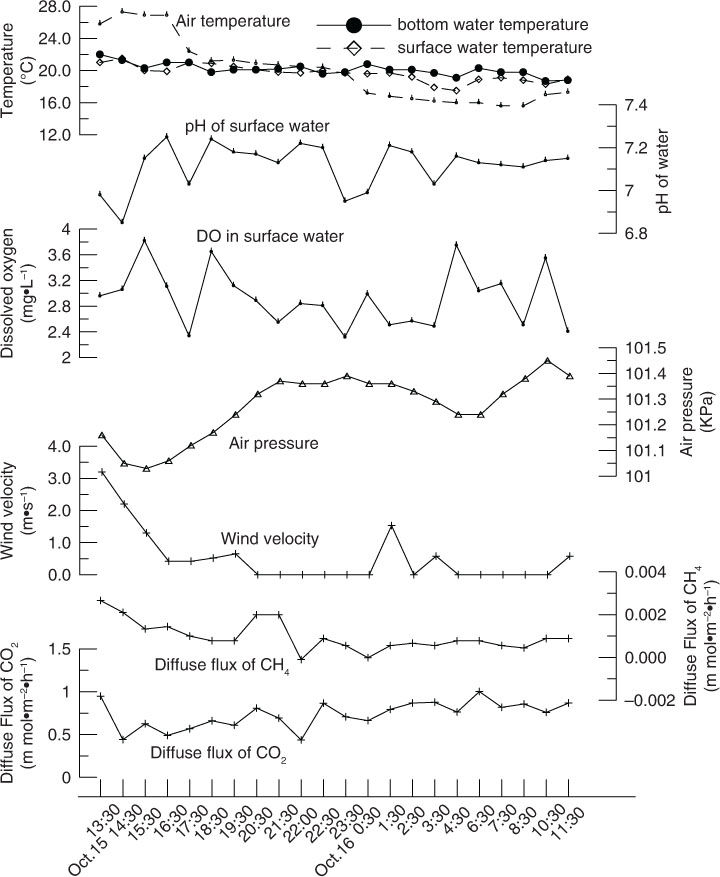
Fig. 5
Changes of environmental factors and gas fluxes during the second monitoring period.
Table 1. Variation of environmental factors, gas fluxes and transfer velocities
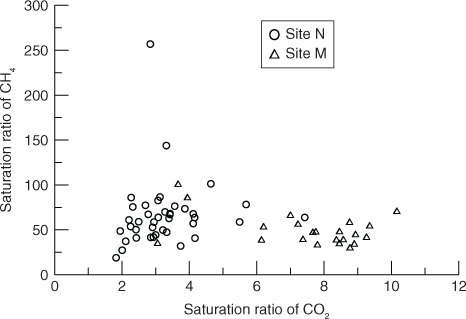
Fig. 6
The saturation ratio of CO2 and CH4 measured during the two surveys.
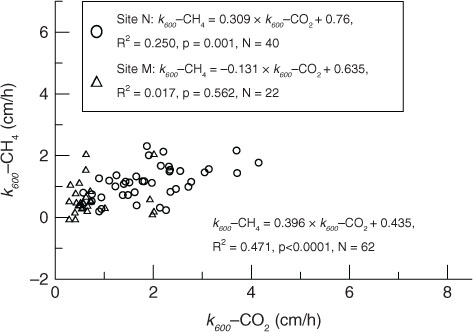
Fig. 7
Relationship between gas transfer velocities derived from CO2 and CH4, standardised to a Schmidt number of 600 (k 600).
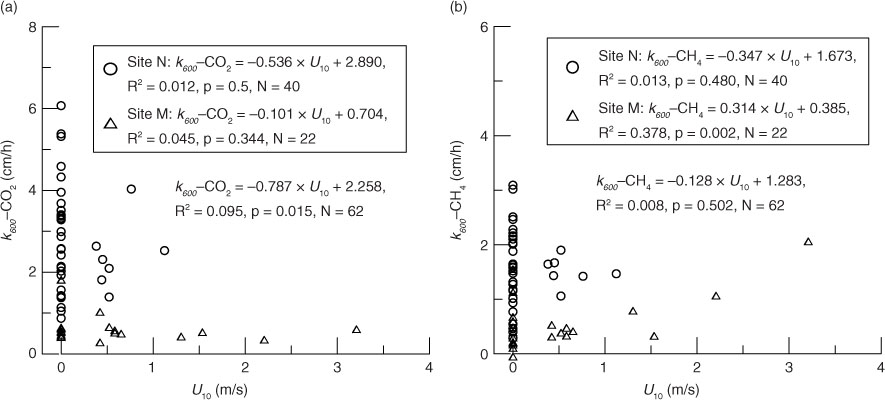
Fig. 8
Relationships between k 600 values derived from CO2 (k 600-CO2) and CH4 (k 600-CH4), and wind speed corrected to a height of 10 m (U 10).
Table 2. Average values of several environmental factors, diffusive gas fluxes and gas transfer velocity of diel monitored data according to the weather condition
Table 3. Correlation coefficients between diel diffusion flux, the dissolved gas concentration and the gas transfer velocities of CO2 and CH4 and the main environmental factors
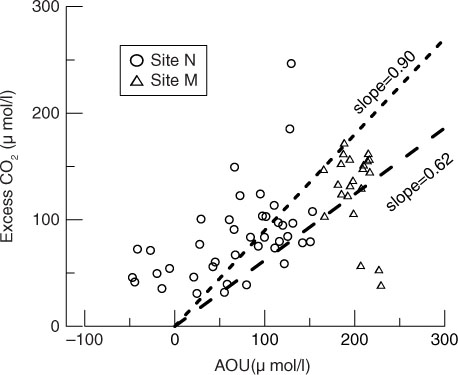
Fig. 9
Excess CO2 vs. AOU in the pond. The two dashed lines show the upper limit (slope=0.90) and the lower limit (slope=0.62) for stoichiometric ratio of aerobic biological respiration in the environment with abundance of HCO3 − (Taylor et al., 2003; Zhai et al., 2005).
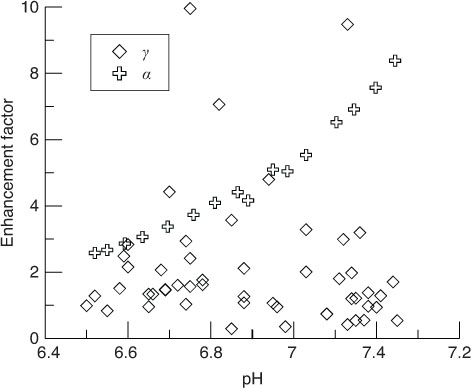
Fig. 10
Chamber estimates of chemical enhancement factor (γ) plotted vs. H&B model predictions of chemical enhancement factor (α).