
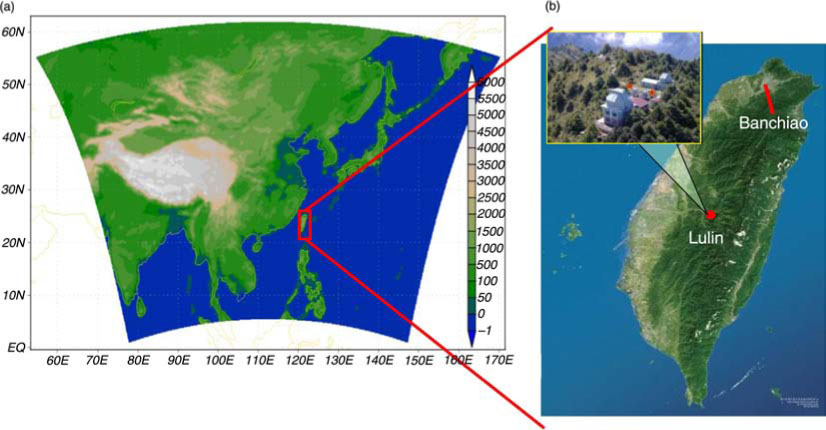
Fig. 1
(a) Simulation domain and location of Taiwan (red box) in East Asia, and (b) location of Lulin Atmospheric Background Station (23.47°N, 120.87°E, elevation 2862 m).
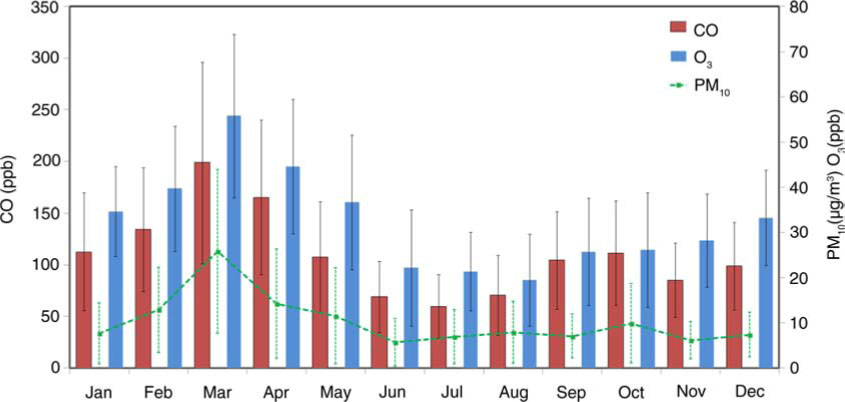
Fig. 2
Average monthly concentrations of CO (red bar), O3 (blue bar) and PM10 (green dashed line) at LABS between 2006 and 2009.
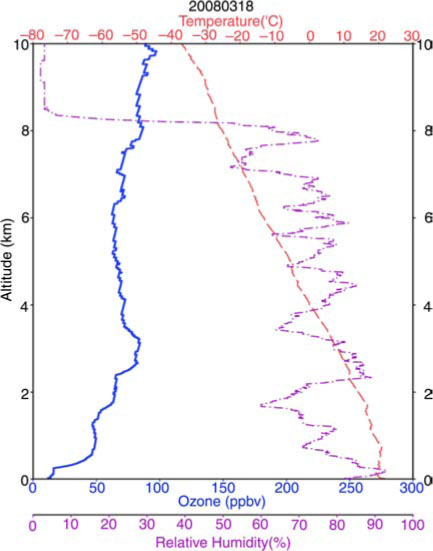
Fig. 3
Vertical profile of ozone, relative humidity and temperature over northern Taiwan (Banchiao station, 121.4°E, 24.98°N) at 00 UTC (08:00 LST) on 18 March 2008.
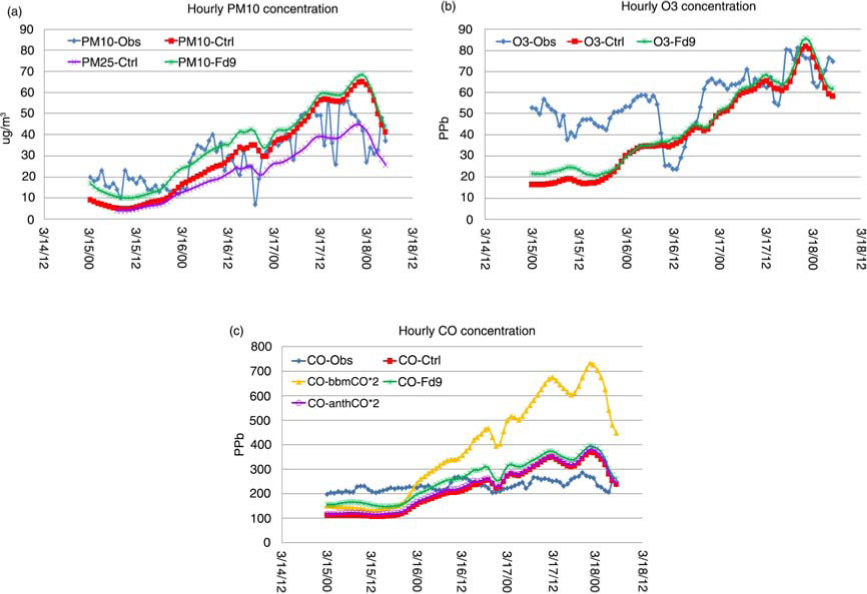
Fig. 4
Observed and simulated hourly (a) PM10 and PM2.5, (b) O3, (c) CO concentrations at LABS between 15 and 18 March 2008. Obs: observation; Ctrl: control run; bbmCO*2: CO concentration with doubled biomass-burning emission; anthCO*2: CO concentration with doubled anthropogenic emission; and Fd9: simulation starting from 9 March.
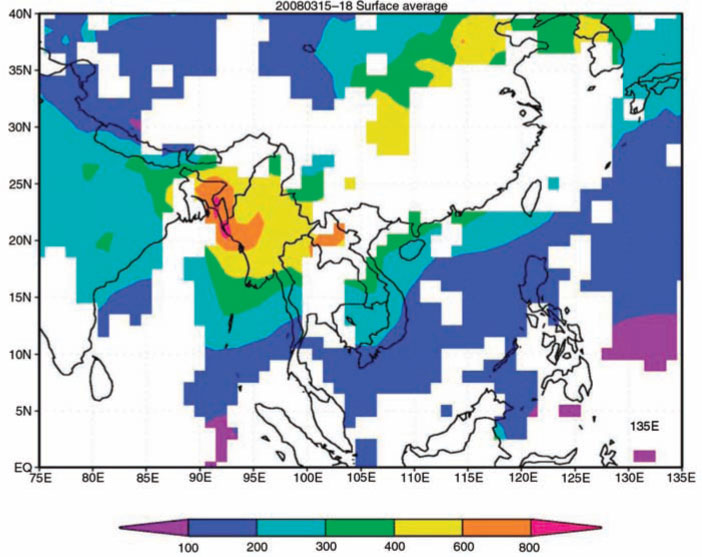
Fig. 5
Average CO concentrations at 1000 hPa obtained from MOPITT satellite between 15 and 18 March, 2008. Unit: ppb.
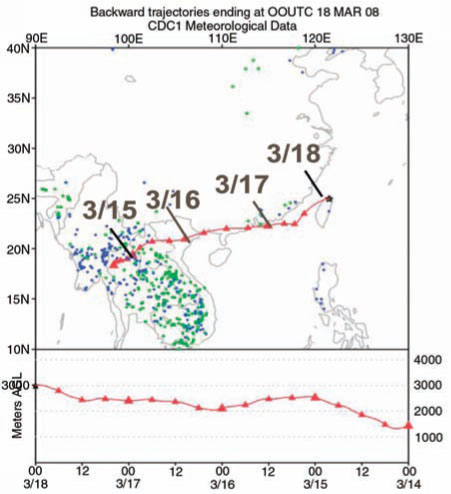
Fig. 6
Backward trajectory analysis results obtained using HYSPLIT model starting at 00:00 UTC (08:00LST) on 18 March 2008 at altitude 3000 m at Banchiao station in northern Taiwan. Distribution of active fires detected by MODIS from 15 (green dots) to 16 (blue dots) March 2008.
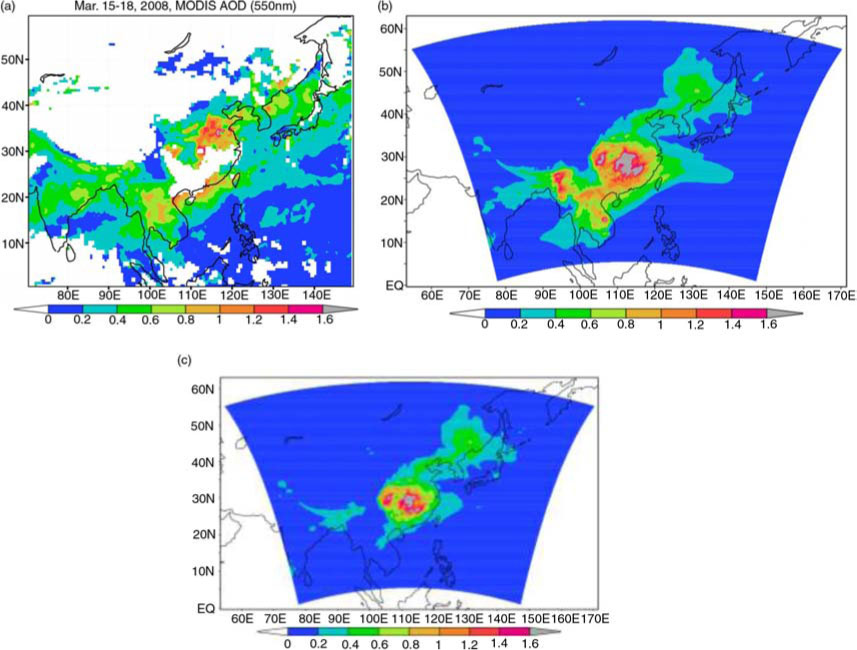
Fig. 7
Average aerosol optical depth (AOD) at 550 nm (a) deduced from the MOIDS satellite data, simulated (b) with and (c) without biomass-burning emission from 15 to 18 March, 2008.
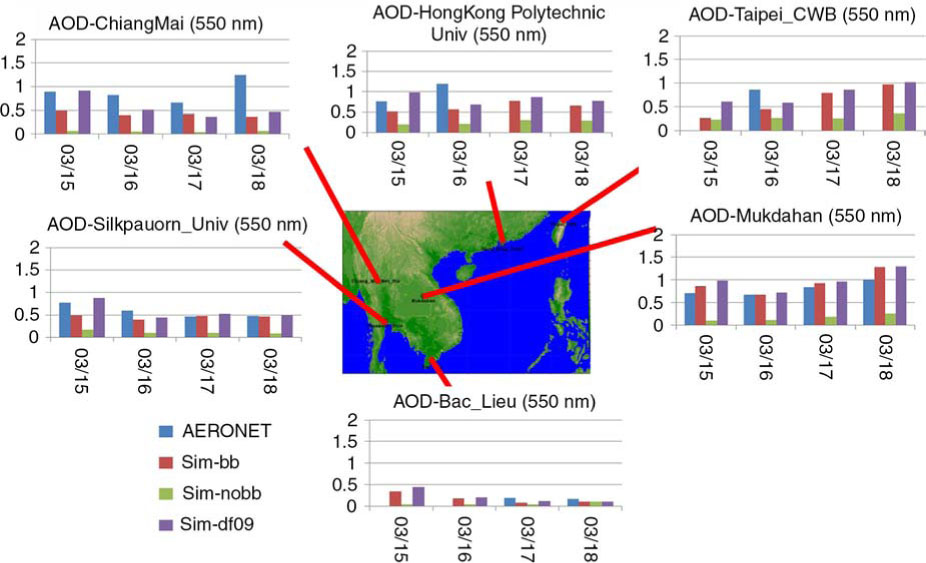
Fig. 8
Average AOD at 550 nm observed by AERONET and simulated using WRF-Chem with and without biomass-burning emission (Sim-bb and Sim-nobb) and simulation started from 09 March (Sim-Fd9) at various ground stations from 15 to 18 March, 2008.
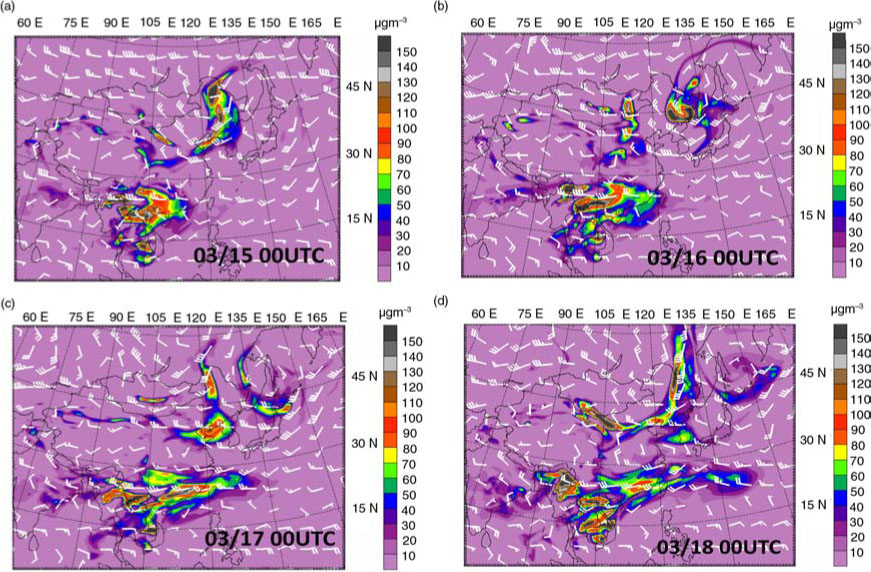
Fig. 9
Simulated distributions of PM10 concentration and wind field at 700 hPa at 00 UTC on (a) 15, (b) 16, (c) 17, and (d) 18 March 2008. A full (half) wind barb indicates 5 ms−1 (2.5 ms−1).
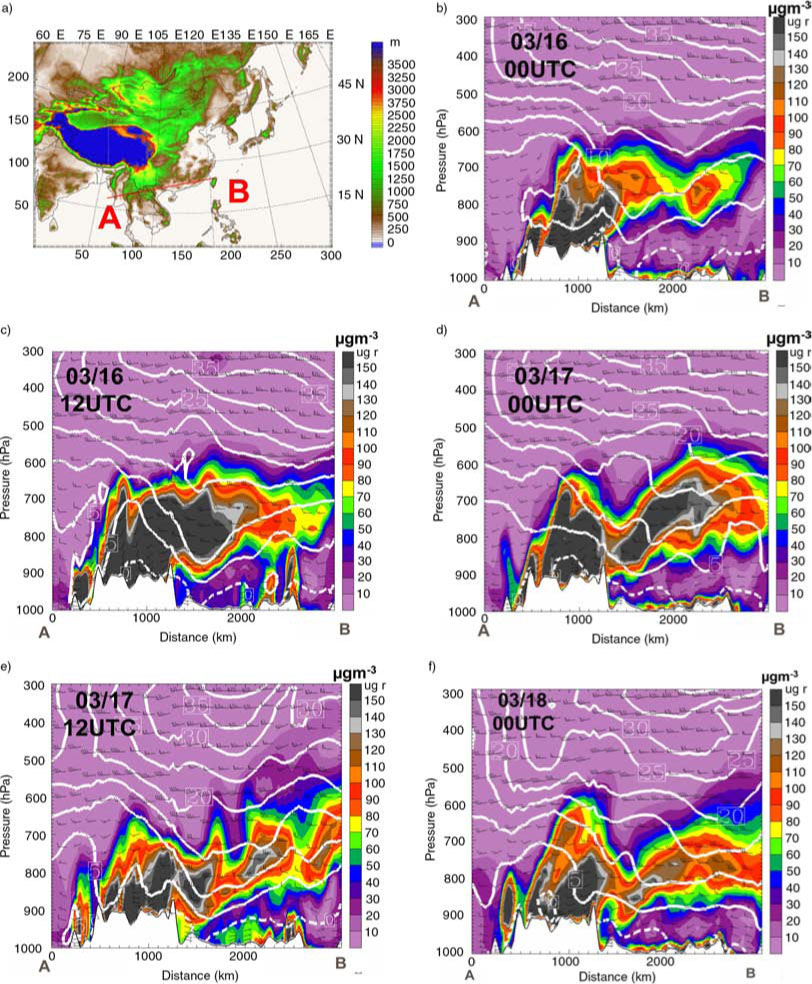
Fig. 10
(a) Geographic location and relief of Asia. (b) Vertical distribution of PM10 concentration and wind field in cross-section of AB at (b) 00 UTC 16 (c) 12 UTC 16 (d) 00 UTC 17 (e) 12 UTC 17 and (f) 00 UTC 18 March, 2008. The solid contours are the westerly wind speed shown at 5 ms−1 interval. The dashed line represents 0 ms−1.
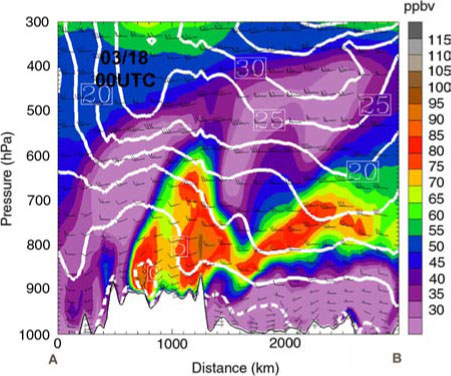
Fig. 11
Vertical distribution of O3 concentration and wind field in cross-section of AB at 00 UTC 18 March 2008.
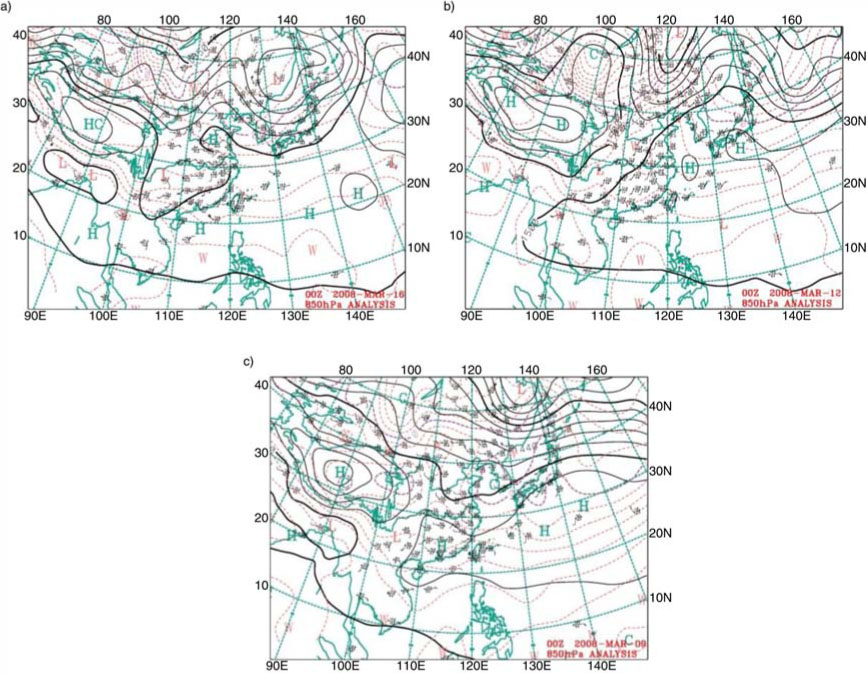
Fig. 12
Weather charts from Central Weather Bureau of Taiwan for geographic height of 850 hPa at 0000 UTC on (a) 16, (b) 12, and (c) 9 March.
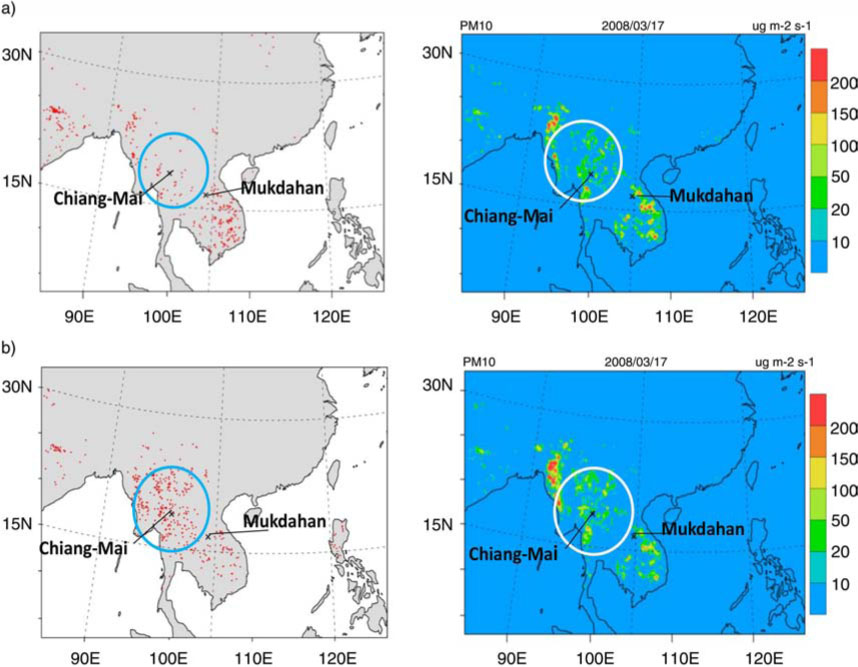
Fig. 13
Geographical distributions of (left panel) fire hotspots derived from MODIS data and (right panel) PM10 emission data from FINNv1 on (a) 17 and (b) 18 March.
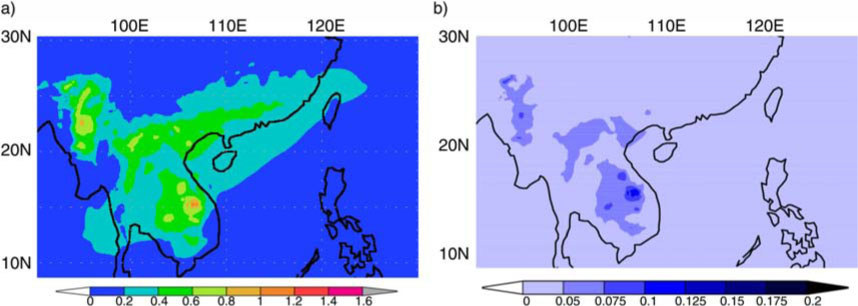
Fig. 14
Contributions of (a) OC and (b) BC to simulated average AOD between 15 and 18 March, 2008.
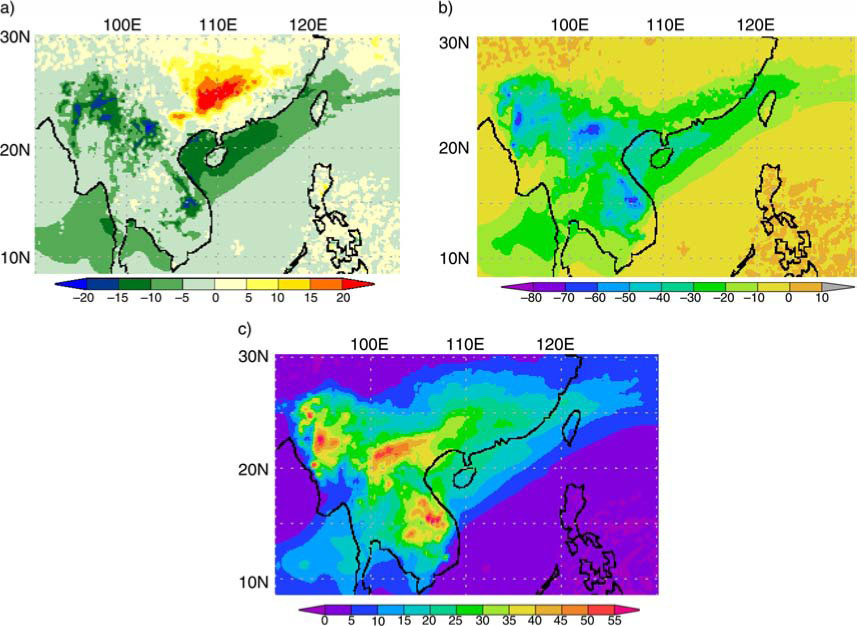
Fig. 15
Average difference in net (SW + LW) radiation fluxes simulated with and without biomass-burning emission during 15–18 March, 2008 (unit: W·m−2) at (a) the top of atmosphere (TOA), (b) ground surface (SFC), and (c) in the atmosphere (ATM).
Table 1. Average difference in radiation fluxes simulated with and without biomass-burning emission over Indochina (95–110°E, 10–25°N) during 15–18 March, 2008 (unit W·m−2)
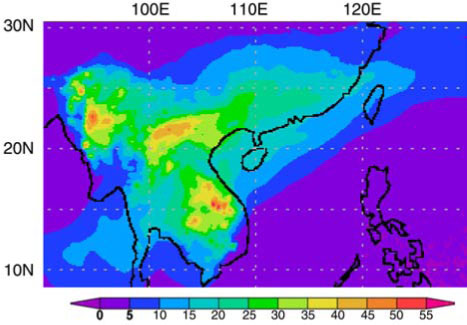
Fig. 16
Contributions of BC to simulated difference of net (SW + LW) radiation fluxes simulated with and without biomass-burning emission in the atmosphere between 15 and 18 March, 2008 (unit: W·m−2).
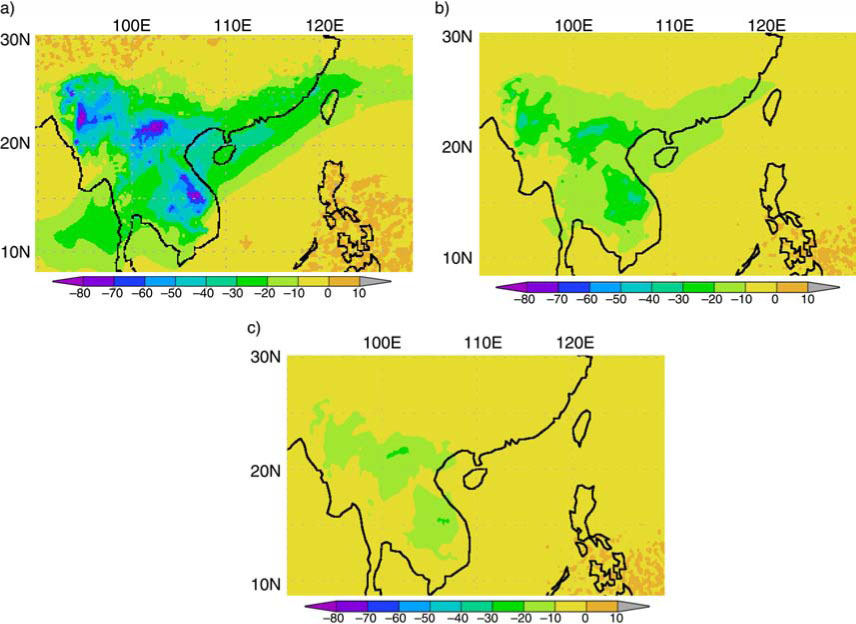
Fig. 17
(a) Average reduction in shortwave radiation fluxes at ground surface simulated with and without biomass-burning emission during 15–18 March, 2008 (unit W·m−2). Contributions of (b) BC and (c) OC to the values observed in (a).