Have a personal or library account? Click to login
Stable carbon isotopic compositions of low-molecularweight dicarboxylic acids, glyoxylic acid and glyoxal in tropical aerosols: implications for photochemical processes of organic aerosols Cover

Stable carbon isotopic compositions of low-molecularweight dicarboxylic acids, glyoxylic acid and glyoxal in tropical aerosols: implications for photochemical processes of organic aerosols

Open Access
|Jan 2014

Figures & Tables

Fig. 1

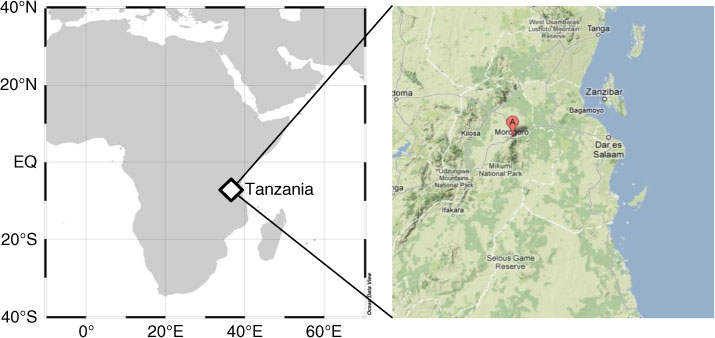
Map showing the location of the sampling site in Morogoro, Tanzania.
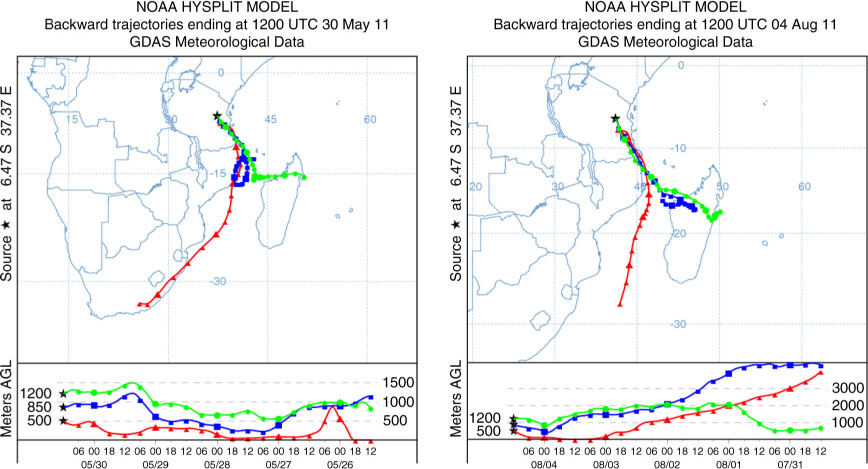
Fig. 2

Typical examples of 5-d backward air mass trajectories arriving at Morogoro during May to August 2011 sampling period.

{ label needed for table-wrap[@id='UT0001'] }

Table 1. Stable carbon isotope ratios (δ13C, ‰) of dicarboxylic acids, glyoxylic acid and glyoxal in PM2.5 aerosols collected from Tanzania, in July and August 2011

Dicarboxylic acidsDateSample IDOxalic C2Malonic C3Succinic C4Phthalic PhGlyoxylic acid ωC2Glyoxal Gly28/7TAN01−20.2−18.7−23.4NANANA29/7TAN02−15.9−20.9−20.6−27.1−29.5−25.41/8TAN03−18.3−18.8−21.8NA−21.4−19.92/8TAN04−18.1−20.7−22.5NA−22.6−18.33/8TAN05−17.0−18.9−20.9NA−18.3NA4/8TAN06−16.9−20.4−16.8−28.7−24.0−15.45/8TAN07−21.3−18.8−22.3−28.2−24.0−25.66/8TAN08NA−20.8NANA−24.0NA7/8TAN09−17.9−18.8−23.7NA−23.7−19.28/8TAN10−18.6−19.6−24.0 NA−17.6−17.3Mean−18.3−19.6−21.8−27.5−22.5−20.2±SD1.71.02.20.83.53.9

[i] Analytical errors for δ13C are within 0.2‰.

[ii] NA: Not available.

{ label needed for table-wrap[@id='UT0002'] }

Table 2. Stable carbon isotope ratios (δ13C, ‰) of dicarboxylic acids, glyoxylic acid and glyoxal in PM10 aerosols collected from Tanzania, in May through August 2011
Dicarboxylic acidsDateSample IDOxalic C2Malonic C3Succinic C4Azelaic C9Phthalic PhGlyoxylic acid ωC2Glyoxal Gly30/5TAN11−20.9−21.9−27.8NA−25.9−30.531/5TAN12−23.3−23.8−21.5NA−29.3−27.11/6TAN13−18.2−20.8NA−21.5−18.2−23.32/6TAN14−18.1−21.8−19.8NA−25.3NA4/6TAN15−19.8−18.8−24.8−22.7−29.7−23.95/6TAN16−17.3−18.6−21.3NA−33.0NA6/6TAN17−15.7−18.5−23.6NA−27−30.67/6TAN18−24.5−19.5−21.2NA−35.4−27.89/6TAN19−23.1−21.7−23.9NA−22.8−18.812/6TAN20−20.1−19.2−22.6NA−31.1NA28/7TAN21−19.5−19.0−21.4−29.8−24.2−23.5−17.929/7TAN22−16.2−18.5−26.1NANA−18.8NA1/8TAN23−17.3−17.4−20.2−26.7−25.4−24.5−20.22/8TAN24−17.6−20.5−23.4−26.3NA−21.6−21.13/8TAN25−26.4−29.0−32.2−33.4−30.5−31.6−29.04/8TAN26−18.8−19.3−21.4−26.3−25.3−24.4−15.85/8TAN27−21.5−20.9−24.4NANA−26.9−20.66/8TAN28−18.3−18.9−25.8NANA−26.3−24.87/8TAN29−24.3−18.8−23.5NANA−36.5NA8/8TAN30−16.2−17.1−18.5NA−26.7−21.3NAMean−19.9±−20.2−23.3−28.5−25.2−26.7−23.7±SD3.12.73.23.12.95.14.8

[i] Analytical errors for δ13C are within 0.2‰.

[ii] NA: Not available.

Fig. 3

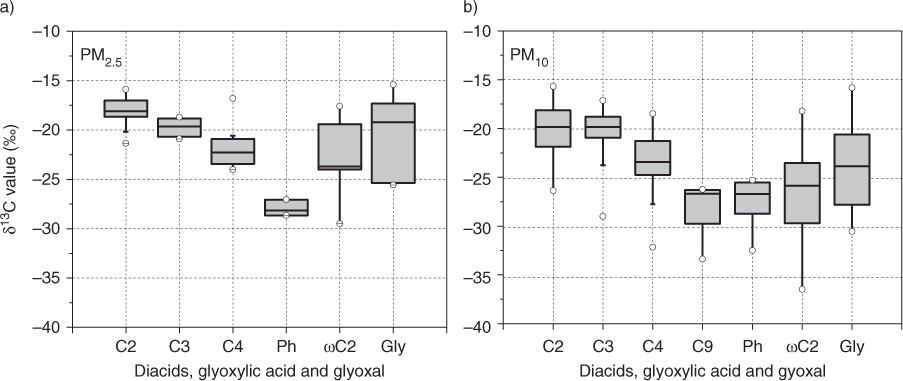
Box plot of stable carbon isotope ratios of diacids, glyoxylic acid (ωC2) and glyoxal (Gly) in PM2.5 and PM10 aerosols from Morogoro, Tanzania, collected during the campaign. Each box shows the median (black line), the interquartile range (box) and the minimum and maximum values. Open circles show the outliers.
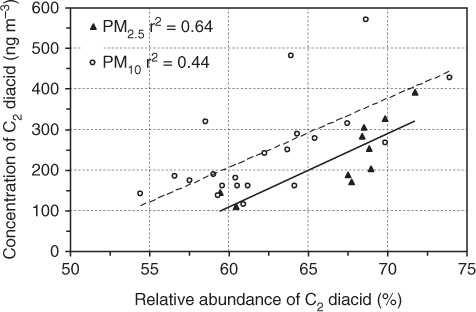
Fig. 4

Relation between concentrations of oxalic (C2) acid and its relative abundance to total diacids in PM2.5 and PM10 during 2011 sampling period in Morogoro, Tanzania. Data from Mkoma and Kawamura (2013).
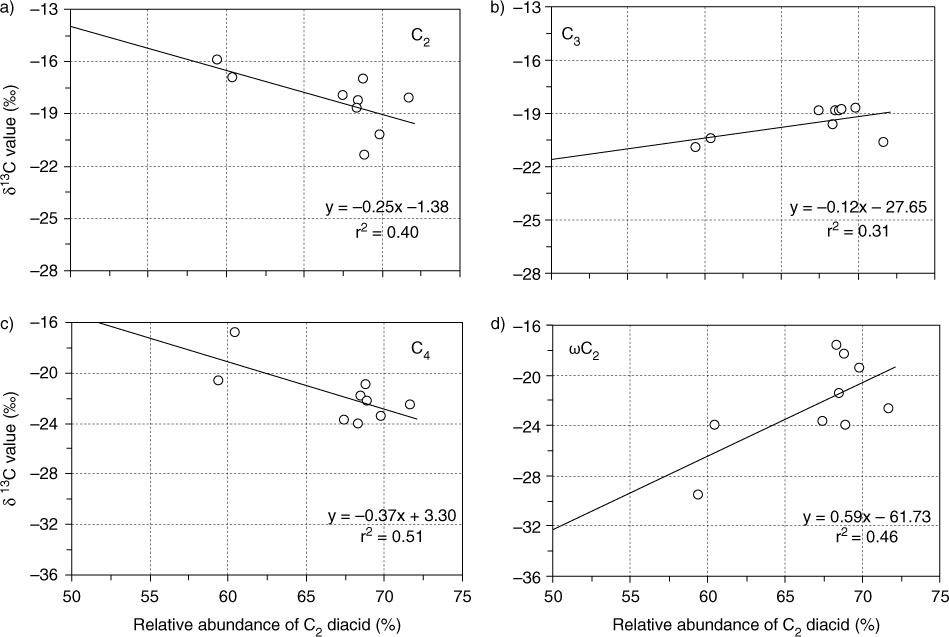
Fig. 5

Plot showing the linear relation of stable carbon isotopic composition (δ13C) for (a) C2, (b) C3, (c) C4 and (d) ωC2 acids with relative abundance of oxalic acid (C2%) to total diacids in PM2.5 during 2011 sampling campaign in Morogoro, Tanzania.
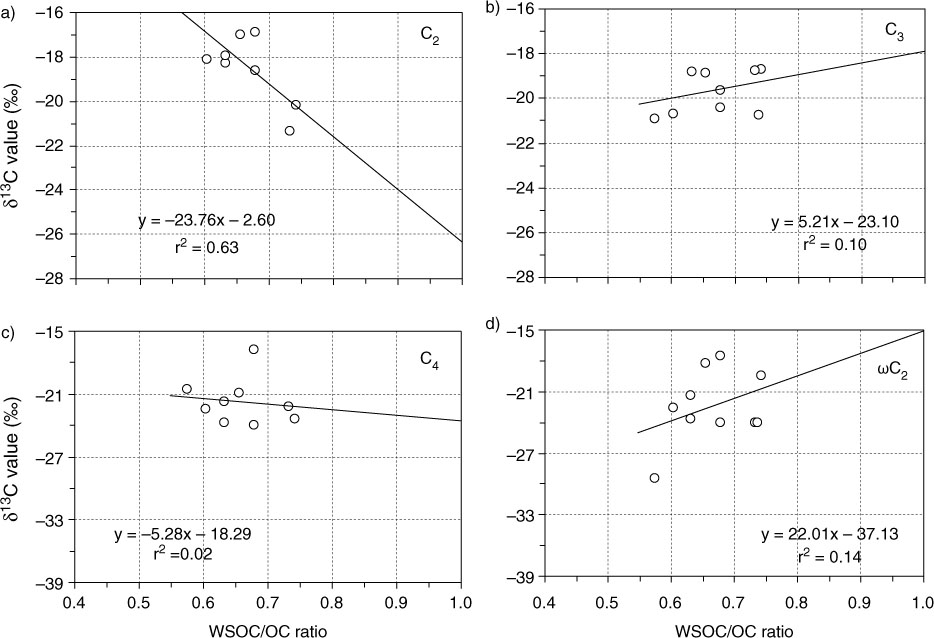
Fig. 6

Relation between stable carbon isotope ratios (δ13C value) of diacids and WSOC/OC ratio in PM2.5 during 2011 sampling period in Morogoro, Tanzania.

Language: English
Page range: 23702 - 23702
Submitted on: Dec 29, 2013
Accepted on: Sep 10, 2014
Published on: Jan 1, 2014
Published by: Stockholm University Press
In partnership with: Paradigm Publishing Services

© 2014 Stelyus l. Mkoma, Kimitaka Kawamura, Eri Tachibana, published by Stockholm University Press
This work is licensed under the Creative Commons Attribution 4.0 License.